Bearish Pennant on NZD/USD @ D1A bearish pennant is visible on this NZD/USD daily chart. If the pair closes significantly below the pennant's lower border, it might signal a continuation of the preceding downtrend. The pennant and its pole are shown with the yellow lines. My potential stop-loss level is marked with the red line (0.56726), it is placed at the high of the pennant area. My potential take-profit level is marked with the green line (0.54873), it is placed at the pole's length below the stop-loss. I will wait for the price to close well below the lower border of the pennant area to enter a short position.
Chartpatterntrading

USD/CAD Breakout OpportunityTrading Idea: USD/CAD Breakout Opportunity
USD/CAD has paused its four-day rally, trading near 1.4400 during the Asian session. The Canadian Dollar is supported by rising oil prices, with WTI nearing $73.50 per barrel, while US Dollar strength from the Fed’s hawkish stance limits the downside.
Technical Outlook:
The pair is consolidating within a rectangle pattern. The best trading approach is to wait for a confirmed breakout:
Upside breakout: Indicates continued bullish momentum.
Downside breakout: Signals a potential CAD-driven correction.
Key Levels to Watch:
Resistance: 1.4430–1.4450
Support: 1.4360–1.4380
Risk management is essential—always use stop-loss orders and manage your position size to protect your capital.
Follow for more trading ideas and education!

Descending Triangle on Brent @ D1A descending triangle pattern has formed on the daily chart of the spot Brent oil. It follows a long-term downtrend in the oil price and can be used for a bearish breakout setup. The triangle's borders are marked with the yellow lines. The cyan line is where my potential entry level will be. It is located at 10% of the pattern's height below the lower border. The green line denotes my take-profit level. It is set to the 100% of the pattern height plotted below the lower border. I will set the stop-loss level to the triangle's highest point (81.710) - the red line. I will ignore bullish breakouts from this trend continuation pattern.

MAX HEALTHCARE IN AN UPTREND CHANNEL...NSE:MAXHEALTH trade at 910 level. Stock trade in a Uptrend Channel, So you can watch for more upside move...

Repeating Pattern in PAGE INDUSTRIES...NSE:PAGEIND trade at 43200 level. Stocks shows its ready for going ALL TIME HIGH LEVEL, on the chart make a Repeating structural chart pattern. So you can watch for an Upside Move.

Ready for Breakout...NSE:PNBHOUSING trade @ 865. Resistence @ 950 Support @ 750.
After the Breakout you can watch it next resistence @ 1200 and 1400.

Ready for a Range Breakout...NSE:ECLERX trade at 2715. Resistence is @ 2820 & Support is @ 2320
on the daily time frame chart make a long range. After the Breakout you can watch it as a next Resistence @ 3400...

Follow The Trend or Wait for Retracement...NSE:BAJAJ_AUTO trade at 10500. Support is at 9700 and Resistance at 10600.
P/E RATIO - 36.35 Industry P/E - 23.75
On the 23rd AUG Bajaj Auto give a Breakout above 10000 level. You can wait for Retracement otherwise Follow the Trend for Next Resistance at 11200-11500.

Ready for Breakout...NSE:AMBER trade at 4550. Support is @ 4000 Resistance is @ 4800.
on Daily chart when stock break its resistance level, you can watch it next Resistance @ 6000

GBPUSD SELLim looking on selling the market when price get to the box bacuse price have been ranging for the holidays...

DOUBLE BOTTOM BREAKOUT On M30 timeframe indicates a double bottom is currently forming from a bullish momentum after the price had deeply plummeted so the breakout confirms the Buy signal

$APT 1D | HTF (Update)Everything that I have mentioned in the previous post is still valid/applies. As long as we defend the swing low (“S-LOW”), the price tends to move to higher levels. It can either be an SFP or a breaker , both of which are confirmed.
Happy trading

DASHUSDTTrendline Break: A break above a significant downtrend line signals a shift in market sentiment from bearish to bullish. This is a key technical signal that buyers are starting to gain control.

#DOGECOIN - CRASH TO $0.27 BEFORE HEADING TO THE MOON ?!will dogecoin experience a dip to $0.27 before skyrocketing towards $0.74 and eventually $1? Some indicators suggest we might see a liquidity sweep with a few wicks to shake out leveraged positions before the real bullish momentum kicks in.
what dou you think will happen?:
1️⃣ bullrun towards new highs without major corrections?
2️⃣ drop to $0.27 for liquidity before the breakout?
share your thoughts below!

CardanoThis is the analysis that I have on Cardano. I like that the retracement came back to the 50% level. I entered the trade at 1.04 on a limit order. Thank you for allowing me to share!

$TXN down 15% from ATHsInteresting setup here. $200 is the target. $200c March 2025. Could see a run up into earnings JAN 28th.
WSL

$CRWD upside channel $360 targetThe Daily 5m looks phenomenal and so do some of the hourlies. Flow is showing mixed. Calls sold, calls bought. I see one above ask $350 strike. This chart looks solid if we don't break down $340. This is on my watch. I see inverted head and shoulders forming hoping this bottoms out and an upside channel in a flag. Eyeing $360c 2025. Follow and leave a comment.
WSL

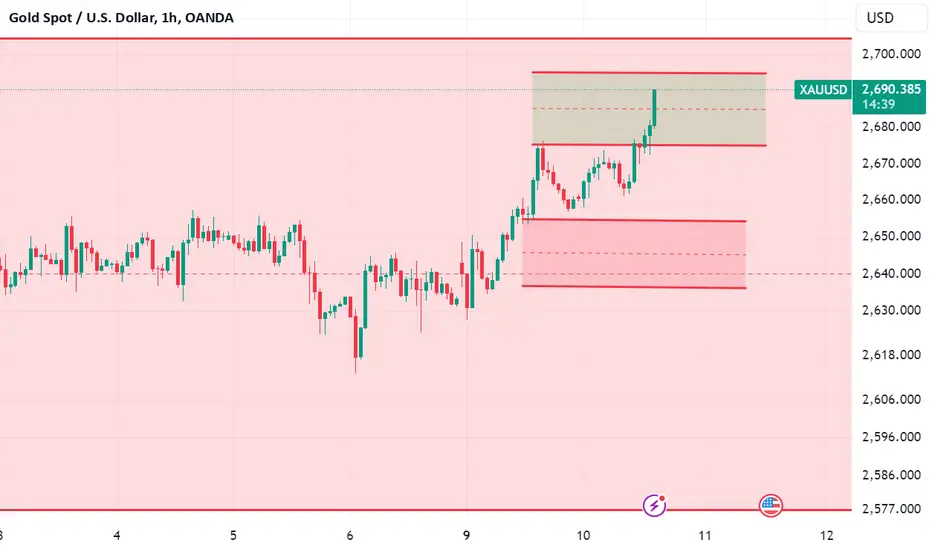
#XAUUSD STILL IN VAILD ZONE The XAUUSD long zone remains valid as the price holds above a key support level, indicating strong bullish potential. Traders are advised to monitor the price action closely for confirmation signals, ensuring a confident entry into the market for the next potential upward move.
TESLA $TSLA | TESLA RALLY TO 400?! (ASCENDING TRIANGLE) Dec05'24TESLA NASDAQ:TSLA | TESLA RALLY TO 400?! (ASCENDING TRIANGLE) Dec05'24
NASDAQ:TSLA BUY/LONG ZONE (GREEN): $357.50 - $400.00
NASDAQ:TSLA DO NOT TRADE/DNT ZONE (WHITE): $331.00 - $357.50
NASDAQ:TSLA SELL/SHORT ZONE (RED): $270.00 - $331.00
NASDAQ:TSLA Trends:
NASDAQ:TSLA Weekly Trend: Bullish
NASDAQ:TSLA Daily Trend: Bullish
NASDAQ:TSLA 4H Trend: Bullish
NASDAQ:TSLA 1H Trend: Bullish
NASDAQ:TSLA is hanging on to the strong bullish rally that first began after the most recent earnings report (Oct23), followed by the Trump rally after the presidential election. NASDAQ:TSLA has been building an ascending triangle at the 360 price level, and a popular belief is that a break above this level will be the start of the push to the 400 price level. Here is what I'm personally looking at for possible NASDAQ:TSLA trade opportunities, potential for upside and downside, and how I'm viewing price structure and technicals with the help of some of my personal indicators!
This is what I would personally look at before entering trades, everything is subject to change on a daily basis and as I analyze different timeframes and ideas.
ENTERTAINMENT PURPOSES ONLY, NOT FINANCIAL ADVICE!
trendanalysis, trendtrading, priceaction, priceactiontrading, technicalindicators, supportandresistance, tesla, NASDAQ:TSLA , tsla, teslaearnings, teslatrend, teslamomentum, teslalong, teslashort, teslatrade, teslaidea, tesladirection, teslaearningsreport, teslareport, teslarelease, teslamodel2, teslamodel3, teslamodel3performance, teslaconference, teslanews, teslacall, teslaput, teslaoptions, teslapatterns, teslachartpatterns, teslasupport, tslatrend, tslamomentum, tslatrade, tslalong, tslashort, teslabuy, teslasell, elonmusk, elon, nasdaq, ndx, ndq, qqq, us100, nas, tech, techstocks, ev, evstocks, teslaearnings, robotaxi, robotaxi event, tesla1010event, 10/10event, teslarobotaxi, teslarobocap, teslarobovan, teslaearningsreport, teslarallyto400, teslapricetarget, teslaascendingtrianglepattern, patterntrading, ascendingtriangle,

DXY seems going HIGHER as STRONG ECONOMIC DATATVC:DXY currently traded higher after strong economic data last Friday. NFP data told us that US labor market remain strong. We also can see at Tuesday Job Opening data which showed us "higher than expected - higher than previous month" and finally drives the price up. At the last speech, Powell also said that FED isn't in a rush condition to reduce the interest rate. All of this information gives more optimism to big player in the market to buy dollar.
Technical analysis in the picture tells TVC:DXY failed to make breakout movement below weekly trendline support and seems continue to move to it's last high around 106.75. If this resistance can't hold the price, it will be double bottom chart pattern and could move dollar to it's 22 Nov high around 108.xx
So currently i saw buy opportunity for dollar and sell opportunity in the counter currency of dollar.

USDCAD Bulls Eye 1.4140 Amid Momentum ShiftHello Traders,
Take a moment to read my outlook on USDCAD, and share your thoughts
Overview
USDCAD is currently trading at 1.40623, showing bullish trends on both the H4 and H1 timeframes. However, the bullish momentum on the H4 appears to be weakening, suggesting the uptrend may be nearing a potential reversal zone. Market sentiment remains bullish, supported by increased volatility, but momentum on the H1 timeframe has noticeably decreased, signaling reduced upward strength.
Idea
The pair is expected to continue its rise toward the 1.4140 price region, a key resistance level with the potential to halt further upward movement and trigger a bearish reversal. Price action is currently rejecting off the H1 order block, which could act as a short-term support level.
I will monitor the 1.39797 level closely, as a break below this support would invalidate the bullish outlook, signaling a potential shift in market structure. Conversely, a sustained move above the 1.4140 resistance would indicate renewed bullish momentum and the possibility of further gains.
Conclusion
This outlook suggests further upside potential toward 1.4140 which is about 80pips move. However, a clear break below 1.39797 would invalidate this idea, and could provide opportunities for short positions.
Cheers and happy trading!

EURNZD:Likelihood of Convergence of 2 Emerging Harmonic PatternsHello traders,
Trust you are doing great.
Below is my analysis of EURNZD currency pair.
The EURNZD pair, currently trading at 1.78462, is showing potential for a rally due to the convergence of two emerging harmonic patterns: a bearish Cypher and a bearish Butterfly. Both patterns suggest a potential move toward 1.81648, where their D leg projections align.
Key Highlights
Bearish Cypher Pattern:
X Leg: 1.82737 (October high)
A Leg: 1.78362
B Leg: 1.80714
D Leg Target: 1.81648
Bearish Butterfly Pattern:
X Leg: 1.80714
A Leg: 1.77412 (November low)
B Leg: 1.80401
C Leg: 1.77857
D Leg Target: 1.81648
The convergence at 1.81648 strengthens its significance as a potential resistance level and a critical zone to watch for a reversal.
Invalidation Point
A break below 1.77412 (November low) would invalidate both patterns and shift the outlook to bearish.
Conclusion
This alignment suggests a short-term rally, but the bearish nature of both patterns implies a possible reversal near 1.81648.
Do let me have your thoughts.
Cheers and happy trading!

Requested NQ Levels - NQ Bias chartJust one of my charts requested by the two people who read. On the 4h time frame they DO NOT, and I'll repeat, DO NOT leave fair value gaps untested. The only one theyve left is from the August 5 Yen unwind, which was quite artificial. Anyway, not super bearish or bullish, just cautious at the moment. Risk reward for me plays out in a question that sounds like, "Do you want to risk -30% for another +10%?" or would you rather forgo the 10% and find something a bit more better value? Think that's how a lot of NQ stocks are being looked at end of year. Again not calling for a rug, but quite possible NQ lags the IWM for this next leg. We will see, anyway feel free to ask any questions the chart is a bit messy, like my brain.
