EURJPYIf price action shows a buy confluence then we have a bias. Pay attention that we are on an Overbought condition. Wait for structure to form and indications to follow.
Chartpattren

💬(What is your next target for gold)Technical analysis ✅ FXOPEN:XAUUSD TVC:DXY
traders gold moving today USd
Both data positive im seller and gold moving down 2010)
What is next target for you experience)? My trade position selling zoon 2040+
2020)
Gold's fundamental analysis involves considering various factors that influence its value. Key elements include:
Interest Rates: Gold and interest rates have an inverse relationship. When interest rates are low, gold becomes more attractive as it doesn't offer a yield. Conversely, higher rates may divert investors towards interest-bearing assets.
Inflation: Gold is often viewed as a hedge against inflation. During periods of rising inflation, investors may turn to gold to preserve their wealth.
Global Economic Conditions: Economic instability or geopolitical tensions can drive investors towards gold as a safe-haven asset.
Central Bank Policies: Actions taken by central banks, such as buying or selling gold reserves, can impact gold prices.
Currency Strength: Gold is priced in USD, so changes in the strength of the US dollar can influence gold prices. A weaker dollar typically boosts gold prices.
Supply and Demand: Like any commodity, gold's price is influenced by supply and demand dynamics.
Mining Costs: The cost of mining can influence the production levels and, consequently, the supply of gold in the market.
Market Sentiment: Public perception and investor sentiment also play a role. Market sentiment can be influenced by news, economic reports, and overall market conditions.
Remember, a comprehensive analysis should consider a combination of these factors, and it's crucial to stay updated on global economic trends and events that might impact the market.

Symmetrical Triangle pattern breakout in POLYCABPOLYCAB INDIA LTD
Key highlights: 💡⚡
✅On 1Hour Time Frame Stock Showing Breakout of Symmetrical Triangle Pattern.
✅Strong Bullish Candlestick Form on this timeframe.
✅It can give movement up to the Breakout target of 4891+.
✅Can Go Long in this stock by placing a stop loss below 4200-.

⤵⤵ gold fundamental analysis)technical analysis). traders are you looking for a bearish trandline gold Market this week gold fullback down 👇 1980? Gold seller reject the resistance levels breakdown I think 💬 gold moving down 2040 fullback down 1980
Fundamental Analysis of Gold FXOPEN:XAUUSD TVC:DXY
The outlook created by the fundamental analysis of the gold market remains strong with the growing uncertainty in the world economy and rapidly expanding money supply. As governments try to cope with financial turbulence, they print more and more fiat money (money that is not backed with material assets). This fuels inflation that eats away government bonds yields. If the yields themselves are lower than the inflation, then you actually lose purchasing power by holding these bonds. In such a situation, investors switch to assets they believe will allow them to preserve their wealth. Gold is precisely one of such assets.
Entry 2021
Entry 2040
Target 1980
safe trade ❣️🙏 pales like 👍 and comments 👇


#NIFTY Intraday Support and Resistance Levels -18/01/2024Nifty will be gap down opening in today's session. After opening nifty start trading below 21550 level and then possible downside rally up to 21430 in today's session. in case nifty trades above 21600 level then the upside target can go up to the 21720 level.

[INTRADAY] #BANKNIFTY PE & CE Levels(17/01/2024) Today will be gap down opening in BANKNIFTY. After opening if banknifty start trading below 47950 level then possible downside rally of 400-500 points upto 47550 Level in todays session.Any Major upside only expected in case banknifty starts trading above 48050 level to 48450 level.

CARDANO|Price return from important resistance areaCardano failed to break the last high, and the resistance zone did its job well, preventing the price from growing further.
With the return of the price, we see the formation of a double-top pattern. If the selling pressure is to the extent that it breaks the support area downwards and confirms the price pattern, we expect the price to experience the price area of 0.4425 and then the price of 0.3877.

#Bitcoin bearish breakout of very important trendline
We can clearly see in this chart that the price has reached the upper boundary of a bullish channel, where it would encounter selling pressure.
As a result of this selling pressure, the price on Friday, January 12th, formed a bearish impulsive candle. Following this candle, it managed to break below the short-term bullish trendline that the price had respected in the last few months.
The bearish breakout of this trendline is a second signal, after the rejection from the bullish channel, that we might see further bearish movement in Bitcoin.
If you've found this analysis helpful, please take a moment to like, comment, or share your thoughts with me.

⤴️⤴️ Gold vip) fullback up ⬆️)Hello trader’s what do you think about gold) ?
Gold this week fullback up ⬆️
gold cpi news service 2024) down back up 2065) retest support 2030)
And breakdown support levels fullback 2086) resistance levels)
Looking 👀 H4 tame-frame🖼️ ⤴️⤴️
Looking 👀 3H tame frame 🖼️ ⤴️⤴️
Looking 👀 2H tame frame 🖼️ ⤴️⤴️
safe trade 🙏🙏❤️🩵 Plaes like 👍🏻 and comment’s)

⤴️⤴️🖼️GPBAUD) bullish momentum cup)Hello trader’s what do you think about) GPBAUD) ?
traders are you looking 👀 a cup bullish pattern) I think wait for handle) bullish momentum)
Entry 1.88574.
Target 1.90597
Target 1.91732
Safe trade 🙏🙏❤️🩵 Plaes like 👍🏻 and comments)

⤵⤵DXY INDEX FULLBACK DOWN 👇he'll traders what do you think about dxy)
Dxy index hit resistance levels trandline fullback down 👇 101•000 100,000
TVC:DXY

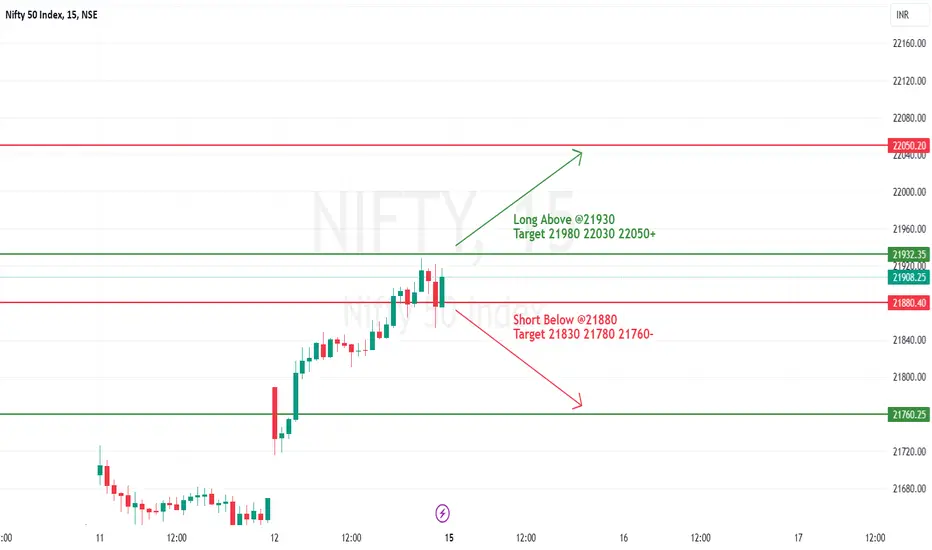
Falling Wedge pattern breakout in NIFTY 50NIFTY 50 INDEX
Key highlights: 💡⚡
✅On 15 MIN Time Frame Stock Showing Breakout of Falling Wedge Pattern.
✅Strong Bullish Candlestick Form on this timeframe.
✅It can give movement up to the Breakout target of 22040+.
✅Can Go Long in this stock by placing a stop loss below 21700-.

#NIFTY Intraday Support and Resistance Levels -15/01/2024Nifty will be gap up opening in today's session. After opening nifty sustain above 21930 level and then possible upside rally up to 22050 level in today's session. in case nifty trades below 21880 level then the downside target can go up to the 21760 level.
📊⤴️⤴️ EURUSD VIP BULLISH MOMENTUM LONG TRADE)⤴️⤴️📊Hello trader’s what do you think about eurusd)?
dear traders I think 4H trand line this week Cpi news soo I think eurusd fullback resistance levels my Postens open 01.09000
Long trade) bullish momentum)
Target 1.10357)
Target 1.10837)
Target 1.11657)
GBP/USD remained consolidative on Thursday, bid just above 1.26 and offered just above its 10-DMA at 1.2707, as traders cogitate over U.S. and UK rate pivots later this year, looking toward Friday's payrolls data and next Thursday's CPI data for clues about the timing and depth of Fed rate cuts.
For now, traders are reacting to Wednesday's slightly dovish Fed minutes, which noted prior rate hikes are having their intended effect reducing inflation and growth, and near-unanimity that rates will be lower by year-end 2024.
Sterling traders' reluctance to move GBP/USD out of its 1.26-1.27 range hints at consensus that both the BoE and Fed are at peak rate levels.
Though futures are pricing a near-80% chance the Fed will begin rate cuts in March 2024 (0#SRA:), ahead of the BoE expected in May 2024 (0#SON3:), the near-symmetrical rate paths foreseen for the two central banks in 2024 is keeping GBP/USD anchored near current levels.
U.S. jobs data on Friday could disrupt the current GBP/USD rate stasis. Should payroll and earnings data surprise to the upside, a delay in Fed cuts is likely to weigh on GBP/USD, putting multiple support levels in the 1.2630s in sharper focus.
FX:EURUSD

Bullish Flag pattern breakout in DIXONDIXON TECHNOLOGIES LTD
Key highlights: 💡⚡
✅On 1 Day Time Frame Stock Showing Breakout of Bullish Flag Pattern.
✅Strong Bullish Candlestick Form on this timeframe.
✅It can give movement up to the Breakout target of 7900+.
✅Can Go Long in this stock by placing a stop loss below 6120-.

⤵️⤵️ US30) bearish sentiment momentum) analysis)Hello trader’s what do you think about Us30)
Usd30 down trandline market price retest fullback down looking 👀 for berash price cup momentum )
Entry 37368.00
Target 37075.76
safe trade 🙏🙏🩵❤️ pales like 👍🏻 and comments)

Potential Short on BTCBTC is currently in an ascending wedge with bearish RSI divergence wait for a break of trendline before taking a position with stoploss at last swing high with target at next area of support, moving SL to BE when safe to do so and then follow with a trailing stop looking for a bigger move down. Good luck traders.

[INTRADAY] #BANKNIFTY PE & CE Levels(05/01/2024) Today will be gap up opening in BANKNIFTY . After opening if banknifty sustain above 48050 level then possible upside rally of 400-500 points upto 48450 & this rally can extend another 400 points if market gives breakout 48550 level. Any Major downside only expected in case banknifty starts trading below 47950 level.

⬆️🖼️. DOLLAR Index trade line bullish momentum analysis)⤴️⤴️Hello trader’s what do you think about DXY index )?
traders are looking 👀 a 4H tame frame 🖼️ trade line dxy hitting support levels and trade line now dxy bak up ⬆️ 102.381 to 102.573)
The dollar index fell to below 101 on Wednesday, the lowest in five months, as markets continued to position according to signs of cooling US inflation, and consequently, incoming rate cuts from the Federal Reserve.
Data released on Friday showed that the core PCE index, the Fed’s preferred inflation gauge, fell to 3.2% in November from 3.4% in October, coming in below forecasts of 3.3%.
Markets are now pricing in around a 90% chance that the central bank may start its cutting cycle by March.
The dollar traded close to multi-month lows against other major currencies, but has been gaining ground versus the Chinese yuan amid expectations that the People’s Bank of China would lower key rates next

⤵️ EURAUD) ifberakout) bearish) analysis)⤵️⤵️hello trader’s what do you think about Euraud)?
The Australian and New Zealand dollars rested near five-month peaks on Friday and bonds extended their blistering rally as a surprisingly soft reading on U.S. inflation stoked wagers for rapid-fire rate cuts globally next year.
The Aussie crested at $0.6803
AUDUSD
, having climbed 1% the previous session to clear the $0.6800 barrier for the first time since late July. The break opened the way to the next bull target at the double top of $0.6895/6900.
The kiwi dollar reached $0.6298
NZDUSD
after rising 0.7% on Thursday, taking it closer to the July top of $0.6412.
Risk appetite was whetted by an unexpected downward revision to the U.S. third-quarter core personal consumption expenditures (PCE) price index to an annualised 2.0%, matching the Federal Reserve's target.
That stirred speculation the November reading of core PCE inflation due later Friday would also surprise on the downside, leading futures to imply an 82% chance the Fed would cut rates as soon as March. (FEDWATCH)
Markets, in turn, ramped up expectations for local easing with futures now fully priced for a June rate cut by the Reserve Bank of Australia (RBA), even though the central bank still has a tightening bias. (0#RBAWATCH)
The Reserve Bank of New Zealand (RBNZ) is now seen certain to ease in May, when it recently warned that no cuts were possible until 2025. (0#RBNZWATCH)
Australia's November consumer price measure is not due until the end of January but again analysts see risks to the downside.
"We expect annual growth in the monthly CPI indicator to slow to 4.1% y/y in November from 4.9% y/y in October," said Catherine Birch, a senior economist at ANZ. "This would be the weakest annual inflation on the monthly measure since January 2022."
"We expect inflation, on a quarter-on-quarter basis, to be annualising within the RBA's 2-3% target band in the second half of 2024."
Bond markets are acting like all this is a done deal and have taken three-year yields (AU3YT=RR) down to its lowest since early June at 3.667%. That breached a major chart barrier at 3.69% and was a world away from a 4.48% top hit in November.
Yields on 10-year bonds
AU10Y
fell to a four-month trough of 4.04%, down from its November peak of 4.999%.
In New Zealand, the key two-year swap rate (NZDSM3NB2Y=) hit its lowest since February at 4.680%, opening a huge gap to the overnight cash rate of 5.5%.

⬆️🎄 Gold bullish momentum) analysis ⬆️⬆️👀⬆️Hello trader’s what do you think about gold) ?
Traders are expected to reach a bullish momentum on this week’s
Gold now retest 2055 support levels
Now gold breakdown support levels
Resistance levels bak up ⬆️ 2070
Nxet Resistance levels up ⬆️ 2080
To key point
2070⬆️
2080⬆️

#NIFTY Intraday Support and Resistance Levels -01/01/2024Nifty will be gap down opening in today's session. After opening nifty start trading below 21700 level and then possible downside rally up to 21580 in today's session. in case nifty trades above 21750 level then the upside target can go up to the 21870 level.
