📊 (GOLD DOUBLE TOP) if breakout) 2090 moving)💥💥hello trader’s what do you think about gold) ?
Traders are looking 👀 a double top
Resistance levels if breakout. Nxet Target 2090 Waiting for breakout
key levels 2043
key levels 2076
Key levels 2090
(Follow me don’t miss next ideas)
Chartpattren

Rising Wedge pattern breakout in CONCORCONTAINER CORPORATION OF INDIA LTD
Key highlights: 💡⚡
✅On 1 Hour Time Frame Stock Showing Breakout of Rising Wedge Pattern.
✅Strong Bullish Candlestick Form on this timeframe.
✅It can give movement up to the Breakout target of 874+.
✅Can Go Long in this stock by placing a stop loss below 838-.

LINKUSDT - Elliott Wave Analysis - BullishBINANCE:LINKUSDT LINKUSDT - Elliott Wave Analysis - Bullish
Article: The price chart analysis of ChainLink (LINK) using the Elliott Wave Theory, with lines drawn by this indicator, highlights it as one of the cryptocurrencies to watch.
The long-term (1-week) price chart of ChainLink (LINK) has shown a bullish movement since 2020, breaking through several key resistance levels and continuing to climb steadily.
The structure created by the indicator's automatic line drawing clearly shows that we are potentially in wave 3 of a bullish trend while concurrently in wave C of a bearish correction. Therefore, we expect prices to reach levels at $86, $105, and $137 respectively.
However, other factors should be considered when forecasting future price directions such as fundamental asset factors, technical factors, and economic conditions. The fundamentals for LINK are strong due to its popularity as a DeFi project with increasing real-world usage. Technical indicators support an upward trend.
Factors supporting the upward trend for ChainLink include:
Growth in real-world usage of ChainLink.
Partnerships with new allies.
Launching new products and services.
Risks against the upward trend for ChainLink include:
Global economic recession.
Volatility in cryptocurrency markets.
Competition from emerging technologies.
Conclusion
In summary, the long-term (1-week) ChainLink price chart indicates a robust upward trend, with expectations of breaking through key resistance levels, specifically at $53. Currently, the price is in an accumulation phase, poised for a soon-to-come upward adjustment. Additionally, it is noteworthy that the price has been consistently adjusting upward on a weekly basis.

Bullish Flag pattern breakout in INFYINFOSYS LTD
Key highlights: 💡⚡
✅On 1 Hour Time Frame Stock Showing Breakout of Bullish Flag Pattern.
✅Strong Bullish Candlestick Form on this timeframe.
✅It can give movement up to the Breakout target of 1715+.
✅Can Go Long in this stock by placing a stop loss below 1510-.

#NIFTY Intraday Support and Resistance Levels -27/12/2023Nifty will be gap up opening in today's session. After opening nifty sustain above 21460 level and then possible upside rally up to 21580 level in today's session. in case nifty trades below 21430 level then the downside target can go up to the 21310 level.

[INTRADAY] #BANKNIFTY PE & CE Levels(27/12/2023) Today will be gap up opening in BANKNIFTY . After opening if banknifty sustain above 48050 level then possible upside rally of 400-500 points upto 48450 Level. Any Major downside only expected in case banknifty starts trading below 47950 level.

WAVES/USDT An Excellent Chance for a LONG Trading Opportunity!BINANCE:WAVESUSDT.P Recently, the weekly chart is trying to break a long-term resistance level. The price faced rejection at this resistance on the last three occasions, but now, we expect a breakthrough. After this breakout, a unique opportunity arises for a long trade with a potential target price in the range of 5 to 6 USD.
#WAVES/USDT LONG 🍀
Leverage: 3x
Entries: $2.5249
Take profit 1: $2.8586
Take profit 2: $3.8717
Take profit 3: $5.9554
Stop Loss: $1.1164
Stay tuned for trade confirmation and additional updates. Feel free to express your thoughts by liking and sharing in the comments section:)
Thanks
The sroced.

Falling Wedge pattern breakout in BHARATIARTLBHARATI AIRTEL LTD
Key highlights: 💡⚡
✅On 1 Hour Time Frame Stock Showing Breakout of Falling Wedge Pattern.
✅Strong Bullish Candlestick Form on this timeframe.
✅It can give movement up to the Breakout target of 1021+.
✅Can Go Long in this stock by placing a stop loss below 970-.

Rising Wedge pattern breakout in NIFTY 50NIFTY 50 INDEX
Key highlights: 💡⚡
✅On 15 MIN Time Frame Stock Showing Breakout of Rising Wedge Pattern.
✅Strong Bullish Candlestick Form on this timeframe.
✅It can give movement up to the Breakout target of 21510+.
✅Can Go Long in this stock by placing a stop loss below 21250-.

EURGBP) analysis) 4H) 💥💥Hello trader’s what do you think about Eurgbp) ?
Eurgbp if breakout trend lines bake a double top retest support levels Same ifberakdown support levels
go bake resistance levels so waiting a breakout)
key levels .086233)
key levels .086615)
key levels .086932)

GBPJPY) 4H) tame frame ) analysis)Speculation about when the Bank of Japan will end its negative interest rate policy (NIRP) has been rife, but seen as more likely to come in January than December.
Price action in JPY-related FX option markets isn't offering many clues, with increased demand and high volatility risk premiums for both meetings, and also for a speech by BoJ Governor Kazuo Ueda on Dec. 25.
Deutsche shares sentiment with other banks who expect the Bank of Japan to maintain its current monetary policy framework in December, while hinting at an end to the NIRP at its Jan. 23 meeting. Deutsche attribute a 60% probability to hints being made.
In terms of fundamentals, Deutsche believe that ending NIRP in January is appropriate because the forecast in the outlook report will change since the data already imply a virtuous circle in wages and prices. In terms of practicalities, it is because financial institutions would have sufficient time to prepare for it.
Deutsche suspect that the BoJ will hint at the upcoming policy revision by including some key points in its statement; that it will assess and confirm the virtual circle between wages and prices by the January meeting, with the results to be published at the same time as the outlook report; and that, as a result of this assessment, the policy revision will be judged appropriate and it will continue to emphasize an accommodative policy stance and stable JGB markets even after the revision.
Overnight expiry FXO implied volatility

gold intraday inverted head and shoulder pattern there big confusion between fed and market
because of that gold is not breaking above 2050 nor it is going below $2000
neckline is big horizontal resistance
breakout of neckline is necessary for new bullish trend on h1 time frame from 1973

ULTRACEMCO - Has a Very tight Squeeze ULTRACEMCO - Has a Very tight Squeeze and if there is any BO to the upside we could expect for an Continuation of the rally. This can give a move of 4-6% in a couple of week - IF THERE IS A CLEAR BO WITH HIGH VOLUME'S

#NIFTY Intraday Support and Resistance Levels -19/12/2023Nifty will be FLAT opening in today's session. After opening nifty start trading Below 21400 level and then possible downside rally up to 21280 in today's session. in case nifty trades Above 21430 level then the upside target can go up to the 21550 level.

#NIFTY Intraday Support and Resistance Levels -18/12/2023Nifty will be gap up opening in today's session. After opening nifty sustain above 21450 level and then possible upside rally up to 21570 level in today's session. in case nifty trades below 21400 level then the downside target can go up to the 21280 level.

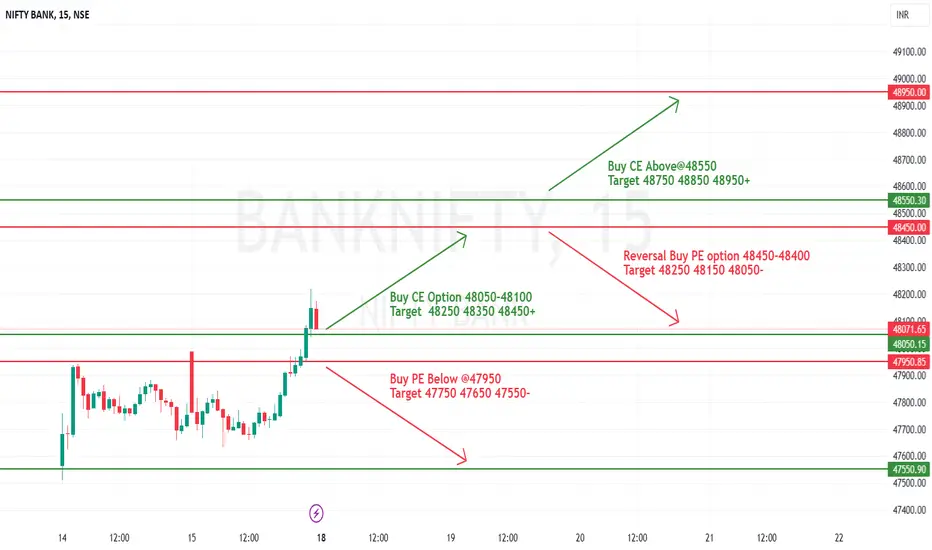
[INTRADAY] #BANKNIFTY PE & CE Levels(18/12/2023) Today will be gap up opening in BANKNIFTY . After opening if banknifty sustain above 48050 level then possible upside rally of 400-500 points upto 48450 Level & this rally can extend another 400 point if market gives breakout 48550 level. Any Major downside only expected in case banknifty starts trading below 47950 level. also possible Reversal Downside 48450 level.
Uptrend Channel pattern breakout in TATACOMMTATA COMMUNICATION LTD
Key highlights: 💡⚡
✅On 1Hour Time Frame Stock Showing Breakout of Uptrend Channel Pattern.
✅Strong Bullish Candlestick Form on this timeframe.
✅It can give movement up to the Breakout target of 1810+.
✅Can Go Long in this stock by placing a stop loss below 1754-.

Double Top (Bearish) analysis)🗺️🗺️Hello traders what do you think about gbpusd
traders gbpusd now see a double
Top (Bearish pattern channels
In trading.a double top pattern is
a bearish chart pattern that indicates a potential trend 📉 reversel from an uptrend to a downtrend lt is characterized by Three conservative peaks (or highs) that are approximately equal; following by a price breakdown below a support levels.
key levels 1.24922
key levels 1.242111
key levels 1.23599
First Top:
The first top is firmed as the price rallies to a certain level and then retraces.lt represents a
resistance levels where selling pressure begins to outweigh buying pressure.
Decline and pullback:
After the first top.the price decline but subsequently rallies back up. the pullback creates the formation of the second top. which is also approximately equal to the first top.🧠
Breakdown:
The breakdown occurs when the price break's below the neckline indicating a potential trend reveal and the Start of a downtrend. traders often look for increased trading volume accompanying the the breakdown as confirmed signal.
The double ⏫ too pattern suggests that the buying pressure has exhaust and sellers are stepping in leading to a potential reversal of the previous uptrend the pattern is considered complete and confirmed when the price break's below the neckline.
triggered a bearish signal.
Trader's often use the height of pattern (measured from the neckline to the Tops)
to estimate a potential price target for the downward move after the breakdown.
Additionally. some trader's may apply other analysis tools as Fibonacci retracement levels or moving averages to further validate the pattern and identify potential entry or exit point's.
As with any chart pattern it's important to use the double top pattern in conjunction with other technical indicators and analysis mathods to increase the probability of successful trader's and to account for any potential false single 🙏

Reversal Double Bottom pattern in PELPIRAMAL ENTERPRISES LTD
Key highlights: 💡⚡
📈 On 1 Hour Time Frame Stock Showing Reversal of Double Bottom Pattern.
📈 It can give movement upto the Reversal Final target of Above 953+.
📈 There have chances of breakout of Resistance level too.
📈 After breakout of Resistance level this stock can gives strong upside rally upto Above 1022+.
📈 Can Go Long in this stock by placing a stop loss Below 850-.

#NIFTY Intraday Support and Resistance Levels -13/12/2023Nifty will be gap up opening in today's session. After opening nifty sustain above 20920 level and then possible upside rally up to 21040 in today's session. in case nifty trades below 20870 level then the downside target can go up to the 20750 level.

"RNDR is heading towards $7?"🚀🎗️
🔴Render has reached the mid-point of its trading channel and is poised to break through the $4.045 resistance level. If it does, it could reach the channel's upper limit of $6.866.‼️
⚠️If buying pressure fails to break through the mid-point of the channel, a short trade could be a good entry point at the first trigger of 3.554.📉
🔆What do you think about this triangle? Does it exist‼️

Bullish Wedge Pattern breakout in CHOLAFINCHOLAMANDALAM INVESTMENT & FINANCE LTD
Key highlights: 💡⚡
✅On 1Day Time Frame Stock Showing Breakout of Bullish Wedge Pattern.
✅ Strong Bullish Candlestick Form on this timeframe.
✅It can give movement up to the Breakout target of 1260+.
✅Can Go Long in this stock by placing a stop loss below 1080-.

Gold retest 2051) down 👇)2000) confirm zooon)💥💥Hello traders what do you think about gold ?
Gold break support levels)
now gold retest same time rsl)
2051) same) back down 👇)
Support levels 2000) I know)
Dxy index ☝️ back up rsl 104.
Gold ticks up on weaker US dollar, bond yields
Dec 5, 202311:36 GMT+5
KEY POINTS:
DollarDXYindex down 0.1%
Gold may test support of $2,009 per ounce - technicals
Investor focus shifts to US non-farm payroll on Friday
Gold prices rose on Tuesday as the U.S. dollar and Treasury yields fell after traders slightly pared bets for an interest rate cut by the Federal Reserve in the first quarter of 2024.
Spot gold
GOLD
gained 0.2% to $2,032.70 per ounce by 0750 GMT. Bullion had surged to an all-time high of $2,135.40 on Monday, before dropping more than $100 in a single day to close 2% lower.
U.S. gold futures
GOLD
for February delivery rose 0.5% to $2,051.70.
Making gold less expensive for other currency holders, the dollar index
DXY
fell 0.1%, while yields on 10-year Treasury notes
US10Y
slipped to 4.2375%.
Investors are awaiting the closely watched U.S. non-farm payrolls data on Friday, which could help further gauge the interest rate outlook.
Lower interest rates reduce the opportunity cost of holding non-interest-bearing bullion.
Gold ticks up on weaker US dollar, bond yields
Dec 5, 202311:36 GMT+5
KEY POINTS:
DollarDXYindex down 0.1%
Gold may test support of $2,009 per ounce - technicals
Investor focus shifts to US non-farm payroll on Friday
Gold prices rose on Tuesday as the U.S. dollar and Treasury yields fell after traders slightly pared bets for an interest rate cut by the Federal Reserve in the first quarter of 2024.
Spot gold
GOLD
gained 0.2% to $2,032.70 per ounce by 0750 GMT. Bullion had surged to an all-time high of $2,135.40 on Monday, before dropping more than $100 in a single day to close 2% lower.
U.S. gold futures
GOLD
for February delivery rose 0.5% to $2,051.70.
Reuters Graphics
Thomson Reuters
Spot gold price in USD per oz
Making gold less expensive for other currency holders, the dollar index
DXY
fell 0.1%, while yields on 10-year Treasury notes
US10Y
slipped to 4.2375%.
Even after the dramatic moves in gold prices over the past 24 hours, "for now, the overall trend for gold still looks bullish," said Ilya Spivak, head of global macro at Tastylive.
A wave of profit-taking seems to have been triggered after gold rallied at the weekly open, to catch up to Fed Chair Jerome Powell's dovish comments from Friday, along with "pre-positioning ahead of this week's event risk," added Spivak.
However, traders have lowered their Fed rate cut bets by March next year to about 60%, from 70% on early Monday, CME's FedWatch Tool shows.
Investors are awaiting the closely watched U.S. non-farm payrolls data on Friday, which could help further gauge the interest rate outlook.
Lower interest rates reduce the opportunity cost of holding non-interest-bearing bullion.
The Middle East conflict and the fear of it spreading has driven money into the yellow metal, said FXCM market specialist Russell Shor.
Spot gold may test support of $2,009 per ounce, a break below which could open the way towards $1,980, according to Reuters technical analyst Wang Tao.
❤️ Plaes like and comments My trading ideas 💡 thanks 🙏 for your support)
