USD/JPY) LOGN TIME Analysis Read The captionSMC trading point update
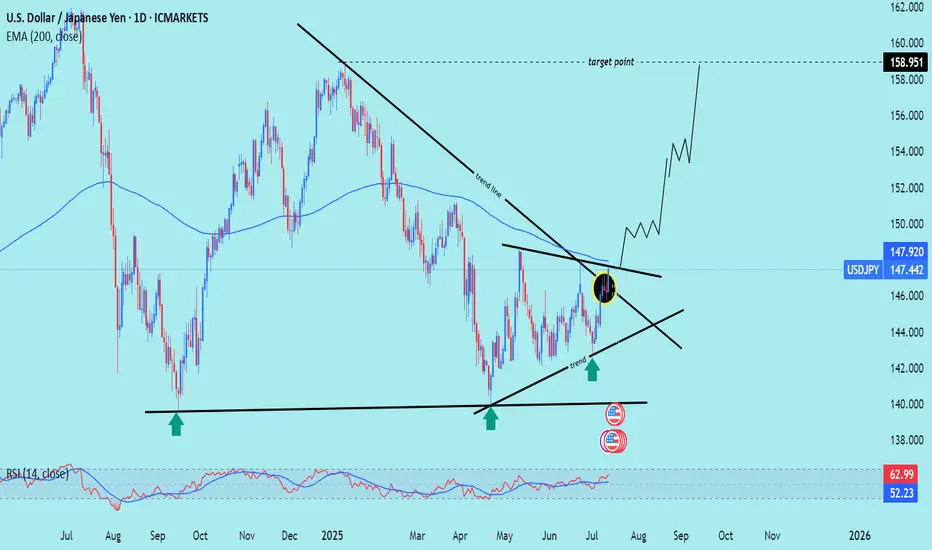
Technical analysis of USD/JPY on the daily timeframe, highlighting a long-term downtrend reversal with potential for significant upside.
---
Analysis Summary
Pair: USD/JPY
Timeframe: Daily
Current Price: 147.442
Bias: Bullish breakout from a descending wedge structure.
---
Key Technical Insights
1. Descending Trendline Break:
Price has broken above the long-term downtrend line, signaling a reversal.
Breakout area is circled in yellow, confirming bullish intent.
2. Trendline & Structure Support:
Multiple rejections from the ascending support trendline (marked by green arrows) confirm accumulation and higher lows.
3. 200 EMA as Dynamic Resistance/Support:
Price is now above the 200 EMA (147.920) — a bullish signal, turning resistance into support.
4. RSI (14):
RSI at 62.99, approaching overbought territory, but still has room to push further.
---
Target Point
Target: 158.951
Based on measured move from wedge breakout and historical resistance level.
---
Trade Setup Idea
Direction Entry Stop-Loss Target
Buy 147.40–147.60 Below 145.80 158.95
Mr SMC Trading point
---
Summary
This chart signals a major bullish breakout on USD/JPY, with the break of a year-long downtrend structure, reclaiming the 200 EMA. If this breakout sustains, price could aim for 158.95 in the coming weeks.
Please support boost 🚀 this analysis)
Chartpattren
XAUUSD- Bearish AB=CD pattern at resistance zone!Timeframe:2H|Pattern: AB=CD| Bias: Bearish Reversal!
Gold (XAUUSD) has completed a precise AB=CD pattern aligning perfectly with a strong resistance zone near 3340-3350 the symmetry of the harmonic pattern combined with historical rejection levels gives a strong signal for a potential downside move
Trade setup idea:
Sell entry: 3340-3350
target:1: 3300
target:2: 3260
risk reward: Favorable setup with harmonic confirmation.

XAU/USD) bearish Trand analysis Read The captionSMC trading point update
Technical analysis of (XAU/USD) on the 3-hour timeframe, projecting further downside after rejection from a resistance zone aligned with a descending trendline.
---
Analysis Summary
Trend Bias: Bearish
Current Price: ~$3,301.96
Structure: Price is respecting a descending channel, with multiple rejections from the upper boundary and key resistance zone.
---
Key Technical Insights
1. Resistance Zone & Downtrend Line:
Price was rejected from a resistance block near the EMA 200 (~$3,331) and descending trendline.
This level has repeatedly triggered strong downside moves (highlighted with red arrows).
2. EMA 200 Reaction:
The EMA 200 at $3,331.10 is acting as dynamic resistance.
Each time price reaches or crosses above this line, selling pressure increases.
3. Bearish Price Projection:
After recent rejection, the chart anticipates a pullback to the support zone between $3,248.26 and $3,245.71.
A deeper drop toward $3,159.13 is projected as a next major target, consistent with previous price moves.
4. RSI Indicator:
RSI at 40.24 suggests bearish momentum is still in play but not yet oversold—indicating room for more downside.
---
Bearish Trade Idea
Element Level / Description
Entry Zone Below resistance: $3,310–$3,320
Target 1 $3,248.26–$3,245.71 (support zone)
Target 2 $3,159.13 (channel base / next support)
Stop-Loss Above $3,335 (above resistance zone)
---
Risk Considerations
Fundamental catalysts: Gold is sensitive to USD strength, interest rate decisions, and macroeconomic data.
Invalidation: A strong breakout and close above the descending trendline and EMA 200 would negate the bearish outlook.
---
Summary
This analysis outlines a bearish setup for XAU/USD, supported by trendline resistance, EMA rejection, and RSI momentum. If current structure holds, a move toward the $3,245 and $3,159 levels is likely.
Please support boost 🚀 this analysis)

USD/JPY) back down Trend Read The captionSMC trading point update
Technical analysis of USD/JPY (U.S. Dollar / Japanese Yen) on the 3-hour timeframe, anticipating a rejection from a descending trendline resistance and a move down toward key support levels.
---
Analysis Overview:
Trend Bias: Bearish correction expected
Structure: Price is reacting at a descending trendline, which has held as resistance on multiple occasions.
Indicators:
EMA 200 (144.756): Price is currently above, but projected to break below it.
RSI (14): Overbought at ~74, signaling potential for a reversal.
---
Key Technical Components:
1. Descending Trendline Resistance:
Price is approaching/has touched a well-respected downtrend line, marked by three strong rejections (red arrows).
This trendline has consistently capped bullish moves, indicating strong seller interest.
2. Bearish Reversal Expectation:
The projected path suggests a potential fake breakout or double-top, followed by a steep decline.
A two-stage drop is anticipated, with price first targeting the EMA 200 zone, then extending lower.
3. Target Points:
First target: Around 145.244, near EMA 200.
Final target: 143.048, aligning with the key support zone (highlighted in yellow), where price previously bounced.
4. RSI (14):
Currently overbought (73.29), signaling a likely retracement.
Prior peaks at this level led to notable corrections.
---
Trade Setup Idea:
Parameter Level
Entry Near current price (~146.85) if bearish pattern confirms
Stop-Loss Above trendline (~147.30–147.50)
Target 1 145.24 (EMA 200 zone)
Target 2 143.05 (Support zone)
This setup offers a high-probability short opportunity if resistance holds.
---
Risk Factors:
Upcoming economic events could trigger volatility (news icon marked).
A clean breakout and close above the trendline (~147.50+) would invalidate this bearish thesis.
Mr SMC Trading point
---
Summary:
The analysis suggests a potential USD/JPY reversal from a descending trendline, supported by overbought RSI and prior rejections. The bearish projection targets a move toward 143.048, following a dip below the EMA 200 level at 145.244.
Please support boost 🚀 this analysis)

USD/CAD) Down Trand Read The captionSMC trading point update
Technical analysis of USD/CAD (U.S. Dollar / Canadian Dollar) on the 1-hour timeframe, with a focus on a potential double-top formation at strong resistance, followed by a drop toward support:
---
Analysis Overview
Trend Structure: Downward-sloping channel with lower highs and lower lows.
Confluence Area: The current rally is approaching both the upper channel boundary and a significant horizontal resistance zone (~1.3660–1.3700).
---
Key Technical Elements
1. Resistance & Double-Top Setup
The price nears the resistance zone (yellow) where it previously reversed (noted by red arrows).
A cap-and-float pattern (double/top-like structure) is projected: price pushes higher, hesitates, tests resistance again, then fails—a sign of weakening bullish momentum.
2. EMA 200 Interaction
The 1-hour EMA 200 (blue line at ~1.3635) sits just below current price.
A failure to sustain above this level reinforces the bearish case.
3. RSI Overextension
RSI (14) is around 64–69, indicating near-overbought conditions on this timeframe, suggesting a potential pullback.
4. Price Targets
Initial target: Lower channel boundary near 1.3556 (highlighted support).
Extended target: Beneath to 1.3540, aligning with the broader Demand zone.
---
Proposed Trade Setup
Step Action Level
Entry Short near top of resistance/channel (after double-top confirmation) 1.3680–1.3700
Stop-Loss Above recent high and channel resistance ~1.3720
Take Profit 1 Near EMA 200/lower channel bounce ~1.3556
Take Profit 2 Extended move to demand zone ~1.3540
Estimated Move ~1.15% drop from midday highs –
---
Risk & Event Factors
Scheduled Canadian or U.S. data releases (icons shown) could introduce volatility and disrupt technical patterns.
A breakout above ~1.3720 would invalidate this bearish thesis and shift bias bullish.
Mr SMC Trading point
---
Summary
Expecting a cap-and-float double-top formation at key resistance near 1.3660–1.3700, followed by a trend continuation drop toward 1.3556–1.3540. The bearish setup is supported by a down-channel structure, EMA 200 failure, and overbought RSI conditions.
Please support boost 🚀 this analysis)

XAU/USD) order block back up trand Read The captionSMC trading point update
Technical analysis of Gold (XAU/USD) on the 1-hour timeframe, focusing on a potential reversal from a key support/order block zone. Here's a full breakdown
---
Chart Analysis – XAU/USD (1H)
1. Key Zone: Support Level / Order Block (Yellow Box)
The price is currently testing a strong support zone that previously acted as a bullish order block (demand area).
This zone is also near a diagonal trendline and a prior breakout level, adding confluence to the setup.
2. Reversal Anticipation (Black Zigzag Path)
The chart suggests two possible scenarios from the support area:
A bullish bounce leading price up toward:
Target 1: 3,343.05 (near 200 EMA)
Target 2: 3,364.62 (upper resistance)
A break below the yellow support zone, triggering a deeper move toward:
Key support: 3,247.55
3. RSI Oversold Signal
RSI (14) is at 32.66, which is near oversold territory, signaling potential for a bullish reversal if buying pressure steps in.
4. EMA (200 - Blue Line)
EMA at 3,330.95 currently acts as dynamic resistance.
If price bounces from the order block, this EMA may serve as the first reaction level before further upside.
Mr SMC Trading point
---
Summary
Bias: Bullish bounce if price holds above 3,296.04 (order block support).
Entry Zone: Current price near 3,301 or confirmation bounce candle.
Targets:
TP1: 3,343.05
TP2: 3,364.62
Invalidation: Strong break and close below 3,296.04 may open the path to 3,247.55.
RSI: Favoring reversal conditions (near oversold).
---
Please support boost 🚀 this analysis)

XAU/USD) support level back bullish trend Read The captionSMC trading point update
Technical analysis of Gold (XAU/USD) on the 3-hour timeframe, suggesting a long trade idea with a clearly defined support zone and target projection. Here's the detailed breakdown:
---
Chart Breakdown (3H - XAU/USD)
1. Support Zone (Yellow Box):
Price reacted strongly to the 3,244–3,300 area, which is identified as a key support level.
This area has historically seen demand and is now acting as a base for potential bullish continuation.
2. Falling Wedge Breakout:
A falling wedge pattern has been broken to the upside, which is typically a bullish reversal signal.
The breakout indicates a shift from the previous bearish momentum into bullish strength.
3. EMA 200 Confirmation:
Price is now above the 200 EMA (3,333.347), supporting a bullish bias.
This can act as dynamic support going forward.
4. RSI Momentum:
RSI at 62.00, indicating growing bullish momentum without being overbought.
The RSI has also broken above a previous local high, confirming strength.
5. Target Projection:
The projected move (blue arrowed box) suggests a potential rally of +105.305 points (3.20%), targeting the 3,394.503 level.
This level aligns with previous price structure and acts as the next major resistance.
6. Anticipated Price Path (Black Zigzag Line):
Price is expected to pull back slightly, retesting the wedge breakout or support zone.
After this retest, a bullish continuation toward the target point is projected.
Mr SMC Trading point
---
Summary:
Bias: Bullish
Pattern: Falling wedge breakout + support retest
Entry Zone: Around 3,300–3,320 on a retest
Target: 3,394.503
Invalidation: Strong break and close below 3,244.166
Confirmation: Bullish price action near support + sustained RSI strength
Please support boost 🚀 this analysis)

USD /CAD) bearish reversal analysis Read The captionSMC trading point update
Technical analysis of USD/CAD pair on the 2-hour timeframe, suggesting that the price is likely to drop toward the support zone. Here's the detailed idea behind the analysis:
---
Chart Breakdown (2H – USD/CAD)
1. Resistance Zone (Yellow Box - Top):
Marked as a strong supply area where price has repeatedly been rejected (highlighted by red arrows).
Acts as a key zone where sellers are in control.
Also aligns with a descending trendline, reinforcing bearish pressure.
2. Support Zone (Yellow Box - Bottom):
This is the target point marked at 1.35387, which previously served as a demand zone.
The chart suggests this level as the next significant area where price might find buyers.
3. Trend Context:
Price is moving within a descending channel (black trendlines), confirming the overall downtrend.
The 200 EMA (1.36834) is acting as dynamic resistance, keeping price under pressure.
4. Projected Move (Blue Box):
Shows a potential drop of ~91 pips toward the support level.
A bearish wave is anticipated as per the black zigzag line on the chart.
5. RSI Indicator:
RSI is near neutral (49.02 and 49.70) — suggesting no overbought/oversold conditions, but confirming lack of bullish momentum.
RSI is aligned with price trending down.
Mr SMC Trading point
---
Summary:
Bias: Bearish
Entry Zone: Near current price or minor pullback (1.364–1.365)
Target: 1.35387 (support zone)
Invalidation: Break and close above resistance level / 200 EMA (~1.3685)
Trend: Downtrend within channel
---
Please support boost 🚀 analysis)

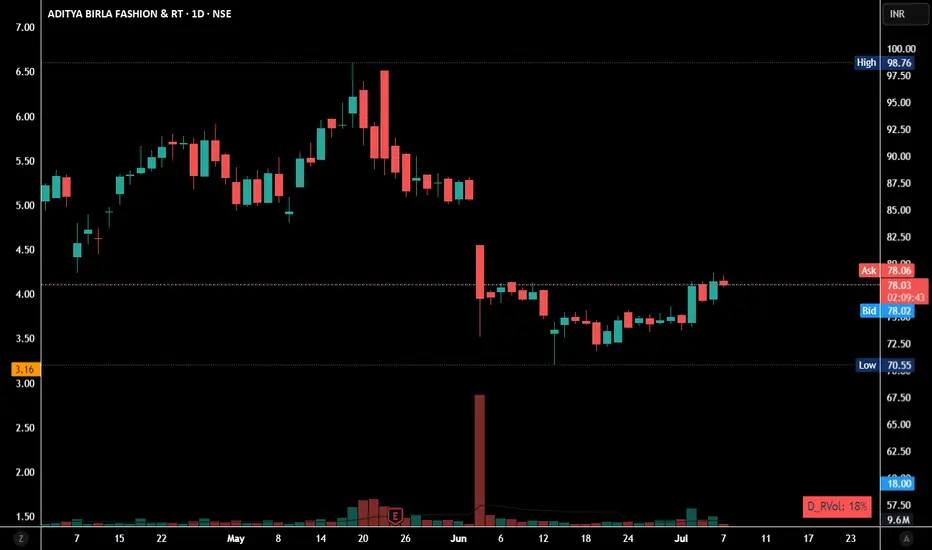
Rising Institutional Buying
Rising Institutional buying has been seen in this stock. This quarter is full of their accumulation it seems. It'll be interesting to see whether it holds 80-90 level.
Chart is for educational purpose, not a Buy/Sell Reco.
BTC monthly yelling at us for something interesting ?We read daily news about ETF, accumulation by institutes and scarcity in the exchanges, but I recognize something different in the chart based on multiple indicators. Historically, BTC boomed after touching 50 EMA and whenever it is extended it traces back to 50 EMA on monthly chart. As per current data, BTC is extended far from it. Also RSI and MACD indicating that it is losing momentum with -ve divergence. Volume as well descreasing since last leg, though price moved up. So, I expect price to retrace to 50 EMA which coincides with previous high at 60K. Let us see how it unfolds.

MACRO 3-Drive Pattern on Bitcoin | Major Reversal Ahead?Is Bitcoin completing a massive 3-drive structure on the macro chart?
Three clear pushes higher, each with fading momentum, are flashing a major reversal signal.
This could be the final phase before a long-term shift — are you ready for what’s next?
📚 3-Drive Structure Trading Strategy — Full Breakdown
The 3-Drive Pattern is a powerful reversal-based price structure used to spot major turning points in trending markets. It works by identifying three consecutive drives (or pushes) in one direction, typically ending with exhaustion and a high-probability reversal.
Each drive forms a new high or low, but with weakening momentum — especially visible using RSI, MACD, or volume divergence.
🔍 What is the 3-Drive Pattern?
3 consecutive higher highs (or lower lows)
Each drive followed by a shallow pullback
Momentum weakens on each push (divergence forms)
Fibonacci symmetry often present:
- Drive extensions: 127.2%–161.8%
- Pullbacks: usually 61.8%
📉 Bearish 3-Drive (Reversal from Uptrend):
Drive 1: Price makes a higher high with strong momentum
Drive 2: Another higher high, weaker strength
Drive 3: Final high with clear divergence
Reversal: Entry when price breaks below structure
🎯Entry Criteria:
Wait for all 3 drives to form
Confirm with divergence on Drive 3
Use a confirmation candle or structure break
Stop-loss: just beyond the 3rd drive’s high
🎯 Targets:
Conservative: Return to Drive 2 base
Aggressive: Full trend reversal (50%–100% Fib retracement)
🧠 Pro Tips:
Best on 4H, 1D, 3D or 1w timeframes
Confirm with RSI, MACD, or volume divergence
Combine with key S/R or supply-demand zones
💡 Summary:
The 3-Drive pattern is one of the most reliable reversal structures when combined with divergence and Fibonacci symmetry. It's especially powerful at market exhaustion zones and works best with confirmation-based entries.

XAU/USD 4H – Retracement or Rejection? Key Levels to WatchGold bulls made a strong push out of the descending channel, but now the real test begins. The market is currently in retracement mode after a sharp impulse, and the next move will be decisive.
🔹 Channel Breakout & Retest in Play:
Price broke out of the descending channel with momentum and hit the $3,357 region before pulling back. We're now hovering around the 0.236 Fib at $3,331 — with the 0.382 and 0.618 Fib zones below offering potential long entry confluence.
🔹 Fibonacci Cluster Support Zone:
Between $3,314 – $3,287 lies a high-probability demand zone, where multiple Fibonacci levels converge with the broken channel top. This area also aligns with the 50 EMA, creating a pocket for bullish continuation — if held.
🔹 RSI Divergence to Watch:
RSI shows signs of slowing bullish momentum after peaking, which suggests this retracement could deepen toward the 0.5–0.618 levels before any meaningful bounce. A bullish RSI reversal in this zone would confirm re-entry.
📌 Scenario 1 – Bullish Continuation:
Price finds support between $3,314–$3,287
Momentum kicks in for a leg up toward $3,388
Final TP at $3,427 (Fib -0.618 extension)
📌 Scenario 2 – Rejection and Deeper Drop:
Failure to hold the 0.5 zone flips the bias bearish
Watch for re-entry back into the previous channel
Next downside target: $3,251 and potentially $3,233–$3,221 (Fib + extension)
💡 Elite Insight:
The pullback is not the risk — entering without a plan is. This is the zone where patience meets precision. Let the levels do the work.

USD/JPY) Back support level Read The captionSMC trading point update
Technical analysis of USD/JPY pair using a combination of price action, resistance/support levels, and indicators. Here's a breakdown of the idea behind the analysis:
---
Chart Breakdown (2H - USD/JPY)
1. Key Zones:
Resistance Level (Yellow Box at Top):
Price has previously been rejected from this zone multiple times.
Recent bearish wicks and aggressive sell-offs are marked by red arrows—showing strong seller interest.
Support Level / Target Point (Bottom Yellow Box):
Price has found strong buying interest around 142.142.
This zone is the anticipated downside target if the bearish scenario plays out.
2. Bearish Bias Justification:
Liquidity Grab / Fakeout (labeled “fug”):
The price briefly broke above the smaller resistance block but quickly reversed.
This "fake breakout" often traps buyers, strengthening the bearish case.
EMA 200 (Blue Line):
Price is currently near or slightly under the 200 EMA (144.553), suggesting a potential rejection area aligning with resistance.
RSI Indicator:
RSI shows divergence and has not confirmed a bullish breakout.
The values (56.77 and 42.82) indicate loss of bullish momentum.
3. Projection (Black Lines):
The black zig-zag lines represent a forecasted drop to the support level.
Suggests a short setup near 144.50–145.00 with targets near 142.14.
Mr SMC Trading point
---
Summary:
Bias: Bearish
Entry Zone: Near resistance area (144.50–145.00)
Target: 142.142 (support zone)
Invalidation: Strong break above 145.00 and hold
Confirmation: Rejection from resistance with bearish candle pattern
---
Please support boost 🚀 this analysis)

Bitcoin & Ethereum New Quarter | What To Look For🎯 New Quarter For COINBASE:BTCUSD & COINBASE:ETHUSD — What To Look For
As we enter a new quarter, smart money is already positioning.
Institutional investors, hedge funds, and asset managers don’t just trade price — they rotate capital based on quarterly performance, risk appetite, and macro expectations. That’s why each quarterly open is a key inflection point across all markets — including crypto.
In this video, I break down:
• 🧠 How institutional capital rotation impacts Bitcoin and Ethereum
• 📈 Key levels to watch as Q3 unfolds
• 🔁 What are the likely outcomes
• 📊 How to prepare for volatility and new trend formation
This isn’t just another candle — it’s the start of a new chapter in the cycle.
If you’re serious about understanding where the money flows next , this video is for you.
This is the likely outcome
Price not ready to moon yet
Strong candle implying new highs incoming
Watch for bearish stop hunt on new quarter
This is a bullish outside bar
MartyBoots here , I have been trading for 17 years and sharing my thoughts
👍 Enjoyed the insights?
Let me know your thoughts in the comments below — and don’t forget to like this post to support the channel!

GBP/JPY) back bullish trend analysis Read The captionSMC trading point update
Technical analysis of GBP/JPY on the 2-hour timeframe, signaling a potential rally from a key support area. Here’s a breakdown of this analysis:
---
Technical Breakdown
1. Key Support Zone (Yellow Box):
Price has pulled back to a strong support level around 196.50–197.00.
This level previously acted as resistance and now flipped to support (classic support-resistance flip), marked by the green arrow.
2. EMA 200 as Dynamic Support:
The 200 EMA (~196.567) is just below the support zone, reinforcing the likelihood of a bullish bounce from this area.
3. Bullish Price Projection:
The chart suggests a bounce off this support zone with a projected move toward the target point at 200.132, indicating a +1.71% upside.
4. RSI Indicator (14):
RSI is at 43.47, approaching the oversold region but curving upward — supporting a potential reversal to the upside.
---
Forecasted Move
Expected Move: Bullish reversal from support, targeting 200.132.
The chart outlines a potential entry at current levels, with a bounce confirmed by price respecting the yellow support zone.
Mr SMC Trading point
---
Trading Idea Summary
Bias: Bullish
Entry Zone: Around 196.50–197.00
Stop-Loss: Below support zone (~196.00 or lower)
Take-Profit: 200.132
Confirmation: Bullish candlestick pattern or RSI crossover
plesse support boost 🚀 this analysis

silver head and shoulder pattern price breakout in first week of june then sideways entire month
during same time gold was selling off below $3430 resistance and fed was very hawkish on stagflation
if buyers stopped buying and seller come in then price can breakdown then neckline of pattern

XAU/USD) bearish Trand analysis Read The captionSMC trading point update
Technical analysis of (XAU/USD) on a short-term timeframe, incorporating several key tools and concepts:
---
Overview of the Analysis
Price Level (Current): Around $3,273.40
EMA 200 (Blue Line): Around $3,337.95 (signaling broader trend)
Resistance Zone (Yellow Box): Between approximately $3,300–$3,320
Support/Target Zone: Around $3,231.11
RSI (Relative Strength Index): At 32.88, which is near oversold territory (below 30)
---
Interpretation of Chart Structure
1. Descending Channel:
Price is moving within a downward-sloping channel.
Suggests a bearish trend is in play.
2. Resistance Level (Yellow Box):
Price is expected to retest this area and face resistance.
Confluence of a supply zone and upper trendline, reinforcing its strength.
3. Projected Price Action:
Price may climb back up into the resistance zone.
A rejection is anticipated, leading to another leg down.
The target is around $3,231.11, which matches previous measured moves.
4. Measured Moves (Blue Arrows):
Highlights historical price drops of ~79 points.
Repeating this pattern suggests symmetry and continuation.
5. RSI Indicator:
Currently at 32.88: nearing oversold, but not quite.
No clear bullish divergence, so price could drop further.
---
Trade Idea Summary
Bias: Bearish
Entry Zone: Near $3,300–$3,320 (resistance)
Target: Around $3,231.11
Invalidation: If price breaks and holds above $3,337–$3,340 (EMA 200 and channel breakout)
Mr SMC Trading point
---
Caution/Considerations
Watch for false breakouts above the resistance zone.
Monitor RSI for potential bullish divergence that could invalidate the downside.
Be cautious around the U.S. economic news event icon, which might cause volatility.
plesse support boost 🚀 this analysis)

Jio Financials Inverse Head & ShoulderThere is a developing pattern on the charts of Jio Financials.
The levels are marked clearly.
This is to spread awareness and pass my technical analysis learnings.
Conduct your own research before taking any financial decision.

XAU/USD) Bullish trand Read The captionSMC trading point update
Technical analysis of Gold (XAU/USD) on the 1-hour timeframe, highlighting a breakout from consolidation supported by key levels and trend structure. Here’s the detailed analysis:
---
Technical Breakdown
1. Key Support Zone
Price has formed a strong base around 3,315–3,325, with multiple bullish rejections (green arrows).
This zone has acted as a demand level, reinforcing bullish structure.
2. Ascending Trendline Support
An uptrend line supports higher lows, showing momentum building to the upside.
3. EMA 200
Price is now challenging the 200 EMA (3,353.41) — a key dynamic resistance.
A successful breakout and retest above this EMA will likely fuel continued bullish movement.
4. Breakout & Measured Move Projections
The chart indicates a bullish breakout from a consolidation box (yellow zone).
Measured move targets based on the previous rally:
First target: 3,368.86 (1.17%)
Second target: 3,381.55 (1.75%)
5. RSI Confirmation
RSI (14) is around 57, showing bullish momentum but still below overbought—supporting further upside potential.
Mr SMC Trading point
---
Conclusion / Idea Summary
Bias: Bullish
Entry Zone: On pullback into 3,330–3,340 range or breakout retest above EMA 200
Targets:
3,368.86
3,381.55
Invalidation: Sustained close below 3,320 and break of the uptrend line
---
Please support boost 🚀 this analysis)

USD/JPY) bearish Trand analysis Read The captionSMC trading point update
Technical analysis of USD/JPY on the 3-hour timeframe, highlighting a breakdown from trendline resistance and projecting a move toward a significant downside target.
---
Technical Breakdown
1. Trendline Rejection
Price sharply rejected from the descending resistance trendline near 148.00 (red arrow), forming a potential lower high.
This suggests continuation of the broader downtrend structure.
2. Break Below EMA 200
Price has broken below the 200 EMA (144.752), signaling a shift in momentum from bullish to bearish.
EMA is likely to act as dynamic resistance if price attempts a pullback.
3. Bearish Projection
The chart outlines a measured move downward toward the target point at 139.955, implying a drop of over 5.36% (approximately 770 pips).
The projected path shows lower highs and lower lows, confirming bearish structure.
4. RSI Confirmation
RSI (14) is currently at 29.98, indicating oversold conditions, but this often supports strong momentum in trending markets—suggesting a possible continuation lower after minor retracements.
Mr SMC Trading point
---
Conclusion / Idea Summary
Bias: Bearish
Entry: After trendline rejection and EMA 200 break (~144.75)
Target: 139.955
Invalidation: Break above 148.00 resistance trendline
---
Please support boost 🚀 this analysis)

PLTR 1D — When the tea is brewed and the handle’s in placePalantir’s daily chart is shaping up a textbook cup with handle pattern — one of the most reliable continuation setups in technical analysis. The cup base was formed over several months and transitioned into a consolidation phase, building a rectangle structure where smart money likely accumulated positions before a breakout.
Now here’s the key: price has not only broken out — it’s settled above all major moving averages, including EMA 20/50/100/200 and MA 50/200. The breakout candle was supported by surging volume, signaling strong participation from institutional buyers. When all the averages start bending upwards, it's usually not by accident.
The breakout above the $121 resistance zone unlocked a pathway toward a target at $187 , derived by projecting the height of the cup upward from the breakout level. This kind of structure, once confirmed, often fuels aggressive continuation — and this one’s got the setup locked in.
From a fundamental perspective, Palantir is holding solid ground: strong earnings reports, expanding government and commercial contracts, and aggressive development in AI services. Institutional interest is rising steadily, and that momentum is visibly reflected in price action.
To sum it up: price has launched cleanly out of the consolidation zone, pierced all critical MAs and EMAs, and continues to gain momentum. While the market sips its tea, this cup is boiling hot. Just don’t forget your stop loss — this is a trading desk, not a tea party.
If you enjoy posts like this, drop a like, share it around, and let’s hear your thoughts below. It keeps ideas moving and the content flowing — free, sharp, and relevant.

Jsw Infra , 1WExpansion Channel is looking good , it is consolidating from One Year
Now it is ready to Breakout , wait for proper breakout to Happen
wait for string close above trendline
Follow for more Swing Ideas Like This

XAU/USD) Bullish reversal analysis Read The captionSMC trading point update
Technical analysis of Gold (XAU/USD) on the 30-minute timeframe, based on technical signals and price action behavior. Here's the breakdown
---
Gold Bullish Reversal Setup – Targeting 3,384
---
Key Technical Highlights:
1. Support Zone & Price Reaction:
Price has tested a strong horizontal support level (highlighted in yellow).
Multiple bullish rejection wicks indicate buying pressure at this zone.
The green arrows show successful support bounces, hinting at bullish intent.
2. Trendline Analysis:
Price bounced near the lower boundary of the falling wedge/downtrend channel.
An uptrend line convergence supports potential reversal.
A breakout above the short-term descending trendline is indicated.
3. EMA & Target Projection:
EMA 200 at 3,364.33 may act as dynamic resistance, the next short-term hurdle.
Target zone projected at 3,384.04, offering a potential move of +65.67 pts (~1.98%).
4. RSI Indicator:
RSI(14) is oversold (~29.93), signaling a potential reversal.
A bullish crossover may be forming, supporting upward momentum.
---
Trading Plan:
Entry Zone: Near current support area around 3,325
Target: 3,384
Stop Loss (Suggested): Below 3,300, under support structure
Risk/Reward: Favorable based on support hold and breakout projection
Mr SMC Trading point
---
Conclusion:
This setup suggests a short-term bullish reversal from a key support area, with confirmation likely if price breaks above the descending trendline and clears the 200 EMA.
Please support boost 🚀 this analysis)
