USD/JPY) support level back up Read The ChaptianSMC Trading point update
Technical analysis of USD/JPY on the 4-hour timeframe suggests a bullish setup with the following key insights:
Analysis Overview:
1. Current Price: 147.492
2. Support Zone: Around 145.263 to 146.000
Marked as "Support Level / FVG" (Fair Value Gap), this is the potential demand zone where the price may retrace before bouncing.
3. Trendline: An ascending trendline is supporting the bullish structure.
4. EMA 200: Price is trading above the 200 EMA (145.263), which is generally a bullish signal.
5. RSI Indicator:
RSI is near overbought levels (currently at 63.46 and 70.56), suggesting strong bullish momentum but a potential pullback.
6. Target Zone: 151.360
Highlighted as the "Target Point" – this is the resistance area where price might face selling pressure.
Mr SMC Trading point
Trade Idea:
Entry: Buy on retracement into the support zone (around 145.5–146.0).
Stop Loss: Below the support zone or EMA (around 144.800 or as per risk tolerance).
Take Profit: Near the target zone around 151.360.
Risk-to-Reward: Favorable, approximately 1:2.5 to 1:3 depending on the entry.
Conclusion:
The idea is based on price respecting support, fair value gap (FVG), bullish structure, and a target based on recent price projections. If the price respects the support and bullish trendline, the bullish continuation towards 151.360 is a valid expectation.
Pales support boost 🚀 analysis follow)
Chartpattren

XAU/USD) back up Trand analysis Read The ChaptianSMC Trading point update
Technical analysis for XAU/USD (Gold vs. US Dollar) on the 4-hour timeframe suggests a bullish reversal setup from a key support zone. Here's a breakdown of the idea:
Key Observations:
1. Support Zone (Yellow Box at ~3,100–3,140):
The price recently touched a significant support area marked by multiple previous bounces (green arrows).
The latest green arrow shows a bullish reaction from this zone, indicating potential for an upward move.
2. Resistance Zone (~3,220–3,250):
This intermediate zone is expected to be the first area of interest for bulls.
The analysis suggests a brief pullback or consolidation before continuation.
3. Target Point (~3,375):
The chart outlines a projected move to around 3,375, aligning with a previous supply zone and the upper channel line.
This is likely the main target for a swing trade.
4. EMA 200 (Blue Line - ~3,221):
Price is hovering around the 200 EMA, acting as a dynamic resistance.
A breakout above this would add bullish confirmation.
5. RSI Indicator (~41):
RSI is recovering from an oversold region (~38), indicating potential momentum building for a reversal.
Mr SMC Trading point
---
Conclusion:
This is a bullish reversal setup with:
Entry zone: Around 3,120–3,140
Short-term resistance: ~3,220–3,250
Final target: ~3,375
Invalidation: A clear break and close below the yellow support box (~3,100)
Pales support boost 🚀 analysis follow)

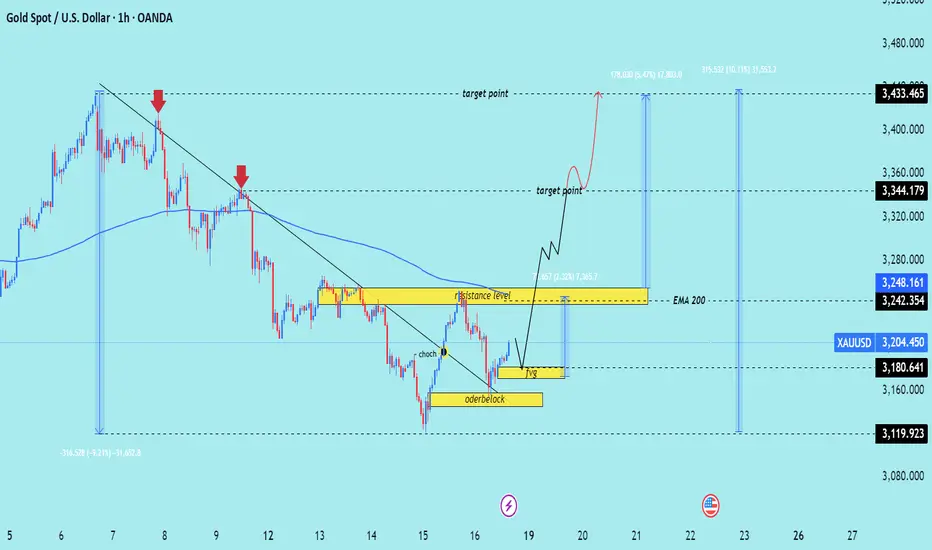
XAU/USD) bullish trend analysis Read The ChaptianSMC trading point update
Technical analysis of XAU/USD (Gold Spot price against USD) on a 1-hour timeframe, featuring a Smart Money Concept (SMC) approach. Here's a breakdown of the key ideas presented:
---
1. Downtrend & Trendline Break
The chart initially shows a downtrend with two red arrows marking lower highs.
A trendline is broken, indicating a potential shift in market structure.
CHOCH (Change of Character) is labeled — a key SMC concept signaling a reversal from bearish to bullish structure.
---
2. Orderblock & FVG (Fair Value Gap)
A bullish orderblock is highlighted, indicating an area where institutional buying may have occurred.
A Fair Value Gap (FVG) is shown, which often acts as a magnet for price to fill inefficiencies before continuing in the intended direction.
---
3. Resistance & Target Zones
A resistance level is marked near 3248–3250, which price may revisit and possibly break.
Two target points are identified:
First target: ~3344
Final target: ~3433
---
4. EMA 200
The EMA 200 is acting as dynamic resistance; a break above it adds confluence to the bullish bias.
---
5. Expected Move
The analysis anticipates:
1. A pullback into the FVG or orderblock.
2. A bullish continuation after mitigating those zones.
3. Price aiming for the resistance and eventually the upper targets.
Mr SMC Trading point
---
Conclusion
This is a bullish outlook based on a structural break (CHOCH), institutional demand (orderblock), and gap-filling logic (FVG). The price is expected to pull back slightly and then rally toward the 3344 and 3433 levels if it holds the orderblock zone.
Pales support boost 🚀 analysis follow)
BTC/USDTbtc is ready to enter acceleration phase.
expect high volatility in all coins. it's better to go for swing long or hold rather than using high leverage with tight stop losses

XAU/USD) bearish trand analysis Read The ChaptianSMC Trading point update
Technical analysis of XAU/USD (Gold vs. USD) on the 4-hour timeframe suggests a bearish outlook. Here's a breakdown of the key elements:
---
Key Levels:
1. Resistance Zone (Upper Yellow Block):
Around 3,450–3,500.
Price was previously rejected from this level, forming a double-top like structure.
2. Rejection Point (Mid-Level Zone):
Near 3,300–3,310.
Price repeatedly failed to break and hold above this zone, indicating strong selling pressure.
3. Support Zone / Demand Block (Lower Yellow Block):
Around 3,100–3,125.
This is the target area, labeled clearly as TARGET POINT: 3,116.501.
---
Indicators:
200 EMA:
Currently above the price, suggesting downward momentum.
Acting as a dynamic resistance.
RSI (14):
Around 39, slightly above oversold territory (30).
Indicates bearish pressure but not yet oversold — room for further downside.
The chart suggests that if price breaks below the mid-level support, we could expect a move towards the support block around 3,116.
The bearish wave projection drawn in the chart confirms the trader’s expectation of a drop.
The setup appears to be a break-and-retest of the mid-zone, followed by continuation downward.
Mr SMC Trading point
---
Trading Idea Summary:
Bias: Bearish
Entry Trigger: Break below ~3,225–3,230 with confirmation
Target: ~3,116
Invalidation/Stop: Close above 3,300–3,310 (rejection zone)
Pales support boost 🚀 analysis follow)

AUD)USD) resistance level back down Read The ChaptianSMC Trading point update
Technical analysis for the AUD/USD pair on the 1-hour timeframe. Here's a breakdown of the idea presented:
Key Elements:
1. Resistance Level (0.65000 - 0.65200 area):
Price is approaching this strong resistance zone.
RSI is in the overbought zone (above 70), indicating potential reversal or correction.
2. Expected Price Action:
The chart suggests that price may spike into the resistance area (possibly a liquidity grab).
After hitting resistance, a drop is expected toward the FVG (Fair Value Gap) zone.
3. FVG and Target Zone (~0.64059):
There’s a highlighted Fair Value Gap that may attract price for mitigation.
Target point is near the EMA200 level and inside a previous structure zone.
This area also aligns with the RSI cooling off.
4. Support Level (~0.63600):
Marked as a stronger support area, though the current trade setup doesn't expect price to reach there soon.
5. EMA200 (blue line around 0.64202):
Acts as dynamic support.
Target is slightly below this EMA, potentially a liquidity sweep before a bounce.
Mr SMC Trading point
---
Summary of the Idea:
Bearish bias after a resistance rejection.
Look for short opportunities around the resistance zone (0.6500 area).
Target near 0.6405–0.6420 (FVG + EMA200).
Overbought RSI supports this pullback expectation.
Pelas support boost 🚀 analysis follow)

GOLD XAU-USD CORRECTION COMPLETE REALLY TOWARD UP $3400 0PEN XAUUSD continues to trade within a clearly defined bullish channel, showing strong adherence to upward trendlines and key support levels. Recent price action confirms the ongoing strength of bullish momentum, with higher highs and higher lows reinforcing the prevailing trend. Technical indicators, including moving averages and RSI, remain aligned with buyers, while macroeconomic factors such as inflation concerns and global risk sentiment further support the upside narrative. As the precious metal steadily advances, the $3400 level emerges as a key psychological and technical target, suggesting that, barring significant shifts in market dynamics, gold may continue its trajectory towards new highs in the medium term."

XAU/USD) Bullish trand line analysis Read The ChaptianSMC Trading point update
Technical analysis of Gold Spot (XAUUSD) on the 4-hour timeframe, featuring key support and resistance levels, price action projections, and RSI for momentum evaluation. Here's a breakdown of the idea:
Key Points in the Analysis:
1. Support & Resistance Zones:
Big Support / Buying Zone: Around 3,222 – 3,240. This zone has seen previous bullish reversals and is supported by the 200 EMA.
Intermediate Support Level: Around 3,270–3,290, where price might bounce before attempting a breakout.
Key Resistance Level: Around 3,350–3,365. Price must break this area to move toward higher targets.
2. Price Action Projections:
The analysis shows two bullish potential scenarios:
Scenario 1: Price breaks above the resistance level directly and moves toward the target point at 3,535.83.
Scenario 2: A retracement to the lower support or even the big buying zone before a bullish rally to the same target.
3. RSI (Relative Strength Index):
Currently near the neutral zone (around 49), suggesting there's room for movement in either direction.
No extreme overbought/oversold signals right now.
4. EMA (200):
The price is currently hovering above the 200 EMA (3,222.01), which acts as a long-term support and trend indicator.
Mr SMC Trading point
Summary of the Trading Idea:
Bias: Bullish
Entry Zones: Look for long entries at either the support level (3,270–3,290) or lower buying zone (around 3,222).
Target: 3,435.05 initially, then 3,535.83.
Invalidation: A clear breakdown below the 3,222 support level could invalidate the bullish bias.
Pelas support boost 🚀 analysis follow)

USD/JPY) Bullish reversal analysis Read The ChaptianSMC Trading point update
Technical Analysis USD/JPY suggests a bullish outlook based on the following key technical components:
1. Buying Zone: The chart identifies a green rectangular area labeled "BUYING ZONE" just above the 200 EMA (blue line at 144.079). This implies that price retracement into this zone could be an opportunity to go long (buy).
2. Support & Resistance:
Support Level: Clearly marked around 143.00, showing a previous demand area.
Resistance Level: Around the 145.800–146.000 region, price previously rejected here.
3. Bullish Pattern: The curved arrow suggests the formation of a bullish continuation pattern (possibly a cup & handle or flag), with the expectation of a breakout toward the upside.
4. Target Point: The target is projected at 148.153, implying a potential move of approximately 291.7 pips from the buying zone—suggesting a favorable risk-reward ratio.
5. RSI Indicator: The RSI (Relative Strength Index) is currently around 55, not in the overbought zone, indicating more room for upside movement.
Mr SMC Trading point
Summary of Idea:
Strategy: Buy near 145.00–145.20 (Buying Zone).
Stop Loss: Just below the 200 EMA or the lower bound of the green zone.
Take Profit: Near the 148.153 target.
Confirmation: Wait for bullish confirmation/candlestick reversal in the buying zone.
Pelas support boost 🚀 analysis follow)

BTC/USD) Resistance level pullback Read The ChaptianSMC Trading point update
Technical analysis of Bitcoin (BTCUSDT), highlighting key levels and potential price movements based on trend channels, support/resistance, and RSI. Here's the breakdown:
---
Key Elements in the Analysis:
1. Trend Channel:
BTC is trading within an ascending channel, indicating an ongoing bullish trend.
The recent price action hit the upper boundary (resistance) of the channel, suggesting potential for a pullback.
2. Resistance Zone:
105,586.06 is marked as a resistance level, where price faced rejection.
Strong reaction here suggests sellers are defending this area.
3. Support Zone:
A new support level is established around 98,000.
This zone aligns with the lower boundary of the ascending channel and previous breakout structure.
4. Target Point (Bearish Projection):
The chart projects a potential drop to the 97,367.51 level, representing a ~7.4% correction.
This move mirrors the prior leg up, applying a measured move concept.
5. RSI Indicator:
RSI is around 66–71, indicating overbought conditions.
A bearish divergence or trendline break on RSI suggests weakening momentum.
Mr SMC Trading point
---
Summary of Trading Idea:
Bias: Short-term Bearish (correction within an overall bullish trend)
Expected Move: Potential dip toward 97,367.51 support
Confirmation: Rejection at resistance, RSI divergence, and trendline break
Invalidation: A strong breakout above 105,586.06 would nullify the correction setup and favor continued bullish movement
pelas support boost 🚀 analysis follow)

XUA/USD) bullish trend analysis Read The ChaptianSMC Trading point update
Technical analysis chart for Gold Spot (XAUUSD) on the 4-hour timeframe. Here's a breakdown of the key ideas behind the analysis:
1. Trend and Structure:
The overall trend shows a bullish move followed by a correction and now a potential continuation upward.
A bullish breakout from a descending trendline suggests a shift in momentum from bearish to bullish.
2. Key Zones:
Order Block / Buying Zone (~3,280-3,310): A demand area where price is expected to find support and potentially bounce higher.
Support Level (~3,320-3,360): Price is currently above this level, suggesting buyers are in control.
Resistance Level (~3,440-3,495): Marked as a potential short-term ceiling; a breakout above this level may signal strong bullish continuation.
Target Point (~3,494): This is the projected take-profit level for a bullish move.
3. RSI Indicator:
RSI is around 63–64, close to overbought territory but not yet extreme. This suggests moderate bullish momentum without signs of immediate reversal.
4. Projected Move:
The chart outlines a possible retracement to the support or order block zone, followed by a bounce and a push toward the resistance level and target.
Mr SMC Trading point
Strategy Implication:
Buy on pullback to the support or order block zone.
Stop-loss could be placed below the order block (~3,280).
Take-profit around the target zone (~3,494).
pales support boost 🚀 analysis follow)

EUR/USD) Big Support level Analysis Read The ChaptianSMC Trading point update
Technical analysis of EUR/USD on the 1-hour timeframe. The idea centers around a potential reversal from a major support zone, aiming for higher resistance targets. Here's a detailed breakdown:
---
1. Big Support Level
A strong horizontal support zone is highlighted around 1.1275–1.1290.
Price is currently reacting off this level, suggesting a potential bullish reversal.
2. EMA 200 as Resistance
The 200-period EMA (~1.1346) is above current price, possibly acting as a dynamic resistance.
A break and hold above it could confirm bullish momentum.
3. Resistance Levels & Target Points
The first target is the 1.14367 resistance level, a clear supply zone.
The second target point is around 1.15622, aligned with a previous major high and strong resistance zone.
4. RSI Indicator
RSI is at 44.02, indicating neutral to slightly oversold conditions—this supports a potential bullish move, especially from support.
5. Forecast Path
The chart projects a likely pullback and breakout pattern:
Rebound from the support zone.
Break through EMA 200 and minor resistance.
Rally toward first and second targets.
Mr SMC Trading point
---
Summary of the Idea:
This is a trend-reversal-to-continuation setup, with EUR/USD expected to rise from a key support area toward 1.14367, and potentially 1.15622, provided price holds above the support and breaks the EMA 200.
Pales support boost 🚀 analysis follow)

USD/JPY) Bullish trand analysis Read The ChaptianSMC Trading point update
Technical analysis of USD/JPY on the 2-hour timeframe, and it presents a bullish continuation setup. Here's a breakdown of the key elements and the idea behind the analysis:
---
1. Ascending Channel Formation
The price is trading within an ascending channel, suggesting a controlled uptrend.
Higher highs and higher lows confirm the trend structure.
2. Key Support and Fair Value Gap (FVG)
There’s a well-identified support level where price has bounced before (highlighted in yellow).
A Fair Value Gap (FVG) zone is marked slightly above the support level, which could act as a short-term demand area.
Price is currently pulling back into this zone, potentially setting up a buying opportunity.
3. EMA 200 Support
The 200 EMA (~143.78) is acting as dynamic support just below the current price.
If price drops further, this level may offer strong technical support.
4. RSI Momentum
RSI is above 50 (currently 56.37), supporting the bullish trend and showing room for continued upside.
5. Target Point
The chart anticipates a bounce off the support/FVG zone and a rally toward the upper boundary of the channel, targeting 147.153.
Mr SMC Trading point
---
Summary of the Idea:
This is a bullish continuation setup within an uptrend channel. The analyst expects a potential long entry around the FVG/support zone, with a target at the channel top (147.15). Confluence from the EMA 200, RSI, and previous structure supports this bullish bias.
Pales support boost 🚀 analysis follow)

XAU/USD) Bullish reversal analysis Read The ChaptianSMC Trading point update
technical analysis of Gold Spot (XAU/USD) on the 4-hour timeframe, projecting a bullish outlook. Here's a breakdown of the main ideas conveyed:
1. Support Level & Double Bottom
A strong support level is marked around the 3,177 area, with the price bouncing from it twice (highlighted by two black dots), indicating a potential double bottom pattern, which is typically a bullish reversal signal.
2. EMA 200 Support
The 200 EMA (Exponential Moving Average) lies just below the current price (~3,177), acting as dynamic support. The fact that price is holding above it adds strength to the bullish argument.
3. Bullish Divergence on RSI
The RSI (Relative Strength Index) shows a bullish divergence, where the price made lower lows but RSI made higher lows—another potential reversal indicator.
4. Price Projection
If the bullish move plays out, the chart outlines two upward targets:
Target Point: ~3,501.67
Next Target Point: ~3,729.23
These are based on measured moves from previous impulse legs (shown by vertical blue projections).
5. Entry Setup
The chart suggests a break above the short-term consolidation could trigger the bullish run toward the first target, aligning with bullish price structure and support confirmation.
Mr SMC Trading point
---
Overall Idea: The chart expects a bullish reversal from support, confirmed by double bottom, EMA 200 support, and RSI divergence, targeting higher resistance zones.
Pales support boost 🚀 analysis follow)

Understanding the Inverted Cup and Handle Chart PatternUnderstanding the Inverted Cup and Handle Chart Pattern
Understanding chart patterns is fundamental for market participants. This article delves into the inverted cup and handle formation, a bearish signal indicating a potential downward movement. Explore its identification, trading strategies, psychological underpinnings, common pitfalls, and more to boost your trading knowledge.
What Is the Inverted Cup and Handle Pattern?
The inverted cup and handle, sometimes called an upside-down cup and handle pattern, is a bearish chart pattern that may appear during up- and downtrends. It is the opposite of the traditional cup and handle pattern, which is bullish. The inverse formation consists of two main parts: the "cup," which is an inverted U-shape, and the "handle," a small upward retracement following the cup.
Identifying the Inverted Cup and Handle Pattern
Identifying the inverse cup and handle pattern involves recognising a specific sequence of market movements that signal a potential bearish move. Here's a step-by-step overview of identifying this formation:
Cup Formation
- Shape: The pattern begins with an inverted U-shaped "cup." The price gradually rises, consolidates, and then begins to decline, reflecting a shift from bullish to bearish sentiment.
- Depth: The cup should have a rounded top, not a sharp V-shape, indicating a gradual reversal. The depth of the cup can vary but typically represents a significant portion of the preceding movement.
Handle Formation
- Upward Retracement: After the cup's formation, prices usually experience a minor upward retracement or consolidation, forming the "handle." This movement should be relatively short and not exceed the initial high of the cup.
- Shape and Duration: The handle often appears as a small flag or pennant and should be brief in duration compared to the cup. An optimal handle retraces no more than half of the cup’s depth.
Breakout Confirmation
- Neckline Break: The pattern is confirmed when prices break below the neckline, the lowest point of the handle. This breakout often leads to a significant decline in prices, signalling a bearish trend.
- Volume Surge: Volume typically decreases during the formation of the cup and increases as prices decline, especially during the handle formation. A substantial increase in volume during the breakout can validate the pattern and minimise the risk of false signals.
The Psychology of the Inverted Cup and Handle
The psychology behind the inverse cup and handle pattern is rooted in market sentiment and behavioural finance. This bearish pattern reflects a shift from optimism to pessimism among traders.
- Initial Uptrend: The formation starts with an upward movement, where traders are generally bullish, driving prices higher. This phase is marked by growing confidence and increasing demand.
- Formation of the Cup: As prices peak, consolidate, and start to decline, some traders begin to take profits, leading to reduced buying pressure. The rounded decline of the cup signifies a gradual shift in sentiment from bullish to bearish as traders become cautious and selling pressure mounts.
- Handle Formation: The minor upward retracement forming the handle indicates a brief period of consolidation where the market tests the resolve of buyers. It can be considered a dead cat bounce. This phase often traps optimistic traders who expect the uptrend to resume, but the overall sentiment remains fragile and cautious.
- Breakout and Decline: The decisive break below the neckline represents a culmination of bearish sentiment. At this point, selling pressure overwhelms any remaining bullishness, leading to a sharp decline. The volume surge during this breakout confirms the shift in market psychology from hopeful to bearish as traders rush to exit their positions or initiate short sales.
Trading the Inverted Cup and Handle Pattern
Trading the inverted cup and handle pattern involves careful identification and strategic decision-making to maximise potential returns. This pattern presents two primary entry points for traders: during the handle formation or after the neckline break.
Entry on the Break of the Handle
- Risk-Reward Advantage: Entering on the breakout of the handle’s lower boundary offers a better risk-to-reward ratio but requires more skill and confidence in pattern recognition.
- Technical Tools: Traders often use a medium-term moving average (like 21 periods) to confirm the downward leg of the handle. A decisive close below the moving average indicates a continuation of the downward handle leg.
- Momentum Indicators: Using momentum indicators like the RSI (Relative Strength Index) or stochastic oscillator helps confirm downward movement. Bearish divergence suggests that the bearish trend is likely to continue.
- Volume Analysis: Increasing volume during the handle's breakout indicates strengthening seller control. High volume often validates the pattern and potentially reduces the risk of false signals. Note that volume data may be less reliable in a decentralised forex market.
- Stop Loss and Profit Target: Traders typically place a stop loss above the handle's high to potentially protect against upward spikes. The reverse cup and handle pattern target is usually set at a distance equal to the cup's height, projected downward from the handle's breakout point, although it can be greater if the retracement is particularly shallow.
Entry After the Neckline Break
- Confirmation Advantage: Waiting for the neckline break offers greater confirmation of the formation but may provide a less favourable risk-to-reward ratio.
- Price Action: A decisive close below the pattern's low, ideally with a strong candlestick and minimal wicks, indicates a reliable breakout. This typically confirms the bearish trend and provides a clear entry signal.
- Volume Confirmation: Higher volume during the neckline break can further validate the pattern and indicate that the breakout is genuine and not a false signal.
- Stop Loss and Profit Target: In this scenario, the stop loss is typically set above the handle's high. The profit target remains the same, projecting the cup's height downward from the breakout point.
Common Mistakes to Avoid
When trading the upside-down cup and handle pattern, avoiding common mistakes is key for maximising potential returns. Some of the more common mistakes traders make include:
- Premature Entry: Entering a trade too early, before the handle completes or the neckline breaks, can lead to false signals and losses. Most traders wait for clear confirmation, such as a decisive close below the neckline with increased volume.
- Ignoring Volume: Volume is a critical component in confirming the pattern. Low volume during the breakout phase may indicate a fakeout. Traders typically look for a substantial increase in volume to validate the pattern.
- Incorrect Pattern Identification: Misidentifying the pattern is a common error. The cup should have a rounded bottom, not a sharp V-shape, and the handle should be relatively short. Accurate identification requires practice and attention to detail.
- Overlooking Market Conditions: External factors, such as news events or broader market trends, can impact the pattern’s reliability. Traders consider these conditions when planning their trades.
Advantages and Disadvantages
As with all chart patterns, the inverted cup and handle pattern comes with its pros and cons. Here are some key advantages and disadvantages of using this pattern:
Advantages
- Clear Signal: The pattern provides a clear signal of a potential bearish movement, helping traders anticipate market declines.
- Risk Management: With defined entry and exit points (handle high for stop loss and cup depth for profit target), it aids in effective risk management.
- Flexibility in Analysis: Several forms of analysis, from support/resistance and momentum indicators to volume and price action, can be used to trade the pattern.
- Versatility: Applicable across various timeframes and markets, including stocks, forex, and commodities, making it a versatile tool for different trading strategies.
Disadvantages
- Complex Identification: Accurately identifying the pattern can be challenging, requiring significant experience and skill.
- Rarity: The pattern doesn’t occur frequently, limiting trading opportunities.
- False Breakouts: Like all chart patterns, it is susceptible to false breakouts, especially if not confirmed with volume and other technical indicators.
- Timing Sensitivity: Entering too early during the handle formation can result in premature positions, while waiting for the neckline break might reduce the risk-to-reward ratio.
The Bottom Line
The inverted cup and handle pattern is one of the most popular chart patterns among traders of all levels. However, like any technical formation, it should be used alongside other indicators and sound risk management to potentially increase its effectiveness. By mastering patterns like the inverted cup and handle, traders can gain deeper insights into market psychology and price action to navigate volatile markets with greater confidence.
FAQ
What Is the Inverse Cup and Handle Pattern in Forex?
The inverse cup and handle pattern in forex is a bearish chart pattern. It features an inverted U-shaped cup followed by a small upward retracement (the handle). This pattern suggests that sellers are gaining control, and prices are likely to decline further once the neckline is broken.
How Can You Trade the Inverse Cup and Handle?
Traders can enter positions either on the break of the handle’s lower boundary or after the neckline break. Entering during the handle might offer a better risk-to-reward ratio, while waiting for the neckline break provides greater confirmation. Key tools to validate the breakout include moving averages, momentum indicators like RSI or stochastic oscillator, and volume analysis.
What Happens After the Reverse Cup and Handle Pattern?
After the reverse cup and handle pattern is completed, the price typically moves downward strongly. This bearish movement is often confirmed by a strong breakout below the neckline with increased volume, signalling a sustained decline in prices.
What Is the Opposite of the Cup and Handle?
The opposite of a cup and handle is the inverse cup and handle pattern. While the cup and handle indicates a bullish movement, the inverse version signals a bearish trend.
Is the Inverted Cup and Handle Bullish or Bearish?
The inverted cup and handle pattern is bearish. It indicates that the price will move downwards, suggesting that traders may open short trades.
This article represents the opinion of the Companies operating under the FXOpen brand only. It is not to be construed as an offer, solicitation, or recommendation with respect to products and services provided by the Companies operating under the FXOpen brand, nor is it to be considered financial advice.

USD/JPY) bullish trend analysis Read The ChaptianSMC Trading point update
Technical analysis of USD/JPY chart shows a bullish reversal setup. Here’s a breakdown behind the analysis:
1. Downtrend & Channel Breakout:
Price was trending downward within a descending channel (marked “channel trend”).
Recently, the price broke out of the channel, signaling a potential trend reversal.
2. Demand Zone (Diamond Zone):
The yellow box labeled “Diamond Zone” represents a demand/support zone where price previously found buyers.
A retest of this zone is expected before the bullish move.
3. EMA (200):
The EMA (200) is currently above the price but close. A break above this level (142.522) could add to bullish momentum.
4. RSI Indicator:
RSI is showing a bounce off a mid-level (~50), suggesting bullish momentum is gaining.
5. Target Level:
The analysis targets 147.838, which aligns with a prior resistance zone.
The move projects a 5.19% gain (~778.5 pips) from the current setup.
Trading Idea Summary:
Entry: Around the “Diamond Zone” after a successful retest.
Confirmation: Watch for bullish candlestick patterns or a break above EMA 200.
Target: 147.838
Stop Loss (implied): Below the Diamond Zone (~140.000)
Pales support boost 🚀 analysis follow)

Chart structure reacts to memory. Momentum + reaction zones! BTCWhat you're seeing isn’t just price action—it's memory in motion.
🟥 Prior momentum shifts marked critical turning points where sellers temporarily dominated.
🟩 Support responses signaled reactive strength, giving early signs of accumulation.
📘 Consolidation zones show where price "remembered" to pause—these often act as launchpads or traps.
🟧 Swept demand cleared out weak hands before a sustained move.
📈 Historical resistance, once broken, becomes memory-based support.
Each label isn't a signal—it's a story.
This chart reminds us:
👉 Before price moves, it tests memory.
👉 Before breakouts, it absorbs emotion.
👉 And before trends, it reacts to old battles.
🧠 The more you study structure, the more you see intention—not randomness.

Gold shocks pull the trend towards the bearish side!Gold market trend analysis:
Gold technical analysis: You should have seen the exaggeration of gold, right? Gold has also experienced several major ups and downs in history, but this time is definitely one that can be recorded in the history books. The daily lines in the past few months are very exaggerated, and the rise and fall range is unprecedented. Just today's Asian market, a simple dive is dozens of points. This is the market. The market is always right. We need to respect it the most, rather than blindly look at it subjectively. Surviving in such a big market is the most important thing. Many times, the fluctuation of gold is basically not related to technicality. We try to follow the direct pursuit mode in operation, and we can catch big profits in such a big market. Last week, the weekly line closed with a big tombstone, the weekly line top appeared, and the air force appeared. In May, gold will at least adjust to around 3,000.
The above is the 4-hour pattern, which is repairing below the moving average. If the bulls break 3370 again, there is a possibility of rising again. Otherwise, gold will adjust deeply again. This wave of adjustment is at the weekly level. The daily pattern is also turning into a peaking mode. Note that the rise and fall of gold is not based on technical aspects, but more on fundamentals and big data, as well as the impact of tariffs. Without these influences, we will be bearish this week. If the decline of the big C wave continues, the target will be 3230 (the half point of the entire April rebound) in turn. 3165 is the Fibonacci 61.8 position of the callback and also the previous high point, which is easy to form a rebound. Today's gold focuses on two major suppressions, one is the hourly suppression around 3300, and the other is 3315 and 3328, both of which are opportunities for air forces. On the whole, today's short-term operation strategy for gold is to short on rebounds and to buy on pullbacks. The upper short-term focus is on the 3298-3300 resistance line, and the lower short-term focus is on the 3265-3260 support line. Friends must keep up with the rhythm. It is necessary to control the position and stop loss, set stop loss strictly, and do not resist single operation. The specific points are mainly based on real-time intraday trading. Welcome to experience, exchange real-time market conditions, and follow real-time orders.

XAU/USD) orderblok key Support Analysis Read The ChaptianSMC Trading point update
technical analysis of Gold Spot against USD (XAUUSD) on the 1-hour timeframe. Here's a breakdown of the key ideas presented:
Chart Analysis Summary:
1. Price Zones:
Supply Zone (Resistance): Around the 3,355–3,365 level.
Demand/Support Zone (Doer Block Support Level): Around 3,282–3,291.
2. Current Price Action:
Price is currently at $3,331.96, close to the supply zone, and bouncing between the zones.
There’s a sharp downtrend, which seems to be slowing down near the support level.
3. Projected Move:
The chart suggests a short-term dip back into the demand/support zone, followed by a bullish reversal.
Target Point: A move back up toward $3,498.36, which is marked as a significant resistance.
4. Technical Indicators:
RSI (Relative Strength Index): Currently around 36.64 and recovering, suggesting potential bullish divergence or an oversold condition.
200 EMA: Around $3,291.52, providing dynamic support — aligning with the lower demand zone.
Mr SMC Trading point
Trade Idea:
Buy Setup (Long Trade):
Entry: Near 3,282–3,291 (support zone).
Target: 3,498.36.
Stop Loss: Below the support zone (~3,270).
Overall Idea:
This is a reversal-based setup. The price is expected to retest the support before launching a bullish leg toward the target. The confluence of the EMA, support zone, and RSI near oversold adds weight to the potential for a bounce.
Pelas support boost 🚀 analysis follow)

BTC/USD) breakout up trand analysis Read The ChaptianMr SMC Trading point update
bullish analysis of Bitcoin (BTC/USD) on the 4-hour timeframe, showing a potential breakout and rally scenario. breakdown:
---
1. Market Structure:
Downtrend Channel: Price has been moving within a falling channel.
Double Bottom Pattern: Marked by two green arrows — a bullish reversal signal.
Breakout Attempt: Price is testing the upper trendline and 200 EMA (~$83,952), suggesting possible breakout.
---
2. Key Zones:
FVG (Fair Value Gap): Around $78,678 — a demand zone where price could retest before moving higher.
Breakout Confirmation Zone: ~$85,130 — breaking above this with volume signals strength.
Target Point: $95,206 — an upside target projecting ~31.77% gain from the breakout.
---
3. Indicators:
200 EMA: Currently acting as resistance. Break above it confirms bullish momentum.
RSI: Around 60 — pointing upward with bullish divergence from recent lows, showing increasing buying pressure.
---
4. Scenarios:
Scenario 1 (Bullish Continuation):
Breaks above trendline and 200 EMA.
Retest (optional) and then heads toward $95,206 target.
Scenario 2 (Retest First):
Price dips into the FVG/demand zone.
Finds support and launches upwards, confirming a strong base.
Mr SMC Trading point
---
Summary of the Idea:
This is a buy setup on breakout or on pullback:
Aggressive Entry: Break and close above $85,130.
Safe Entry: Pullback into $78,678 area (FVG).
Target: $95,206
Risk Zone: Below $78,000 (invalidates bullish structure).
Pales support boost 🚀 analysis follow)

AXISBANK – Classic Cup & Handle Breakout | Targeting 1280 & 1320🧠 Technical Analysis:
AXISBANK has formed a textbook Cup and Handle pattern over the past few months. The breakout above the resistance zone around ₹1199 marks a potential start of a new bullish rally.
🔹 Cup Formation: Rounded bottom between Dec 2024 - Apr 2025
🔹 Handle Formation: Consolidation range in Oct - Dec 2024
🔹 Breakout Candle: Strong bullish candle with increasing volume
🔹 200 EMA: Price is now well above the 200 EMA, adding to the bullish bias
🎯 Targets:
Target 1: ₹1280
Target 2: ₹1320
These levels are based on the measured move technique and previous swing highs.
🛡️ Support:
Immediate support lies around the breakout zone near ₹1199
Next strong support is near ₹1090 (200 EMA)
📊 Volume:
Breakout accompanied by a surge in volume confirms buyer interest and validates the pattern.
📌 Conclusion:
AXISBANK is showing strong bullish momentum with a confirmed breakout from a well-defined Cup and Handle formation. As long as it sustains above ₹1199, the stock could potentially rally toward ₹1280 and ₹1320 in the coming sessions.
📅 Keep it on your radar for bullish continuation setups!
Disclaimer:
This analysis is shared purely for educational and informational purposes and should not be considered as financial advice or a recommendation to buy or sell any security. Always do your own research and consult with a qualified financial advisor before making any investment decisions. Trading and investing involve risk.

AUD/USD) Resistance level pullback Short Read The ChaptianSMC Trading point update
analysis of the AUD/USD pair on the 2-hour timeframe, showing a possible bearish setup. Here's a breakdown of the idea behind it:
Key Observations:
1. Current Trend:
The pair was in an uptrend, as indicated by the rising channel (parallel trendlines). However, it has now broken out of that channel.
2. Resistance Level:
The price has reached a resistance zone around 0.64000, and it seems to be rejecting this level.
3. 2 Timeframe Demand Zone:
Around the 0.63300 – 0.63400 range, this area previously acted as a demand zone (support), and the chart suggests price might retest it.
4. Projected Move:
First, a pullback up into the resistance zone could occur.
Then a drop to the demand zone.
If the demand zone fails to hold, the price could head down toward the key support/FVG (Fair Value Gap) around 0.61000 – 0.61500.
5. EMA (200):
The 200 EMA is below the price, suggesting longer-term bullish pressure, but it's starting to flatten, which could signal weakness in the uptrend.
6. RSI Indicator:
RSI is around 52, showing neutral momentum—neither overbought nor oversold, allowing room for movement in either direction.
Mr SMC Trading point
---
Idea Summary:
The chart suggests a potential reversal from the uptrend into a downtrend, triggered by a failure to break above resistance. The two key targets for a bearish move are:
First: the 2TF demand zone
Final: the key support/FVG zone
Pales support boost 🚀 analysis follow)

XAU/ USD) bullish trend analysis Read The ChaptianSMC Trading point update
analysis for XAUUSD (Gold vs. USD) on the 2-hour timeframe appears to suggest a bullish continuation setup after a correction. Here's a breakdown of the idea:
Key Points from the Chart:
1. Rising Channel:
The price is moving within an ascending channel.
After a breakout and strong rally, it is currently in a flag or wedge-like correction pattern.
2. Correction Zone:
The price is consolidating downward inside a small descending wedge (a bullish pattern), potentially forming a bull flag.
This is typically a sign of continuation after a strong upward impulse.
3. Support Zone:
A 4H support level is marked around 3,301.416, which aligns with the lower boundary of the flag pattern.
This is a potential buy zone for price to react and bounce.
4. Target Point:
The target is projected at 3,404.254, implying a breakout to the upside if the support holds.
5. RSI Indicator:
RSI is currently around 65, with previous values near 80, suggesting a slight cooldown but still in bullish territory.
A slight drop in RSI might occur before the next bounce.
6. EMA 200:
The EMA 200 is well below current price (around 3,137), indicating a strong bullish trend.
Mr SMC Trading point
Possible Trade Idea:
Entry: Around the 3,301–3,305 support area.
Confirmation: Wait for a bullish reversal pattern (engulfing candle or strong bounce).
Target: Around 3,404 (as per the marked target zone).
Stop Loss: Below the support zone (e.g., below 3,295), depending on risk tolerance.
Pales support boost 🚀 analysis follow)
