GBP/USD Short Setup – Rejection from Resistance Zone with High REMA 30 (red line)
EMA 200 (blue line)
---
Key Levels:
Entry Point: 1.31324
Stop Loss: 1.32303
Target (TP): 1.28102
---
Analysis:
1. Trend Context:
The market shows a recent bullish move approaching a key resistance zone (highlighted in purple).
The price is now reacting to that resistance zone and potentially forming a reversal.
2. EMA Insight:
Price is currently trading slightly above the EMA 200 and EMA 30, indicating short-term bullish momentum.
However, the suggested trade setup appears to be short (sell), anticipating a reversal from resista
Chatanalysis

USD/JPY Bullish Breakout Setup – Entry, Stop Loss & Target AnalyPair: USD/JPY
Timeframe: 15 minutes
Indicators Used:
EMA (30-period) – Red line
EMA (200-period) – Blue line
Chart Features:
Downward channel (declining trendline)
Identified entry point, stop loss, and target
Key support/resistance zones shaded in purple
🟢 Trade Idea Summary:
🔹Entry Point: 143.126
🔹Stop Loss: 142.702
🔹Target (Take Profit): 148.249
🔹Risk/Reward Ratio: ~1:5 (Excellent R/R)
🔍 Technical Analysis:
✅ Bullish Breakout Signal
Price has broken above the descending channel and has retested the breakout area (highlighted purple zone) – a classic bullish breakout structure.
The breakout retest near 143.126 is acting as support, with potential to launch a new bullish move.
📈 Moving Average Analysis
EMA 30 is starting to flatten and curve up – indicating potential shift in momentum.
EMA 200 is still above price, but a breakout above it could strengthen the bullish case.
🔁 Support and Resistance
Strong support zone around 143.000 – 143.200 area (highlighted zone).
Major resistance and target zone is between 148.000 – 148.250.
🔔 Trade Plan Suggestion:
Go Long at or near 143.126
Place Stop Loss below support at 142.702
Target 148.249 for profit
Reasoning:
This setup offers a trend reversal potential from a downtrend to uptrend, with a clean breakout-retest-confirmation pattern. The wide take profit range gives room for extended upside as momentum builds.
⚠️ Watch For:
Reaction to the 144.325 (EMA 200) level
Increased buying volume to confirm breakout
Any re-entry into the channel (would invalidate setup)

BTC/USD Bullish Breakout Setup – Targeting $85,477 with 5.62% UpThe price has recently surged above both the 30 EMA (red) and 200 EMA (blue), signaling a strong bullish move.
The EMAs are beginning to turn upward, particularly the 30 EMA, suggesting short-term bullish momentum.
Key Levels Identified
Entry Zone (Purple Support Zone):
Around $80,105 – a potential buy zone after a pullback.
Labeled with STOP LOSS, indicating the invalidation level if price drops below this zone.
Target Zone (Purple Resistance Zone):
Around $85,477 – this is the target level, marked as “EA TARGET POINT”.
Offers a potential move of +5.62% or 4,551.83 points.
Price Action
Price broke above a previous resistance (now support) and has pulled back slightly.
The projected move suggests a bullish continuation after a minor pullback and consolidation.
Risk-Reward
Good risk-reward ratio implied with the large gap between the stop loss and target.
Stop loss is tight, just below the purple support zone (~$80,105).
Projection
The blue lines and annotations suggest a bullish play, with an expected upward movement after retesting the support.
✅ Possible Trade Idea
Buy Zone: ~$80,105 (on a confirmed retest)
Stop Loss: Slightly below $80,105
Target: ~$85,477
Expected Move: +5.62%
🔍 Additional Notes
Keep an eye on price behavior around the support zone—confirmation (e.g., bullish candle pattern or rejection wick) strengthens the entry.
The strong move leading to the breakout suggests high momentum, which could mean limited pullback.
News or macro developments could invalidate technicals—be aware of external factors.

Gold (XAU/USD) Intraday Buy Setup – Demand Zone Reversal with 3.Timeframe: Appears to be intraday (possibly 5-15 minutes).
Indicators:
EMA 30 (red): Showing recent bearish momentum.
EMA 200 (blue): Positioned above, indicating a longer-term bearish trend.
Candlestick Pattern: After a steep drop, price shows signs of consolidation and potential reversal.
📌 Trade Setup (Long/Bullish Bias)
Entry Zone: Around $2,963.2
Price is expected to pull back into this purple demand zone before moving up.
Stop Loss (SL): $2,956.1
Placed below the support zone to limit downside risk.
Take Profit (TP / Target Point): $2,988.2
A previous supply zone near the EMA 30, where selling pressure could return.
📊 Risk-Reward Ratio
Risk: $2,963.2 - $2,956.1 = $7.1
Reward: $2,988.2 - $2,963.2 = $25
RRR (Reward-to-Risk Ratio): ~3.5:1
This is a solid ratio, suggesting a high-potential trade if the setup plays out.
📈 Bullish Scenario
Price pulls back into the demand zone (entry).
A bullish candlestick confirmation or wick rejection could trigger a buy.
Target is the previous structure + EMA zone.

EUR/USD Bullish Reversal Setup – Buy from Demand Zone Near 200 EEMA 30 (Red): 1.09984
EMA 200 (Blue): 1.08869
🧠 Trade Idea: Long (Buy) Setup
📍 Entry Zone (Support/Buy Area):
Entry Point: Around 1.08868 – 1.08869
This zone aligns with the 200 EMA, acting as dynamic support.
There's also a clear demand zone (purple box), indicating historical buying interest.
⛔ Stop Loss:
Set at 1.08080
Placed below the demand zone to minimize risk if support fails.
🎯 Take Profit (Target):
Target Point: Around 1.11452
Coincides with a previous supply zone/resistance area (top purple box).
⚖️ Risk-to-Reward (R:R):
Risk: ~80 pips
Reward: ~250 pips
R:R Ratio: ~3.1:1 — A solid risk-to-reward setup.
🔍 Market Structure Observations:
Recent bullish momentum followed by a correction.
Price is approaching major support (near 200 EMA).
Likely scenario: Pullback into the demand zone, then bullish continuation toward the target.

GOLD (XAUUSD) 30-Min Chart Analysis – Key Reversal & Breakout Zo200 EMA (blue): 3085.72 (bearish as price is below it)
30 EMA (red): 3033.52
Current Price: 3034.10
🟪 Key Zones (Highlighted in Purple)
Resistance Zone: Around 3045.54–3065.70
Support Zone: Around 2968.27
Previous High Zone / Target Area: 3158.42
📉 Short Trade Setup (Blue Arrow Going Down)
Entry Area: If price rejects the resistance zone around 3045–3065
Stop Loss: Above the zone, around 3065.70
Take Profit: At the support zone, 2968.27
Risk-to-Reward: Approx. 2.4x (shown as -2.43%)
📈 Long Trade Setup (Blue Arrow Going Up)
Entry Area: If price breaks and holds above the 3065.70 zone
Stop Loss: Below 3045.54 zone
Take Profit: 3158.42 (previous resistance)
Risk-to-Reward: Approx. 3.0x (shown as 3.00%)
💡 Analysis Summary
Price is currently ranging just below the resistance zone.
Two possible scenarios:
Rejection from the zone → short entry.
Breakout above zone → long opportunity.
Use EMA alignment for confirmation:
Bearish if price stays below both EMAs.
Bullish if price breaks above 200 EMA (3085.72).

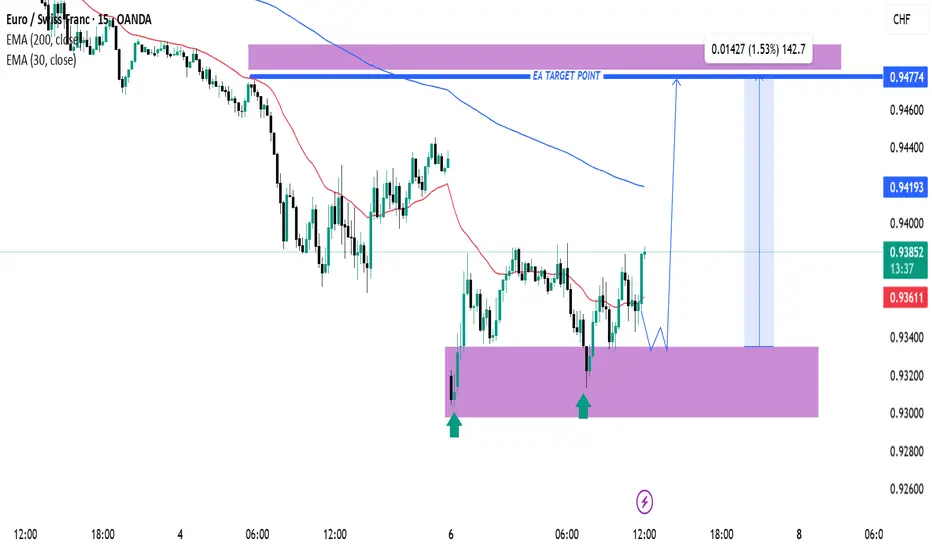
EUR/CHF Bullish Reversal Setup from Key Support Zone – Targeting1. Support Zone (Purple Box at Bottom):
The price has tested this zone multiple times (marked by green arrows), indicating strong demand and a potential double or triple bottom pattern forming.
This support zone ranges roughly between 0.93150 and 0.93350.
2. Projected Bullish Move:
A projected move is drawn from the current price level (around 0.93638) to a target zone near 0.94774, which is marked as the "EA Target Point".
This suggests a potential gain of approximately 1.53% (142.7 pips).
3. Exponential Moving Averages (EMAs):
EMA 30 (red) is currently below the
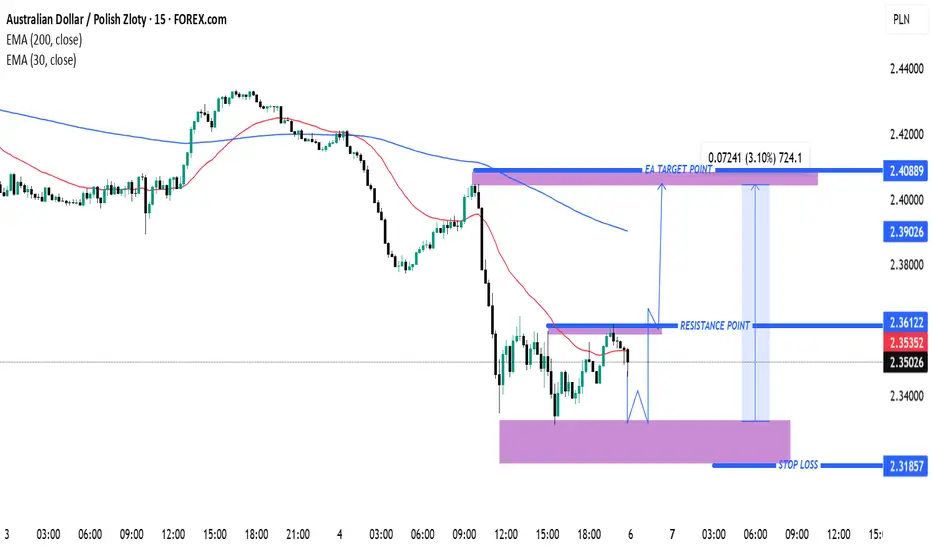
AUD/PLN Bullish Reversal Setup – Buy from Demand Zone Toward 200EMA 30 (Red): 2.35352
EMA 200 (Blue): 2.39026
🧠 Trade Setup: Potential Long Opportunity
📍 Current Price: 2.35026
📌 Key Levels:
Entry Zone (Demand Zone): Around 2.31857 – 2.34500
Strong historical support (highlighted in purple).
Market is expected to pull back here before bouncing.
Stop Loss: 2.31857
Placed below the demand zone to avoid false breakouts.
Resistance Point (Initial Obstacle): 2.36122
Short-term resistance where price previously rejected.
EA Target Point (Main Take Profit): 2.40889
Aligned with a major resistance + 200 EMA.
Also the top of a prior consolidation zone.
⚖️ Risk-to-Reward Breakdown:
Risk: ~317 pips
Reward: ~724 pips
R:R Ratio: ~2.3:1 — Favorable for intraday-to-short-term swing setups.
🔍 Market Insights:
Price has dropped sharply and is consolidating near a support area.
The 200 EMA overhead is sloping downward — signifying overall bearish pressure, but short-term correction is possible.
A bounce from the demand zone could lead to a bullish retracement.
EUR/JPY Bullish Breakout Setup with 2.02% Target PotentialEMA 30 (red): 160.813
EMA 200 (blue): 161.441
---
Highlighted Zones & Points:
1. Entry Point:
Marked around 160.719 (just below EMA 30)
Positioned in a demand/support zone (highlighted purple box)
2. Resistance Point:
Marked at 161.799
Serves as a minor resistance level before the major target
3. EA Target Point:
Final target is 163.880
This represents a potential move of 3.253 units or 2.02%
---
Interpretation:
Bullish Bias: The chart suggests a bullish setup, anticipating a breakout above EMA 200 and the resistance point toward the target of 163…

ODOS/USDT 2H Chart – Bullish Reversal Setup from Demand Zone witAsset: ODOS/USDT
Timeframe: 2H
Current Price: 0.005070
EMAs:
200 EMA (blue): 0.006703
30 EMA (red): 0.005546
🟩 Trade Setup (Long Position)
Entry Zone: Around 0.004778
Stop Loss: Below support at 0.004229
Target 1 (TP1): 0.006082
Target 2 (TP2): 0.007054
📈 Risk-to-Reward & Potential
TP1 Gain: ~27.3%
TP2 Gain: ~47.36%
This is a high R:R trade from a key demand zone after a strong downtrend, suggesting a possible reversal.
🔧 Key Observations
Price is bouncing off a demand zone (highlighted in purple).
If buyers maintain control and break above the 30 EMA, a move toward the first resistance zone is likely.
Watch for:
Bullish candlestick patterns at the entry level
Break and retest of the 0.0055–0.0060 zone for confirmation
✅ Strategy Summary
This setup suggests a reversal long trade from strong support with good upside potential. The targets are layered, allowing partial take-profits or scaling based on momentum.

USD/CAD Rejection Trade Setup – Short from Supply Zone with RisiTimeframe: 30 Minutes (M30)
Indicators:
EMA 30 (Red): 1.41932
EMA 200 (Blue): 1.42196
🧠 Trade Setup: Potential Short Opportunity
📍 Current Price: 1.42252
📌 Key Levels:
Entry Point (Supply Zone): 1.42582
Strong resistance zone, overlapping with EMA 200 and a previous consolidation zone.
Price has entered a rising wedge pattern—a potential bearish reversal signal.
Stop Loss: 1.42987
Placed just above the supply zone to avoid premature exit due to a false breakout.
Take Profit (EA Target Point): 1.40379
Aligns with previous demand zone, solid support level.
⚖️ Risk-to-Reward Breakdown:
Risk: ~335 pips
Reward: ~2047 pips
R:R Ratio: ~1:6 — Excellent risk-to-reward ratio for a swing short.

Gold (XAU/USD) Technical Analysis: Key Resistance Test Before BrThis chart represents a Gold (XAU/USD) 30-minute timeframe analysis from TradingView. Here are the key takeaways:
Technical Indicators & Levels
Exponential Moving Averages (EMAs)
200 EMA (Blue Line): 3,110.97 – A long-term trend indicator.
30 EMA (Red Line): 3,134.65 – A short-term trend indicator.
Key Levels
Resistance Point: Around 3,136.56.
Support Zone (Stop Loss Level): 3,103.16.
Target Point: 3,167.44, indicating a potential 1.62% upside.
Potential Trade Setup
Scenario 1 (Bullish Case):
If price breaks above resistance (3,136.56) and holds, the next target is 3,167.44.
A bullish breakout could indicate further momentum.
Scenario 2 (Bearish Case):
If price fails to break resistance and drops, it could test the support zone around 3,103.16.
A break below this level might lead to further downside.
Pattern Analysis:
The chart suggests a potential retest of resistance before a breakout.
A possible accumulation phase before a strong move.
Conclusion
Bullish above 3,136.56, targeting 3,167.44.
Bearish below 3,103.16, watching for downside risk.
The 200 EMA (3,110.97) could act as dynamic support.

Bitcoin (BTC/USD) Technical Analysis: Breakout or Rejection at K200 EMA (Blue Line): 84,124 – This is a long-term trend indicator.
30 EMA (Red Line): 83,925 – A short-term trend indicator.
Key Levels
Resistance Point: Around 83,925 (marked in blue).
Support Zone: Around 82,184 (Stop Loss zone).
Target Point: 88,197, indicating a potential 6.34% upside.
Potential Trade Setup
Scenario 1 (Bullish Case):
If price breaks above resistance (83,925) and EMA 200, then a move towards 88,197 is expected.
A breakout confirmation might lead to an uptrend continuation.
Scenario 2 (Bearish Case):
If price rejects at resistance (83,925) and falls back below the support zone (82,184), a downward move could happen.
Pattern Analysis:
The chart suggests a potential accumulation phase before a breakout.
Possible retest of resistance before a rally.
Conclusion
Bullish above 83,925, targeting 88,197.
Bearish below 82,184, with potential downside.
Price action near the 200 EMA is crucial for the next move.

USD/CAD Bullish Trade Setup: Key Support, Entry, and Target AnalThis chart is a technical analysis of the USD/CAD currency pair on a 3-hour timeframe. Here’s a breakdown of the key elements:
Key Observations:
1. Exponential Moving Averages (EMAs):
200 EMA (Blue Line) at 1.43318 – A long-term trend indicator.
30 EMA (Red Line) at 1.43135 – A short-term trend indicator.
The price is currently trading above both EMAs, suggesting a bullish bias.
2. Support and Resistance Levels:
A support zone (purple box) around 1.43010 to 1.43141 has been identified, which the price is expected to respect.
The target level (EA TARGET POINT) is set at 1.44511, indicating a bullish price movement expectation.
3. Entry, Stop Loss & Take Profit:
Entry Point: Near the 1.43318 level (current price area).
Stop Loss: Placed below the supp

EUR/USD Technical Analysis: Bullish Reversal Setup with Key SuppThis chart appears to show a technical analysis of the EUR/USD currency pair on a 30-minute timeframe. Here’s a breakdown of the key elements:
Key Observations:
1. Support & Resistance:
A support zone is marked in purple around 1.07679 - 1.07845.
A resistance level is marked at 1.07895, suggesting a potential breakout.
2. Exponential Moving Averages (EMAs):
200 EMA (blue): 1.08069 – This acts as a longer-term trend indicator.
30 EMA (red): 1.08008 – This provides short-term trend guidance.
3. Trade Setup:
Entry Point: Around the support zone (1.07845).
Stop Loss: Below 1.07679.
Target: 1.08481, implying a potential upward move of 63 pips (0.58%).
4. Price Action Expectation:
The analysis suggests a potential bullish reversal from the support zone

EUR/JPY Technical Analysis: Key Support Test and Potential BreakThe image is a technical analysis chart for the EUR/JPY currency pair on a 3-hour timeframe. Here’s a breakdown of the analysis:
Key Elements of the Chart:
1. Support & Resistance Levels:
A resistance level is marked near 161.100.
A support zone is highlighted in purple around the 160.820 - 161.100 area.
A stop-loss level is indicated below 160.820, around 160.259.
2. Exponential Moving Averages (EMA):
200 EMA (Blue Line): 161.100, indicating a long-term trend support.
30 EMA (Red Line): 161.889, representing a short-term trend resistance.
3. Trade Setup:
The price is currently testing the support zone.
A potential long entry (buy position) is anticipated if price bounces from the support level.
Target Point (Take Profit) is set at 164.241.
Risk-

AUD/PLN Technical Analysis: Potential Reversal from Resistance ZThis is a technical analysis chart of the Australian Dollar (AUD) against the Polish Zloty (PLN) on a 30-minute timeframe from TradingView. Here are the key observations:
1. Resistance Zone (Purple Box at the Top):
The price is approaching a key resistance area around 2.4350 - 2.4450.
This zone has previously acted as resistance, suggesting a potential price reversal.
2. Exponential Moving Averages (EMA):
The 200 EMA (Blue Line) at 2.42878 and the 30 EMA (Red Line) at 2.42619 indicate trend direction.
Price is currently testing the 200 EMA, which can act as a dynamic resistance.
3. Projected Price Action (Blue Path):
The analyst expects the price to reject the resistance zone and move downward.
A possible bearish movement is indicated towards the targ

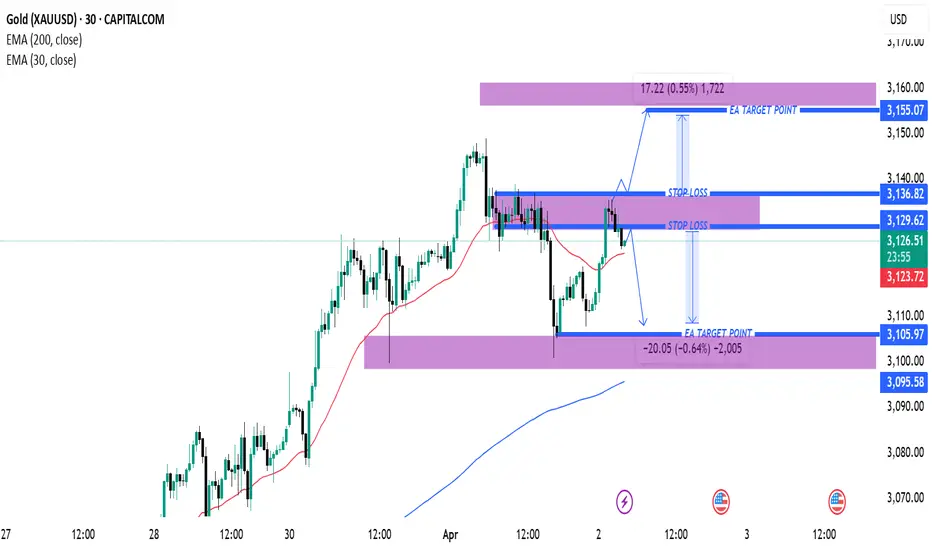
Gold (XAUUSD) 30-Min Analysis – Key Levels & Trade SetupPrice Levels:
Current price: 3,126.01
Resistance: 3,136.82 (stop-loss level for short trades)
Support: 3,105.97 (target level for short trades)
Another resistance at 3,155.07 (target level for long trades)
Moving Averages:
EMA 200 (blue line): 3,095.57 – Long-term trend indicator; price is above, indicating a bullish bias.
EMA 30 (red line): 3,123.69 – Short-term trend indicator; price is currently near this level.
Trading Strategy:
The chart appears to be showing a possible short trade setup if price rejects resistance at 3,129.62 - 3,136.82.
If price moves below 3,123.69, it could indicate downside momentum toward 3,105.97.
Alternatively, a breakout above 3,136.82 could trigger a move toward 3,155.07.
Risk/Reward Analysis:
Short setup: Entry near 3,129.62, stop-loss around 3,136.82, target 3,105.97.
Long setup: Entry above 3,136.82, stop-loss below 3,129.62, target 3,155.07.
Conclusion:
Bullish Scenario: If price breaks 3,136.82, a move toward 3,155.07 is likely.
Bearish Scenario: If price stays below 3,129.62, it could drop toward 3,105.97.
EMA 30 as dynamic support/resistance: Watch for price reaction around 3,123.69.
USD/JPY 30-Minute Trade Setup: Bullish Reversal from Key SupportEMA (30, close) - Red Line: 149.488 (shorter-term trend)
EMA (200, close) - Blue Line: 149.862 (longer-term trend)
Trade Setup:
Entry Zone: Around 149.000 (marked by the purple support area)
Stop Loss: 148.698 (below the key support level)
Target Point: 150.275 (potential profit level)
Analysis:
Price is currently testing a strong support zone (purple area), suggesting a possible bullish reversal.
The 30 EMA (red) is acting as local resistance.
The 200 EMA (blue) is positioned above, which may act as further resistance if price moves up.
The price action suggests a potential bounce from support, leading to a target around 150.275.
Risk-to-Reward Consideration:
Stop loss is placed slightly below the support zone for risk management.
Target price provides a favorable risk-to-reward ratio of approximately 1:3.
Conclusion:
A long (buy) trade is expected if price holds above the support zone.
If price breaks below 148.698, the bullish setup could be invalidated.
A break above 149.862 (200 EMA) would confirm a stronger bullish continuation.

Gold (XAUUSD) 30-Minute Trade Setup: Bullish Reversal from SuppoThis chart represents a trading analysis for Gold (XAUUSD) on a 30-minute timeframe. Here are the key points from the chart:
Technical Indicators:
EMA (30, close) - Red Line: 3,124.52 (shorter-term trend)
EMA (200, close) - Blue Line: 3,090.41 (longer-term trend)
Trade Setup:
Entry Point: 3,108.21
Stop Loss: 3,098.52 (just below the support zone)
Target Point: 3,149.04 (potential profit level)
Analysis:
The price is currently bouncing from a purple support zone, which aligns with a short-term retracement.
The 30 EMA (red) is currently above the price, indicating short-term resistance.
The 200 EMA (blue) is significantly lower, showing that the overall trend is still bullish.
A potential long (buy) trade is suggested, as price is expected to reverse from the support level towards the target point of 3,149.04.
Risk-to-Reward Ratio:
The stop loss is set below the key support level to minimize risk.
The target price provides a significant profit potential.
Conclusion:
If price holds above 3,108.21, there is a strong bullish case.
If price breaks below 3,098.52, the bullish setup may become invalid.
Monitoring the 30 EMA resistance will be crucial for confirmation.

GBP/USD 1-Hour Chart Analysis: Bearish Setup with Key ResistanceGBP/USD 1-Hour Chart Analysis: Bearish Setup with Key Levels
Key Technical Indicators:
Current Price: $1.29427
30 EMA (Red Line): $1.29453 (Short-term trend)
200 EMA (Blue Line): $1.29351 (Long-term trend)
Key Resistance Zone: $1.29663 - $1.29851 (shaded purple)
Support & Target Levels:
TP 1: $1.29358
TP 2: $1.29153
TP 3: $1.28895
Final Target: $1.28662
Analysis:
Trend:
The price is struggling around the 30 EMA and 200 EMA, showing indecision.
The shaded resistance zone ($1.29663 - $1.29851) is a key area where sellers may take control.
Trade Setup:
Entry: Expected near $1.29663 (potential rejection from resistance).
Stop Loss: Above $1.29851 (to minimize risk if price breaks higher).
Take Profit Targets: Multiple levels, with the final target at $1.28662.
Bearish Confirmation:
If price gets rejected at resistance, a downside move toward support levels is likely.
A break below 1.29358 could accelerate selling pressure.
Conclusion:
The chart suggests a potential bearish trade setup, with resistance acting as a key rejection point.
Watch for confirmation signals at the resistance zone before entering a short trade.
A break above $1.29851 would invalidate the bearish outlook.

"Bitcoin (BTC/USD) Price Analysis: Key Support Test & Potential This chart is a Bitcoin (BTC/USD) price analysis on a 1-hour timeframe from TradingView. Here are the key insights:
Technical Indicators:
Exponential Moving Averages (EMAs):
200 EMA (blue): 85,984 (indicates long-term trend support/resistance).
30 EMA (red): 85,705 (short-term trend direction).
Support & Resistance Zones:
Purple Zone (Support Area): This area has been tested multiple times and is expected to provide a strong buying zone.
Resistance/Target Levels:
Upper EA Target Point: 88,366 (potential bullish target).
Lower EA Target Point: 79,819 (potential bearish target).
Trade Setup:
Entry Point: Around 83,810 (current price near support).
Stop Loss Levels:
Conservative: Around 83,750
Aggressive: Around 83,184
Target Point: 88,366 (bullish) or 79,819 (bearish).
Market Outlook:
The price is currently testing a key support zone.
If the support holds, we may see a bullish reversal toward 88,366.
If the price breaks below the support, further downside to 79,819 is possible.

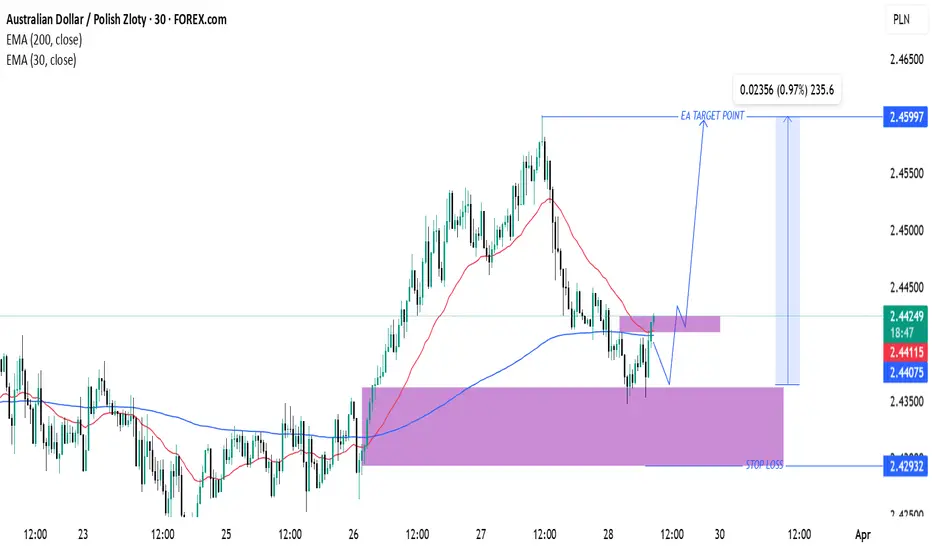
AUD/PLN Trade Setup: Bullish Reversal & Target ProjectionAUD/PLN Technical Analysis & Trade Setup
Chart Overview:
Currency Pair: Australian Dollar (AUD) / Polish Zloty (PLN)
Timeframe: 30-minute chart
Indicators:
200 EMA (Blue): 2.44075
30 EMA (Red): 2.44113
Key Levels & Strategy:
Support & Resistance:
Major Support Zone: Around 2.42932 (Stop Loss Area)
Intermediate Resistance: Near 2.44228
Target Resistance (Take Profit): 2.45997
Trade Projection:
The price recently bounced off the support zone (purple).
A possible retracement and retest of resistance before a strong upward move.
Targeting 0.97% profit potential from 2.44228 to 2.45997.
Entry Strategy:
Confirmation of support hold at 2.44075 - 2.44228.
If price respects this zone, a bullish continuation is expected.
If support fails, price may revisit the stop-loss area (2.42932).
Conclusion:
If price sustains above 2.44113, a bullish move is expected.
Watch for a breakout above resistance for a confirmed long entry.
A drop below 2.42932 would invalidate the setup.