Olin Corporation | OLIN | Long at $21.81Olin Corp NYSE:OLN is currently trading within my "crash" simple moving average area (green lines on the chart). Historically, the price trades within this area for the company, consolidates, and then moves up. After today's earnings, which were relatively positive, the stock may gain some traction and move up. However, I am cautious a media-heightened economic downturn could send NYSE:OLN (a global manufacturer of chemical products and ammunition) to $13 to close the existing price gaps on the daily chart. Regardless, it's a strong company that has been trading on the US stock exchange since the mid-1970s - it's seen rough times before. While 2025 is likely to be a tough year, future earnings projections predict robust earnings growth. Time will tell...
Thus, at $21.81, NYSE:OLN is in a personal buy-zone with noted caution if there is an economic downturn down to $13 a share. The price gap around $19 may also be closed in the near-term.
Targets into 2028:
$28.00 (+28.4%)
$31.50 (+44.4%)
Chemicalstock

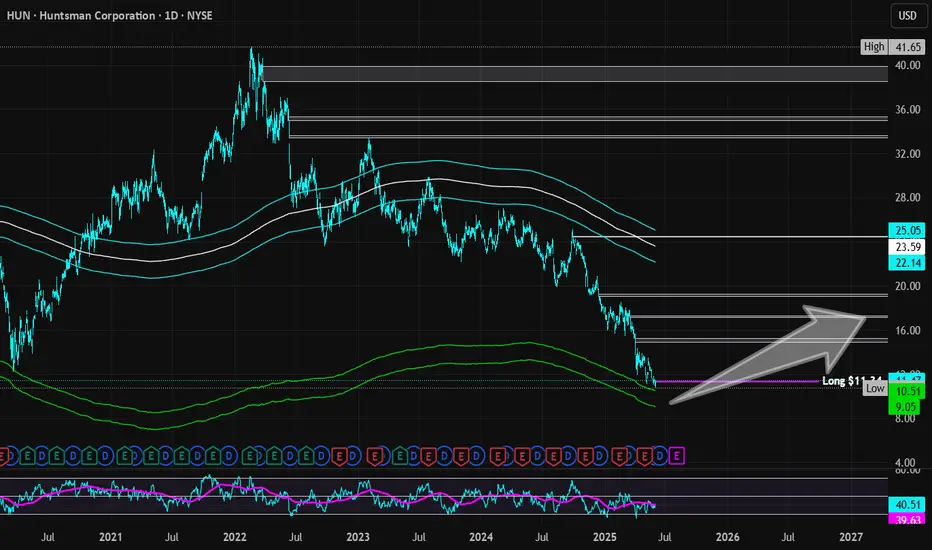
Huntsman Corporation | HUN | Long at $11.34The stock price for Huntsman Corp NYSE:HUN , a manufacturer of organic chemical products, has dropped significantly since its peak in 2022 ($41.65). This was due to lower sales volumes, weak demand in construction and transportation, higher input costs, and European operational challenges, including a $75M hit from closing a German Maleic Anhydride facility. This year (2025) is anticipated to be its worst earnings year, and the stock is priced as such. However, this stock is historically cyclical, and the company expects recovery / growth again in 2026. Moving forward, earnings are forecast to grow and the company is trading at good value compared to peers and the industry. While many headwinds may still exist with tariffs, etc., insider are grabbing shares and large options positions (very bullish). With a book value of $17, debt-to-equity at 0.8x, quick ratio under 1, etc., the company appears healthy.
From a technical analysis perspective, the stock price just barely missed my "crash" simple moving average area (currently between $9.00 and $10.50). It may reach those levels and below in 2025, for which I will add another position as long as fundamentals do not change. This moving average area often signifies "bottom" territory and historically, the stock has rebounded from this area. While my entry at $11.34 may be a little early, predicting true bottoms isn't my trading method and I hope to strengthen the position at lower trading prices.
Targets:
$15.00 (+32.2%)
$17.25 (+49.9%)
Celanese Corp | CE | Long at $39.64Celanese Corp is another chemical company (like Dow Inc) crushed by tariffs and economic headwinds. It's dropped -78% in one year.... However, this is a very strong company with strong credit market interest and no immediate liquidity crisis. From a technical analysis perspective, this... like in 2008 and 2020... is the time to gather shares given it has reached the "abysmal crash" levels based on my selected simple moving averages. In the past, recovery to new highs has taken 1-2 years. History doesn't always repeat, but fear is opportunity in the stock market. If negative news continues to reign, a dip into the high $20's isn't out of the question.
If the company can squeak through 2025 and not continue to stack debt (debt/equity=2.43x), the growth opportunity into 2027-2028 looks promising.
I'm keeping my targets into 2026 low, but this could be a good buy and hold for the right investor.
Targets:
$47.00
$54.75

Dow Inc.: Low in PlaceDow Inc. managed to hold and respond well within our active Target Zone(s) between $35.93 and $22.83 at the relevant Fibonacci levels. We currently assume that wave (II) in blue has been successfully completed, which leads us to anticipate a rise above the two indicated resistance levels ($55.67 and $71.86). Our zones remain active and could still be used for entering long positions. However, it should be noted that the price range could be tested further, and a completely new low is even possible under our alternative scenario: this wave count outlines a significantly stronger setback with the blue wave alt.(II), which would mean breaking through our dark green-blue Target Zones (probability: 35%).

Buying opportunity in clean science Clean science give us big breakout after so many months and this breakout is strong with rsi support which also gives breakout
Buy Clean science at 1591-1625
Target 1689 1747 1841 1899
Sl 1559

How to trade GSFCIn consolidation phase now from 323,
Can correct till 243.7 (done ), 219.3, 195
and then might rise towards 322, 401, 450
in 2 years
So, buy few now, and buy on lower levels and hold
so many chemical stocks are in consolidation , giving opportunity to accumulate , can invest 5-10% capital and hold for very good gains in 4 to 6 months.

Deepak NitriteHello & welcome to this analysis using Ichimoku Multi Time Frame Analysis
Stock has a history of lengthy periods of sideways correctives. The current scenario suggesting a trend line resistance if taken out then upside till 2250-2350 where it faces a major resistance. Support at 2050-25 if violated then next major support at 1900-1875. Anything below that would be bad for it.
Happy Investing

SRF LTD target 2637.70The company is second largest company in chemical sector in Bharat. It trades between a range of 2155 and 2637 and has completed the range 4 time in past 1 and a half years. It will again touch th same level of 2637.7 because of increasing profits and increasing CWIP.

daily chart analysis for SUMICHEMStock analysis for SUMITOMO CHEMICAL IND LTD
keep watching add to watch list
price falling each time when touches to upper trend line
with conforming signal by RSI falling when it touch to 70
again price is testing upper trend line and RSI at 70 from here we can expect down side move in stock to lower trend line
if price successfully closes above upper trend line then it may go more up side
if price breakdown the lower trend line then rsi trend line will also break then will consider it more fresh selling and fall in price

FAIRCHEM ORGANICS Trend AnalysisPrice is showing hidden bearish divergence with RSI on Daily & Weekly TF.
Descending broadening wedge pattern is forming as highlighted.
Fundamentally the stock is highly overvalued.
Good to accumulate around 850-900 levels for the following targets:
Short term swing target @ 1590 (76.67% ROI)
Medium term swing target @ 2250 (150% ROI)
Long term positional target @ 3300 (266.67% ROI)
Do your own due diligence before taking any action.
Peace!!

Fine Organics BreakoutThe stock has broken out and retested, therefore may undergo a reversal rally. Trade is supported by brokerage calls and Supports Nearby.
Risk Reward Ratio - 2:1
SL is placed below support zone & the lower trendline. The target is placed near resistance.

Laxmi Organic Industries ltdLaxmi Organic Industries locked in upper circuit on healthy Q3 earnings
Laxmi Organic Industries' December quarter operating revenue grew 97 percent year-on-year to Rs 859.9 crore

ercros solid chemicals company, on a weekly tf is forming a cup and handle, but for now better look at lower tf.
ibex35 looks fighting with the 9000pts resistance zone, but i have no doubt it will surpass it due to EU not easing QE, this might drag up with it this shit.
technicaly formed a reverse H&S, had a false break thru, quite big one, but spanish stocks are quite a mess by this point of view. the final pattern's target is very close to the 1.6 fib extention.

BASF this is what I expect from such a companyMy advisor Marketmiracle generated a purchase signal on BASF at a price of 69.16 with a target price of 72.95 or with a potential profit of 5.48%
Effectively the last business results have been beyond the expectations and from the diagram it is clear as the title, after to have tried a sudden climb of fact has been collided with of the technical resistances that have rejected it.
Now seems back the time of collection and, considering also the market sentiment that has returned slightly positive (0.02) we should start to see an increase in prices definitely up to the price of 72.95 indicated by the advisor but perhaps even beyond.
It might therefore be interesting to start taking positions on BASF and then assess whether to close at that level or let go of positions for a more consistent climb.
This idea is based on a signal generated by the advisor Marketmiracle, down on this page you will find the link to the page of signals of the advisor that you can see for free without any cost or registration
