USD/CHF is heading into 38.2% Fibonacci resistance?Price is rising towards a resistance level which is a pullback resistance that aligns with the 38.2% Fibonacci retracement and could reverse from this level to our take profit.
Entry: 0.90951
Why we like it:
There is a pullback resistance level which aligns with the 38.2% Fibonacci retracement.
Stop loss: 0.91505
Why we like it:
There is a pullback resistance level which is slightly above the 61.8% Fibonacci retracement.
Take profit: 0.90119
Why we like it:
There is a pullback support level.
Please be advised that the information presented on TradingView is provided to Vantage (‘Vantage Global Limited’, ‘we’) by a third-party provider (‘Everest Fortune Group’). Please be reminded that you are solely responsible for the trading decisions on your account. There is a very high degree of risk involved in trading. Any information and/or content is intended entirely for research, educational and informational purposes only and does not constitute investment or consultation advice or investment strategy. The information is not tailored to the investment needs of any specific person and therefore does not involve a consideration of any of the investment objectives, financial situation or needs of any viewer that may receive it. Kindly also note that past performance is not a reliable indicator of future results. Actual results may differ materially from those anticipated in forward-looking or past performance statements. We assume no liability as to the accuracy or completeness of any of the information and/or content provided herein and the Company cannot be held responsible for any omission, mistake nor for any loss or damage including without limitation to any loss of profit which may arise from reliance on any information supplied by Everest Fortune Group.
Chf

USDCHFWe are in a down trend and currently in the corrective phase of the leg.
We have not gotten a multi touch confirmation but we got a second touch which is also still valid to use. Price tested the previous high and rejected. Going down into lower time frames.
The are 3 bearish soldiers from that rejection which show further market strength. We are in a very corrective ascending channel. We formed another correction (it has been 6-8 hours).
Sell Idea also still has kinks so make sure to follow your plan and manage according to your system.

Heading into 38.2% Fibonacci resistance?The Swissie (USD/CHF) is rising towards the pivot and could potentially reverse to the 1st support.
Pivot: 0.90948
1st Support: 0.90138
1st Resistance: 0.91514
Risk Warning:
Trading Forex and CFDs carries a high level of risk to your capital and you should only trade with money you can afford to lose. Trading Forex and CFDs may not be suitable for all investors, so please ensure that you fully understand the risks involved and seek independent advice if necessary.
Disclaimer:
The above opinions given constitute general market commentary, and do not constitute the opinion or advice of IC Markets or any form of personal or investment advice.
Any opinions, news, research, analyses, prices, other information, or links to third-party sites contained on this website are provided on an "as-is" basis, are intended only to be informative, is not an advice nor a recommendation, nor research, or a record of our trading prices, or an offer of, or solicitation for a transaction in any financial instrument and thus should not be treated as such. The information provided does not involve any specific investment objectives, financial situation and needs of any specific person who may receive it. Please be aware, that past performance is not a reliable indicator of future performance and/or results. Past Performance or Forward-looking scenarios based upon the reasonable beliefs of the third-party provider are not a guarantee of future performance. Actual results may differ materially from those anticipated in forward-looking or past performance statements. IC Markets makes no representation or warranty and assumes no liability as to the accuracy or completeness of the information provided, nor any loss arising from any investment based on a recommendation, forecast or any information supplied by any third-party.

Bearish reversal off 38.2% Fibonacci retracement resistance?USD/CHF is rising to a resistance level, which is a pullback resistance that aligns with the 38.2% Fibonacci retracement, and could reverse from this level to our take profit.
Entry: 0.90966
Why we like it:
There is a pullback resistance level which aligns with the 38.2% Fibonacci retracement.
Stop loss: 0.91527
Why we like it:
There is a pullback resistance level which is slightly above the 61.8% Fibonacci retracement.
Take profit: 0.90102
Why we like it:
There is a pullback support level.
Please be advised that the information presented on TradingView is provided to Vantage (‘Vantage Global Limited’, ‘we’) by a third-party provider (‘Everest Fortune Group’). Please be reminded that you are solely responsible for the trading decisions on your account. There is a very high degree of risk involved in trading. Any information and/or content is intended entirely for research, educational and informational purposes only and does not constitute investment or consultation advice or investment strategy. The information is not tailored to the investment needs of any specific person and therefore does not involve a consideration of any of the investment objectives, financial situation or needs of any viewer that may receive it. Kindly also note that past performance is not a reliable indicator of future results. Actual results may differ materially from those anticipated in forward-looking or past performance statements. We assume no liability as to the accuracy or completeness of any of the information and/or content provided herein and the Company cannot be held responsible for any omission, mistake nor for any loss or damage including without limitation to any loss of profit which may arise from reliance on any information supplied by Everest Fortune Group.

Week 19 Analysis (06May) + Week 18 ReviewWelcome Fellow Traders!
Tech Analysis for the coming week + review of the current!
Usually takes about 15-20 mins, sharing as much as possible, Stay Tuned!
If you find the content useful to you, do follow me on trading view and give me a Rocket BOOST!

USDCHF: Multi TFDespite positive news for CHF, we view the pair as bullish as long as it remains above 0.90892.
The daily chart reveals a clear short-term bullish channel.
On the 4-hour chart, a strong zone is apparent.
Exercise caution:
Do not enter long positions until the LR + 2 * stdev line is broken.
Avoid short positions until the level of 0.90892 is breached.

Sell GBPCHF Channel BreakoutThe GBP/CHF pair on the M30 timeframe presents a potential shorting opportunity due to a recent downward breakout from a well-defined bearish channel pattern. This breakout suggests a shift in momentum towards the downside and a higher likelihood of further declines in the coming hours.
Key Points:
Sell Entry: Consider entering a short position (selling) below the broken support level of the channel, ideally around 1.1500 after confirmation of the breakout. This offers an entry point close to the perceived shift in momentum.
Target Levels: Initial bearish targets lie at the previous support levels within the channel, now acting as potential resistance zones:
1.1430: This represents the first level of support within the channel.
1.1395: This is a further extension of the downside target, based on the height of the recent price movement before the breakout.
Stop-Loss: To manage risk, place a stop-loss order above the broken support line of the channel, ideally around 1.1515. This helps limit potential losses if the price unexpectedly reverses and breaks back upwards.
Thank you.

USD/CHF potential bullish rise?Price has just bounced off the support level which is a pullback support that lines up with the 50% Fibonacci retracement and could potentially rise to our take profit.
Entry: 0.91511
Why we like it:
There is a pullback support level which aligns with the 50% Fibonacci retracement.
Stop loss: 0.90981
Why we like it:
There is a pullback support level
Take profit: 0.92252
Why we like it:
There is a pullback resistance level
Please be advised that the information presented on TradingView is provided to Vantage (‘Vantage Global Limited’, ‘we’) by a third-party provider (‘Everest Fortune Group’). Please be reminded that you are solely responsible for the trading decisions on your account. There is a very high degree of risk involved in trading. Any information and/or content is intended entirely for research, educational and informational purposes only and does not constitute investment or consultation advice or investment strategy. The information is not tailored to the investment needs of any specific person and therefore does not involve a consideration of any of the investment objectives, financial situation or needs of any viewer that may receive it. Kindly also note that past performance is not a reliable indicator of future results. Actual results may differ materially from those anticipated in forward-looking or past performance statements. We assume no liability as to the accuracy or completeness of any of the information and/or content provided herein and the Company cannot be held responsible for any omission, mistake nor for any loss or damage including without limitation to any loss of profit which may arise from reliance on any information supplied by Everest Fortune Group.

GBPCHF to find a top?GBPCHF - 24h expiry
We are trading at overbought extremes.
Although the bulls are in control, the stalling positive momentum indicates a turnaround is possible.
This is negative for short term sentiment and we look to set shorts at good risk/reward levels for a further correction lower.
Preferred trade is to sell into rallies.
We look for a temporary move higher. Although the anticipated move lower is corrective, it does offer ample risk/reward today.
We look to Sell at 1.1505 (stop at 1.1545)
Our profit targets will be 1.1405 and 1.1385
Resistance: 1.1580 / 1.1675 / 1.1820
Support: 1.1370 / 1.1300 / 1.1155
Risk Disclaimer
The trade ideas beyond this page are for informational purposes only and do not constitute investment advice or a solicitation to trade. This information is provided by Signal Centre, a third-party unaffiliated with OANDA, and is intended for general circulation only. OANDA does not guarantee the accuracy of this information and assumes no responsibilities for the information provided by the third party. The information does not take into account the specific investment objectives, financial situation, or particular needs of any particular person. You should take into account your specific investment objectives, financial situation, and particular needs before making a commitment to trade, including seeking advice from an independent financial adviser regarding the suitability of the investment, under a separate engagement, as you deem fit.
You accept that you assume all risks in independently viewing the contents and selecting a chosen strategy.
Where the research is distributed in Singapore to a person who is not an Accredited Investor, Expert Investor or an Institutional Investor, Oanda Asia Pacific Pte Ltd (“OAP“) accepts legal responsibility for the contents of the report to such persons only to the extent required by law. Singapore customers should contact OAP at 6579 8289 for matters arising from, or in connection with, the information/research distributed.

Falling towards 38.2% Fibonacci retracement support?NZD/CHF is falling towards the support level which is an overlap support that aligns with the 38.2% Fibonacci retracement and could potentially bounce from this level to our take profit.
Entry: 0.53942
Why we like it:
There is an overlap support level which aligns with the 38.2% Fibonacci retracement.
Stop loss: 0.53448
Why we like it:
There is a pullback support level which aligns with the 61.8% Fibonacci retracement.
Take profit: 0.54482
Why we like it:
There is a pullback resistance level
Please be advised that the information presented on TradingView is provided to Vantage (‘Vantage Global Limited’, ‘we’) by a third-party provider (‘Everest Fortune Group’). Please be reminded that you are solely responsible for the trading decisions on your account. There is a very high degree of risk involved in trading. Any information and/or content is intended entirely for research, educational and informational purposes only and does not constitute investment or consultation advice or investment strategy. The information is not tailored to the investment needs of any specific person and therefore does not involve a consideration of any of the investment objectives, financial situation or needs of any viewer that may receive it. Kindly also note that past performance is not a reliable indicator of future results. Actual results may differ materially from those anticipated in forward-looking or past performance statements. We assume no liability as to the accuracy or completeness of any of the information and/or content provided herein and the Company cannot be held responsible for any omission, mistake nor for any loss or damage including without limitation to any loss of profit which may arise from reliance on any information supplied by Everest Fortune Group.

GBPCHF - Detailed Video Analysis Around Resistance📈📉Hello TradingView Family / Fellow Traders. This is Richard, also known as theSignalyst.
📚 As long as the resistance holds, we will be looking for sell setups on 1H.
📚Always follow your trading plan regarding entry, risk management, and trade management.
Good Luck!.
All Strategies Are Good; If Managed Properly!
~Rich

Falling towards 61.8% Fibonacci retracement support?USD/CHF is falling towards a support level which is an overlap support that aligns with the 61.8% Fibonacci retracement and could bounce from this level to our take profit.
Entry: 0.90750
Why we like it:
There is an overlap support level which aligns with the 61.8% Fibonacci retracement.
Stop loss: 0.90137
Why we like it:
There is a pullback support level
Take profit: 0.91511
Why we like it:
There is a pullback resistance level
Please be advised that the information presented on TradingView is provided to Vantage (‘Vantage Global Limited’, ‘we’) by a third-party provider (‘Everest Fortune Group’). Please be reminded that you are solely responsible for the trading decisions on your account. There is a very high degree of risk involved in trading. Any information and/or content is intended entirely for research, educational and informational purposes only and does not constitute investment or consultation advice or investment strategy. The information is not tailored to the investment needs of any specific person and therefore does not involve a consideration of any of the investment objectives, financial situation or needs of any viewer that may receive it. Kindly also note that past performance is not a reliable indicator of future results. Actual results may differ materially from those anticipated in forward-looking or past performance statements. We assume no liability as to the accuracy or completeness of any of the information and/or content provided herein and the Company cannot be held responsible for any omission, mistake nor for any loss or damage including without limitation to any loss of profit which may arise from reliance on any information supplied by Everest Fortune Group.

GBPCHF Breakout and Potential retraceHey Traders, in tomorrow's trading session we are monitoring GBPCHF for a selling opportunity around 1.15100 zone, GBPCHF was trading in an uptrend and successfully managed to break it out. Currently is in a correction phase in which it is approaching the retrace area at 1.15100 support and resistance zone.
Trade safe, Joe.

Could price bounce from here?GBP/CHF is falling towards the support level which is a pullback support that aligns with the 23.6% Fibonacci retracement and could bounce from this level to our take profit.
Entry: 1.13646
Why we like it:
There is a pullback support level which aligns with the 23.6% Fibonacci retracement.
Stop loss: 1.12950
Why we like it:
There is a support level which aligns with the 50% Fibonacci retracement.
Take profit: 1.14820
Why we like it:
There is a pullback resistance level
Please be advised that the information presented on TradingView is provided to Vantage (‘Vantage Global Limited’, ‘we’) by a third-party provider (‘Everest Fortune Group’). Please be reminded that you are solely responsible for the trading decisions on your account. There is a very high degree of risk involved in trading. Any information and/or content is intended entirely for research, educational and informational purposes only and does not constitute investment or consultation advice or investment strategy. The information is not tailored to the investment needs of any specific person and therefore does not involve a consideration of any of the investment objectives, financial situation or needs of any viewer that may receive it. Kindly also note that past performance is not a reliable indicator of future results. Actual results may differ materially from those anticipated in forward-looking or past performance statements. We assume no liability as to the accuracy or completeness of any of the information and/or content provided herein and the Company cannot be held responsible for any omission, mistake nor for any loss or damage including without limitation to any loss of profit which may arise from reliance on any information supplied by Everest Fortune Group.

Could EUR/CHF reverse from here?Price is rising towards a resistance level which is an overlap resistance that aligns with the 88.6% Fibonacci retracement and could reverse from this level to our take profit.
Entry: 0.98001
Why we like it:
There is an overlap resistance level which aligns with the 88.6% Fibonacci retracement.
Stop loss: 0.98458
Why we like it:
There is a pullback resistance level
Take profit: 0.97394
Why we like it:
There is an overlap support level which aligns with the 23.6% Fibonacci retracement.
Please be advised that the information presented on TradingView is provided to Vantage (‘Vantage Global Limited’, ‘we’) by a third-party provider (‘Everest Fortune Group’). Please be reminded that you are solely responsible for the trading decisions on your account. There is a very high degree of risk involved in trading. Any information and/or content is intended entirely for research, educational and informational purposes only and does not constitute investment or consultation advice or investment strategy. The information is not tailored to the investment needs of any specific person and therefore does not involve a consideration of any of the investment objectives, financial situation or needs of any viewer that may receive it. Kindly also note that past performance is not a reliable indicator of future results. Actual results may differ materially from those anticipated in forward-looking or past performance statements. We assume no liability as to the accuracy or completeness of any of the information and/or content provided herein and the Company cannot be held responsible for any omission, mistake nor for any loss or damage including without limitation to any loss of profit which may arise from reliance on any information supplied by Everest Fortune Group.

AUDCHF: Strong bounce inside this Megaphone.AUDCHF is bullish on its 1D technical outlook (RSI = 60.496, MACD = 0.002, ADX = 32.323) after a strong bounce and closing above the 1D MA500. The dominant Bullish Megaphone pattern made its previous HH on the 2.0 Fib extension and a new 1D MACD Bullish Cross has validated that it now sets course for the new HH. We target again the 2.0 Fib (TP = 0.61550) which is just under the R1 level.
## If you like our free content follow our profile to get more daily ideas. ##
## Comments and likes are greatly appreciated. ##

AUDCHF SHORT Audchf has rejected from a prominent resistance zone and has a hourly bearish divergence. Trade can be taken from the break of the LH

CADCHF: Important ZonesTraders,
D:
4h:
Our strategy for this pair involves positioning our orders strategically below the liquidity hunt.
By placing our orders in this manner, we aim to capitalize on potential market movements following the liquidity hunt, maximizing our chances of entering favorable positions.
As we await the release of Canadian Retail Sales data, it's crucial to remain mindful of its potential impact on market direction.
Should there be any notable surprises in the Retail Sales month-over-month figures, it could prompt shifts in market sentiment. Particularly, figures below -0.2% may pose risks to the current trend, while numbers exceeding 0.3% could warrant reassessment of our current zones.
Stay informed and prepared to adjust your trading strategy accordingly based on the outcome of the data release.
Best regards,

Sell CHFJPY Channel BreakoutThe CHF/JPY pair on the M30 timeframe presents a potential shorting opportunity due to a recent downward breakout from a well-defined channel pattern.
Potential Short Trade :
Entry: Consider entering a short position (selling) below the broken support line of the channel after confirmation. Ideally, this would be around 169.90 or lower if the price continues to decline.
Thank you.

GBP/CHF potential bearish reversalThe price is rising toward a resistance level, which is an overlap resistance that aligns with the 50% Fibonacci retracement; it could reverse from this level to our take profit.
Entry: 1.13236
Why we like it:
There is an overlap resistance level which aligns with the 50% Fibonacci retracement.
Stop loss: 1.14028
Why we like it:
There is a pullback resistance level
Take profit: 1.11771
Why we like it:
There is an overlap support level
Please be advised that the information presented on TradingView is provided to Vantage (‘Vantage Global Limited’, ‘we’) by a third-party provider (‘Everest Fortune Group’). Please be reminded that you are solely responsible for the trading decisions on your account. There is a very high degree of risk involved in trading. Any information and/or content is intended entirely for research, educational and informational purposes only and does not constitute investment or consultation advice or investment strategy. The information is not tailored to the investment needs of any specific person and therefore does not involve a consideration of any of the investment objectives, financial situation or needs of any viewer that may receive it. Kindly also note that past performance is not a reliable indicator of future results. Actual results may differ materially from those anticipated in forward-looking or past performance statements. We assume no liability as to the accuracy or completeness of any of the information and/or content provided herein and the Company cannot be held responsible for any omission, mistake nor for any loss or damage including without limitation to any loss of profit which may arise from reliance on any information supplied by Everest Fortune Group.

Could AUDCHF reverse from here?Price is rising towards a resistance level which is an overlap resistance level which aligns with the 50% Fibonacci retracement and could reverse from this level to our take profit.
Entry: 0.58668
Why we like it:
There is an overlap resistance level which aligns with the 50% Fibonacci retracement
Stop loss: 0.59335
Why we like it:
There is a pullback resistance level which aligns with the 78.6% Fibonacci retracement
Take profit: 0.57816
Why we like it:
There is a pullback support level
Please be advised that the information presented on TradingView is provided to Vantage (‘Vantage Global Limited’, ‘we’) by a third-party provider (‘Everest Fortune Group’). Please be reminded that you are solely responsible for the trading decisions on your account. There is a very high degree of risk involved in trading. Any information and/or content is intended entirely for research, educational and informational purposes only and does not constitute investment or consultation advice or investment strategy. The information is not tailored to the investment needs of any specific person and therefore does not involve a consideration of any of the investment objectives, financial situation or needs of any viewer that may receive it. Kindly also note that past performance is not a reliable indicator of future results. Actual results may differ materially from those anticipated in forward-looking or past performance statements. We assume no liability as to the accuracy or completeness of any of the information and/or content provided herein and the Company cannot be held responsible for any omission, mistake nor for any loss or damage including without limitation to any loss of profit which may arise from reliance on any information supplied by Everest Fortune Group.

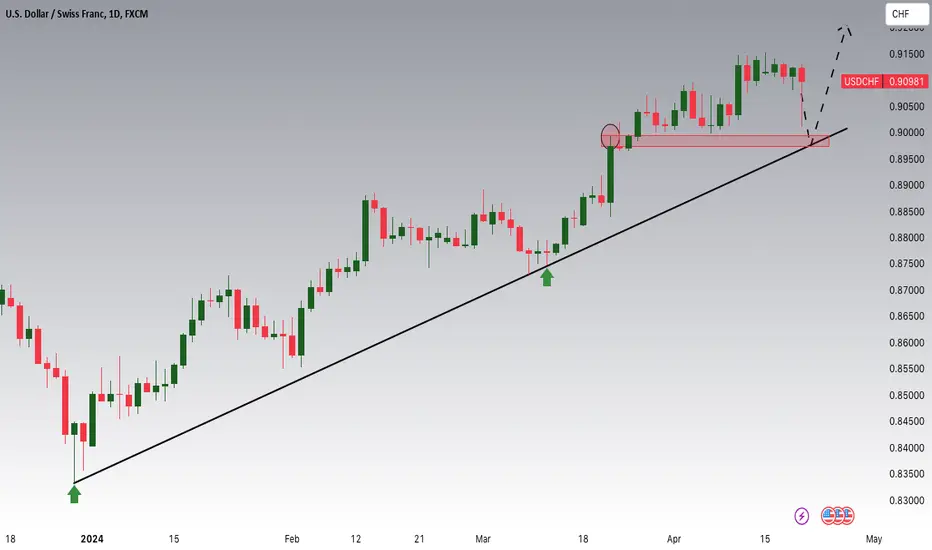
USDCHF Potential UpsidesHey Traders, in the coming week we are monitoring USDCHF for a buying opportunity around 0.90000 zone, USDCHF is trading in an uptrend and currently is in a correction phase in which it is approaching the trend at 0.90000 support and resistance area.
Trade safe, Joe.
Sell USDCHF BreakoutThe USD/CHF pair on the M30 timeframe presents a possible shorting opportunity due to a recent breakout from a pattern.
Potential Short Trade:
Entry: Below the broken level, ideally around 0.9140 after confirmation of the breakout. Confirmation could involve a retest of the broken level as resistance or a sustained move below the level.
Target Levels:
0.9060: This represents a potential initial target based on a measured move approach (distance from the breakout point to the pattern's height).
0.9024: This is a further extension of the downside target.
Stop-Loss: Place a stop-loss order above the broken level, ideally around 0.9155. This helps limit potential losses if the price unexpectedly reverses and breaks back upwards.
Thank you
