Uncharted CADCHF Depths: Bearish Trend Meets Historic Low – DiveHey Traders!
The CADCHF trade is currently in an unprecedented low zone, making it susceptible to sudden bullish surges. While the opportunity seems too promising to pass up, we must tread with caution. The overarching market trend remains bearish, we based our analysis on the long upper shadow and the 4-hour bearish flag pattern. A break in this formation might intensify bearish momentum. However, given that the pair is at its historical low, there's potential for a bullish counter-reaction, particularly with the upcoming CPI news tomorrow. To account for the inherent unpredictability, it's advisable to opt for a reduced lot size.
Chfcad

CADCHF Alert: Bearish Flag Break? Don't Miss Out!Hello Traders,
Exciting potential awaits on the CADCHF pair! Currently, we've spotted a bearish flag pattern forming on the 4h timeframe. A break from this formation will serve as a strong confirmation of continuing bearish momentum.
Another key element to watch out for is the inside bar. A shift past its limit into a new low will underline the dominant bearish pressure in this scenario.
Importantly, this analysis is also supported by the overall market direction which is decisively bearish.
Furthermore, recent news has played a role in shaping this setup. The US Dollar has shown a slight weakening trend following a mixed July jobs report, and the Canadian employment change for July registered a decrease of 6.4K jobs. This gives additional context to our bearish outlook for CADCHF.
As always, let's stay observant, manage risk wisely, and capitalize on these developments!

⚠️CADCHF crash by Head and Shoulders Pattern⚠️CADCHF managed to form a Head and Shoulders pattern after breaking the uptrend line.
Also, CADCHF managed to break the neckline and 🟢 support zone(0.673CHF-0.672CHF) 🟢 in the past hours.
🔔I expect CADCHF to decline at least until the next 🟢 support zone(0.664CHF-0.661CHF) 🟢.
🔅Canadian Dollar/Swiss Franc Analyze ( CADCHF) 4-hour time frame ⏰.
Do not forget to put Stop loss for your positions (For every position you want to open).
Please follow your strategy, this is just my idea, and I will be glad to see your ideas in this post.
Please do not forget the ✅' like '✅ button 🙏😊 & Share it with your friends; thanks, and Trade safe.

CADCHF goes up after the downtrend line breaks🚀CADCHF managed to break the downtrend line.
Also, Regular Divergence(RD+) can be seen between two successive valleys.
I expect CADCHF to grow to at least the 🔴resistance zone( 0.6808 CHF-0.67720 CHF)🔴 after the pullback to the downtrend line.
🔅Canadian Dollar/Swiss Franc Analyze (CADCHF), 8-hour time frame ⏰.
Do not forget to put Stop loss for your positions (For every position you want to open).
Please follow your strategy, this is just my idea, and I will gladly see your ideas in this post.
Please do not forget the ✅' like '✅ button 🙏😊 & Share it with your friends; thanks, and Trade safe.

CHF/JPY 17/04/2023 dear traders as we see chf/jpy was stronger and the market must correct this move and follow my instraction and wish you the best of luck
trade safe

CHF/CAD :: Start a new process .CHF/CAD :::
The price is in an ascending channel and After hitting the ceiling of the channel, lower price floors are being formed than before, that's why we can expect the downward trend to continue until the strongest support .
In higher time frames, the trend changes in the same way.
<<< Good luck >>>

CHFCAD/what do you think guys ?Hi guys
If you like our analysis, please support us .
As you can see in the daily chart , the price was able to form an upward trend , and according to the range it is in now , if it succeeds in breaking it,
It is likely to move to the resistance shown by the blue line.
Thank you for your time.
good luck

💵Canadian Dollar/Swiss Franc 💵(Short term,11/01/2022)!!!Canadian Dollar/Swiss Franc was able to break the Trend lines and now is pulling back to them.
The structure of the pullback is a Rising wedge pattern.
Canadian Dollar/Swiss Franc bounced back from the upper line of the Rising wedge with the Bearish Engulfing candlestick pattern.
I expect the Canadian Dollar/Swiss Franc will go down at least until the support zone.
🔅Canadian Dollar/ Swiss Franc ( CADCHF ) Timeframe 8H⏰.
Do not forget to put Stop loss for your positions (For every position you want to open).
Please follow your strategy, this is just my idea, and I will be glad to see your ideas in this post.
Please do not forget the ✅' like '✅ button 🙏😊 & Share it with your friends; thanks, and Trade safe.

CHF/CAD FOR POSITION TRADINGHello traders. This is the CHF/CAD monthly chart. I just want to show you a potential opportunity in which long-term traders can, perhaps, establish long-term short positions. As you can see in the chart, the pair has been on an upward trend since 2007 and we can draw an upward trend line connecting exactly three touches. But the price has broken the trend line and the price is in a short-term downward trend. But be careful, we still don’t have a confirmed downward trend on the monthly chart. To confirm the downward trend on the monthly chart, we need to wait for the price to make a minimum of two lower highs and two lower lows. The first sign would be if the price breaks the most recent low of 1.2600. In that case, we would get the first lower low and more confidence regarding the bear’s long-term outlook. Of course, after that we have to wait for another lower high and lower low for confirmation and if we get this we can establish a short position. But keep in mind that this would be position trading, and in that case your stop loss would be far away, so this may not be appropriate for scalpers and day traders. Also, the realization of this scenario could take months, but it is worth monitoring. And one more thing, just because the trend line is broken doesn’t mean you should sell right now; if the higher low at 1.26 isn’t broken, we’re still in a long-term uptrend on this pair, but in a retracement mode (or sideways consolidation).
Trade safe,
Merjem

CAD/CHFElliotte wave pattern CAD/CHF buy 0.77000 and identify the next high probability trading (A1 Edge)

CADCHF - Technical and Seasonal Swing Trade Seasonal Screener: Buy signal for $CADCHF
#CADCHF shows a bullish seasonal pattern between 29th Dec – 06th Jan. Historically CAD/CHF was up 13 out of last 15 years (Hitrate: 86%). With an average return of 1.29 % for that period.

CHFCAD Long As we can see, the pair broke from a minor descending channel on the 4 Hour time frame, technically indicators showing we can expect higher bullish continuation.
The next resistance level 1.3762 and 1.3893
Please use proper risk management depending on your account size, Use lot sizes based on these calculations.
Here is a break down of your pip value in ZAR and Dollars
0, 01 = R1,43 / $0,10c
0. 05 = R 7,15 / $ 0.50
0.10 = R 14,3 / $1.00
1 Lot size = R 14,26
How to calculate Margin = (Lot Size * Contract Size)/Leverage, Lets say your broker gives you 1:500, and you open 0,2 size, How much are you exposing ? calculations : (0.2 * 10 000) / 500 = $4 (R58)
Remember, These are long term trades, It is advisable to have enough margin to handle the fluctuation of the markets.
Please like and share for more useful content:


CAD/CHF: BREAK TRENDLINE , WAITING PULLBACK FOR SELL SETUP 🔔🔔Welcome back Traders, Investors, and Community!
If you LIKE this analysis, Please support our page by hitting the LIKE 👍 button
Feel free to request any pair/instrument analysis or ask any questions in the comment section below.
Good trading at everyone!

CHFCAD into buying zone CHF CAD - Ready for bounce back CHFCAD into buying zone CHF CAD - Ready for bounce back , keep accumulating

REAL CHFCAD Bought 50,000 @ 1.347220 18-Mar-2021 7:13:33 PM (EDTDate / Time 18-Mar-2021 7:13:33 PM (EDT)
Type Market Order
Order# O4-8N-4N6F7N
Product CHF/CAD
Details Bought 50,000 @ 1.347220
Stop Loss 1.3365
Take Profit 1.363
LOve this trade based only on the fact of the higher low last candle.


CHFCAD Short Opportunity!Descending triangle almost confirmed, good entry could be the next bearish candle below the horizontal support as it confirms the pattern is complete.
I would expect the resulting downtrend to continue until the 1.40 support level.
Let me know what you think!

CHF/CAD Seems To Start ReversalCHF/CAD Just tested the previous support level and seems to start a reversal. But if that area of support will break then it will keep falling. For now we just need to wait.


USDCHF LONGAnalysis team placed long on USDCHF @0.9822 with 2 targets on 29th August, 2019:
TP1 @0.9891
TP2 @1.0013

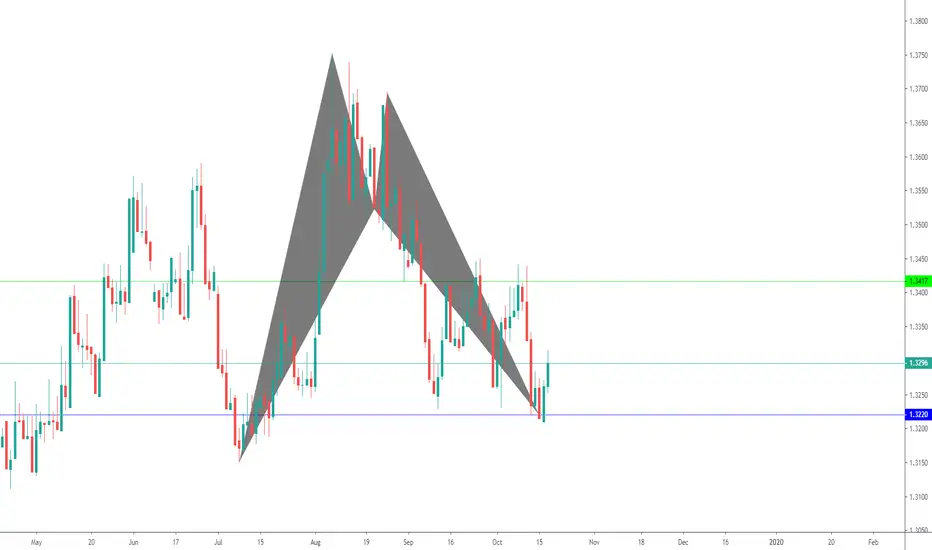
CHF/CAD BUY SETUP WE GOT HERE A NICE POTENTIAL BUY SETUP.
IF WE MANAGE TO CLOSE TODAY ABOVE 1.3220,WHAT I BELIEVE WE WILL,
WE CAN BE LOOKING AT THIS NICE LONG OPPORTUNITY.
YOU CAN TAKE THE GREEN ZONES AS TAKE PROFIT AREAS,
MANAGING YOUR RISK AND LOOKING HOW PROCE REACTS AT THIS AREAS.
