"CHF/JPY Bullish Trap? We’re Stealing Profits Anyway!"🔥 Swiss-Yen Bank Heist: Bullish Loot Grab! (CHF/JPY Master Plan) 🔥
🌟 Hi! Hola! Ola! Bonjour! Hallo! Marhaba! 🌟
Attention Money Makers & Market Robbers! 🤑💰💸✈️
Based on the 🔥Thief Trading Style🔥 (technical + fundamental analysis), we’re plotting a bullish heist on the CHF/JPY "Swiss-Yen" Forex Bank. Follow the strategy on the chart—long entry is our golden ticket! Target? The high-risk Red Zone—where police traps, overbought signals, and bearish robbers lurk. But we’re sneaky thieves… and we always get the loot! 🏆💸
📈 Entry: "The vault is wide open!" Swipe bullish gains at any price—the heist is LIVE!
Pro Tip: Place buy limit orders within 15-30 min (swing lows/highs).
🛑 Stop Loss:
Thief-style SL at recent 4H swing low (174.100) (Day/scalping trade)
Adjust based on your risk, lot size, and multiple orders.
🎯 Target: 177.200 (Time to cash out!)
🧲 Scalpers: Eyes here! 👀
Only scalp LONG.
Big money? Charge in! Small budget? Join swing traders and execute the robbery.
Trailing SL = Your money’s bodyguard. 💰
Why CHF/JPY?
Bullish momentum fueled by:
Fundamentals (COT reports, macro trends)
Sentiment + Intermarket analysis (Check our bioo for deep dives! 🔗👉👉👉)
⚠️ Trading Alert: News = Chaos! 📰🗞️🚫
Avoid new trades during major news.
Trailing stops = Profit protector.
💖 Support the Heist!
Smash the Boost Button! 💥
Strengthen our robbery squad. Steal profits daily with the Thief Trading Style! 🏆💪🚀
Stay tuned—another heist drops soon! 🤑🐱👤🤩
Chfjpy!

CHF-JPY Local Long! Buy!
Hello,Traders!
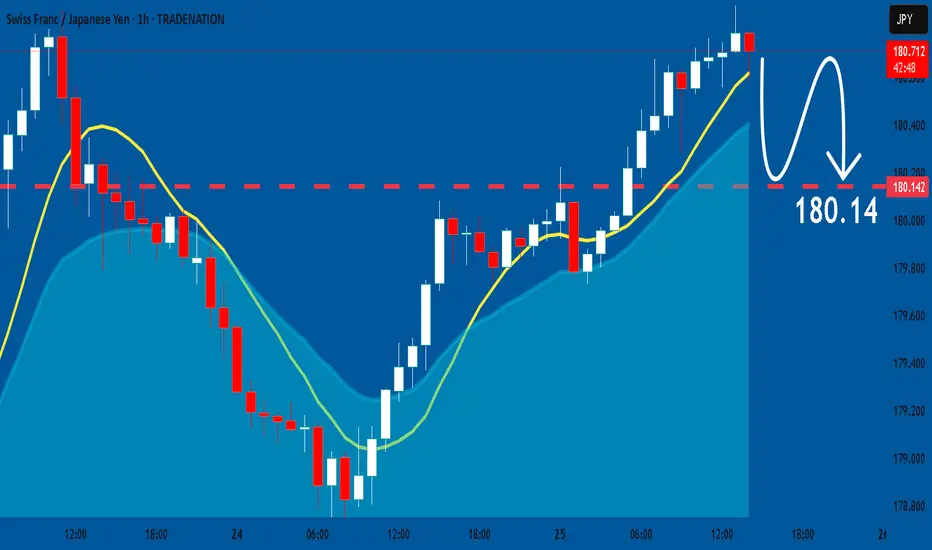
CHF-JPY is trading in a strong
Uptrend and the pair made a
Bullish breakout from the bullish
Triangle pattern and is now seems
To be consolidating above the
Support cluster around 180.740
So we are bullish biased and
We will be expecting a further
Bullish move up on Monday
Buy!
Comment and subscribe to help us grow!
Check out other forecasts below too!
Disclosure: I am part of Trade Nation's Influencer program and receive a monthly fee for using their TradingView charts in my analysis.

CHF_JPY WILL KEEP GROWING|LONG|
CHF_JPY will keep growing
Because the pair is in the uptrend
And recently broke the key level
Of 180.000 then consolidated
For a bit and is now growing
Again so we will be expecting
Bullish continuation
LONG
Like and subscribe to never miss a new idea!

CHFJPY: Massive bullish breakout taking place.CHFJPY is highly overbought on its 1D technical outlook (RSI = 77.325, MACD = 1.496, ADX = 39.317), having crossed above its 1 year High (R1), staging a bullish breakout much like April 28th 2023. This is a direct outcome of the 1D Golden Cross, following also 1 year of accumulation. A 1W closing over the R1 validates a bullish extension to the 2.0 Fibonacci (TP = 194.000).
See how our prior idea has worked out:
## If you like our free content follow our profile to get more daily ideas. ##
## Comments and likes are greatly appreciated. ##


CHFJPY: Bearish Forecast & Bearish Scenario
It is essential that we apply multitimeframe technical analysis and there is no better example of why that is the case than the current CHFJPY chart which, if analyzed properly, clearly points in the downward direction.
Disclosure: I am part of Trade Nation's Influencer program and receive a monthly fee for using their TradingView charts in my analysis.
❤️ Please, support our work with like & comment! ❤️
CHF/JPY BEARS ARE STRONG HERE|SHORT
Hello, Friends!
The BB upper band is nearby so CHF-JPY is in the overbought territory. Thus, despite the uptrend on the 1W timeframe I think that we will see a bearish reaction from the resistance line above and a move down towards the target at around 177.078.
Disclosure: I am part of Trade Nation's Influencer program and receive a monthly fee for using their TradingView charts in my analysis.
✅LIKE AND COMMENT MY IDEAS✅

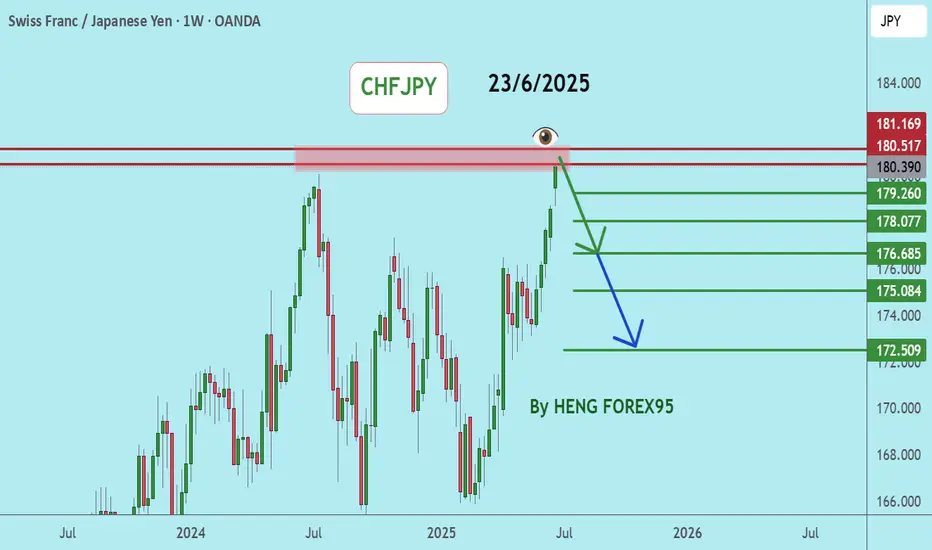
CHFJPY | 23.06.2025SELL 180.400 | STOP 181.100 | TAKE 179.330 | The overbought zone in RSI. The historical high of the price.

CHFJPY is in a Bearish StructureHello Traders
In This Chart CHFJPY HOURLY Forex Forecast By FOREX PLANET
today CHFJPY analysis 👆
🟢This Chart includes_ (CHFJPY market update)
🟢What is The Next Opportunity on CHFJPY Market
🟢how to Enter to the Valid Entry With Assurance Profit
This CHART is For Trader's that Want to Improve Their Technical Analysis Skills and Their Trading By Understanding How To Analyze The Market Using Multiple Timeframes and Understanding The Bigger Picture on the Charts
#CHFJPY: Next Target 180 or Beyond! Get ReadyCHFJPY is extremely bullish this week. The price has risen above 175 as of today, primarily due to the strong USD economic data and the BOJ’s decision not to change interest rates. We anticipate a steady bullish move.
Good luck and trade safely!
Thank you for your unwavering support! 😊
If you’d like to contribute, here are a few ways you can help us:
- Like our ideas
- Comment on our ideas
- Share our ideas
Team Setupsfx_
❤️🚀

#CHFJPY: Last Idea +200 pips, Another 500+ Remanning Hey there!
Our CHFJPY trade is going swimmingly, with a +200 pips move already under our belt. We’re expecting the price to keep climbing and potentially reach 185 or more. Feel free to set your own take profit and stop loss based on your own trading strategy. We’re just sharing this exciting opportunity with you.
Good luck and happy trading! 😊
We really appreciate your unwavering support! ❤️🚀
If you’d like to lend a hand, here are a few ways you can contribute:
- Like our ideas
- Comment on our ideas
- Share our ideas
Cheers,
Team Setupsfx_

CHFJPYCHFJPY price has a chance to adjust to 180.517-181.169 level. If the price cannot break through 181.169 level, it is expected that the price will drop. Consider selling in the red zone.
🔥Trading futures, forex, CFDs and stocks carries a risk of loss.
Please consider carefully whether such trading is suitable for you.
>>GooD Luck 😊
❤️ Like and subscribe to never miss a new idea!
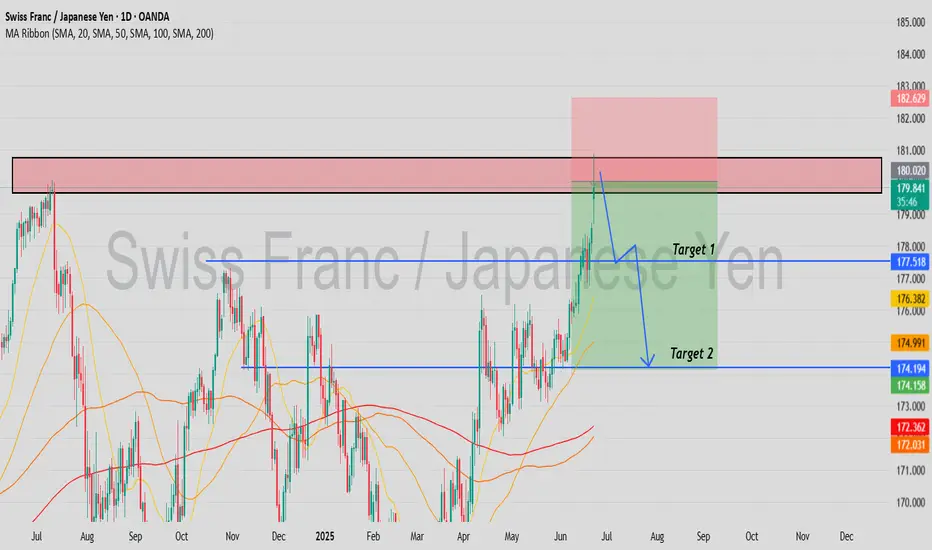
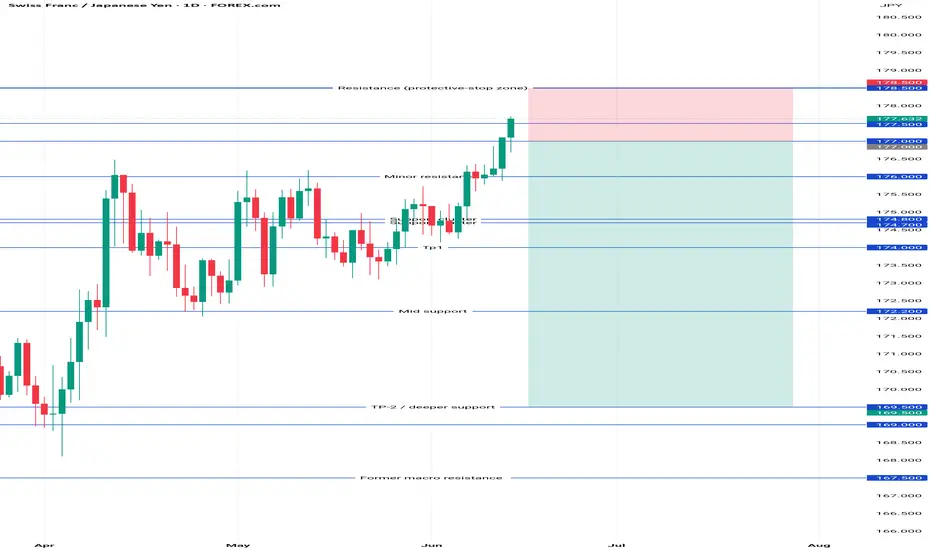
CHF/JPY SellCHF/JPY Pull-back Short (set-and-forget)
Condition to place order:
Wait for a daily candle to close below 177.50.
Then enter the order:
• Sell Limit 177.00
• Stop Loss 178.50
• Take Profit 1 174.50
• Take Profit 2 169.50
• Expiry: cancel if not filled after 5 trading days.
CHFJPY Selling bias!Hello guys, This is what i gonna follow for the incoming days!
TRADING IS RISKY SO FOLLOW YOUR RISK CAPACITY.

CHFJPY Update I Short from Supply Zone Fulfilled Welcome back! Let me know your thoughts in the comments!
** CHFJPY Analysis - Listen to video!
We recommend that you keep this pair on your watchlist and enter when the entry criteria of your strategy is met.
Please support this idea with a LIKE and COMMENT if you find it useful and Click "Follow" on our profile if you'd like these trade ideas delivered straight to your email in the future.
Thanks for your continued support!Welcome back! Let me know your thoughts in the comments!

CHFJPY - Bullish... but not for long!Hello TradingView Family / Fellow Traders. This is Richard, also known as theSignalyst.
📈CHFJPY has been overall bullish trading within the rising channel marked in blue. However, it is currently retesting the upper bound of the channel.
Moreover, the red zone is a strong structure and resistance.
🏹 Thus, the highlighted red circle is a strong area to look for sell setups as it is the intersection of the upper blue trendline and resistance.
📚 As per my trading style:
As #CHFJPY is around the red circle zone, I will be looking for bearish reversal setups (like a double top pattern, trendline break , and so on...)
📚 Always follow your trading plan regarding entry, risk management, and trade management.
Good luck!
All Strategies Are Good; If Managed Properly!
~Rich
Disclosure: I am part of Trade Nation's Influencer program and receive a monthly fee for using their TradingView charts in my analysis.

CHFJPY: Bullish Continuation
The recent price action on the CHFJPY pair was keeping me on the fence, however, my bias is slowly but surely changing into the bullish one and I think we will see the price go up.
Disclosure: I am part of Trade Nation's Influencer program and receive a monthly fee for using their TradingView charts in my analysis.
❤️ Please, support our work with like & comment! ❤️

CHF/JPY Approaching the Danger Zone🧠 CHF/JPY Daily Chart
🗓️ June 18, 2025
Theme: "Approaching the Danger Zone – Will It Break or Bounce?"
Bias: Cautiously Bearish (near resistance)
Setup: Rising wedge into multi-year resistance zone
🔍 Market Structure Analysis:
The CHF/JPY has been riding a clean bullish wave since early 2025, but the pair now faces its most critical battle zone — the 179.50–180.00 multi-year resistance block, which previously marked a sharp reversal point.
The recent price action shows a rising wedge structure, which is often a bearish reversal pattern, especially when appearing near significant resistance.
🧬 Confluences in Play:
✅ Rising Wedge: Tightening structure indicates exhaustion of bullish momentum.
✅ Major Supply Zone: Price is approaching a high-likelihood reaction zone (180.00), where sellers aggressively took over in the past.
✅ Bearish Divergence Watch: (Not shown but likely developing on RSI or MACD)
✅ EMA Clustering: 15 & 60 EMAs rising, suggesting short-term momentum, but also acting as dynamic support if price breaks lower.
🔁 Scenario-Based Trade Plan:
🟥 Bearish Rejection Setup:
Entry: If price prints a strong bearish engulfing or pin bar near 179.50–180.00
SL: Above 180.20 (liquidity sweep buffer)
TP1: 174.50 (wedge base)
TP2: 172.00 (previous structure support)
TP3: 165.00 (macro demand zone)
R:R Potential: 3–5+
🟩 Breakout Continuation (Contingency Plan):
Buy Stop above 180.50 on strong close + retest
Targeting 184.00+ (measured move from wedge height)
🎯 Key Levels:
Major Resistance: 179.50–180.00
Trendline Support: 174.00
High-Volume Node: 172.00
Major Demand: 165.00–166.00 (long-term)
⚠️ Risks & Considerations:
JPY volatility due to BoJ surprises
CHF is sensitive to risk sentiment → geopolitical/macro shifts can rapidly flip bias
Wedge can fakeout before true move — confirm with volume + daily close
🧵 Summary Thought:
"Price is climbing a narrowing staircase into a wall. Will it punch through or trip on fatigue? Either way — the move from here is likely to be decisive. This is not the time to blink."
Share your Idea please...
#CHFJPY #MJTrading #Chart #Analysis #CHF #JPY

EUR/JPY, GBP/JPY, CAD/JPY, CHF/JPY Price Action SetupsWith the conclusion of the FOMC meeting just hours away, I wanted to move away from the US dollar and look at some crosses. Here are some interesting setups on yen pairs to keep in mind.
Matt Simpson, Market Analyst at City Index and Forex.com

Time To SELL CHFJPY?? 3000 Pips Potential Move On The CardsIn Today's Video I break down the CHFJPY let me know what you think in the comments.

CHFJPY Daily Analysis – Potential Rounded Top Reversal🧠 Key Insights:
Price is approaching strong resistance near 180.355, aligning with historical highs.
A rounded top formation is visible, signaling potential bearish reversal.
A break above 180.355 would invalidate the bearish setup (marked “Invalid” on chart).
---
🔻 Bearish Scenario:
If rejection occurs at resistance:
✅ TP1: 170.145
↪ Horizontal support; prior consolidation zone.
✅ TP2: 160.352
↪ Major demand area; long-term support.
Entry can be considered on confirmation signals (e.g. bearish engulfing, divergence, or rejection wicks).
---
❌ Invalidation:
A daily candle close above 180.355 invalidates this setup and may signal continued bullish momentum.
---
✅ Summary:
CHFJPY is at a key resistance zone and showing signs of a possible top. If bearish confirmation forms, targets lie at 170.145 and 160.352. Use proper risk management and wait for confirmation before entering.
---
⚠️ Disclaimer:
This analysis is for educational purposes only and does not constitute financial advice. Always conduct your own research and consult with a licensed financial advisor before making any trading decisions.

CHF-JPY Will Keep Growing! Buy!
Hello,Traders!
CHF-JPY made a bullish
Breakout of the key horizontal
Level of 177.327 and the
Breakout is confirmed so
We are bullish biased
And we will be expecting
A further bullish continuation
Buy!
Comment and subscribe to help us grow!
Check out other forecasts below too!
Disclosure: I am part of Trade Nation's Influencer program and receive a monthly fee for using their TradingView charts in my analysis.

CHFJPY Will Go Higher! Buy!
Here is our detailed technical review for CHFJPY.
Time Frame: 6h
Current Trend: Bullish
Sentiment: Oversold (based on 7-period RSI)
Forecast: Bullish
The market is trading around a solid horizontal structure 177.661.
The above observations make me that the market will inevitably achieve 178.547 level.
P.S
We determine oversold/overbought condition with RSI indicator.
When it drops below 30 - the market is considered to be oversold.
When it bounces above 70 - the market is considered to be overbought.
Disclosure: I am part of Trade Nation's Influencer program and receive a monthly fee for using their TradingView charts in my analysis.
Like and subscribe and comment my ideas if you enjoy them!
