Chfjpybuy

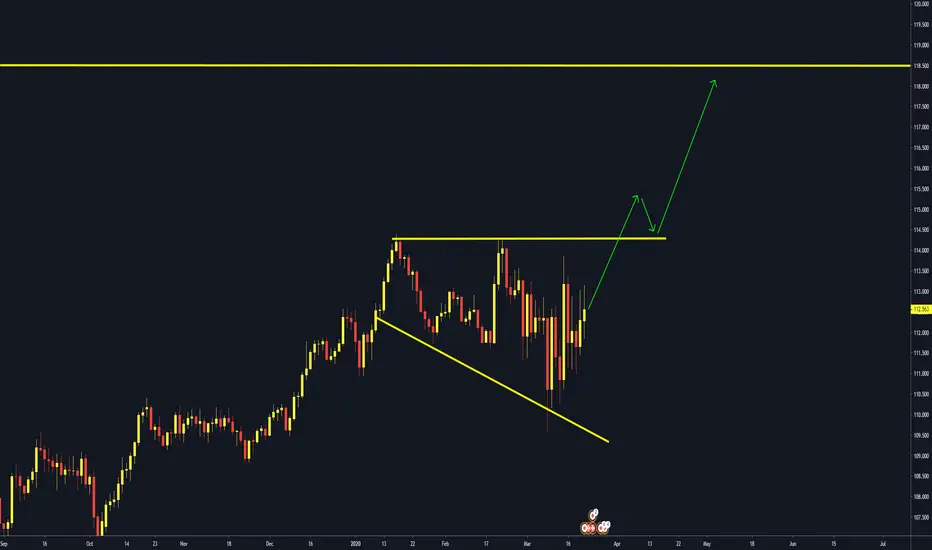
CHFJPY ANALYSISCHFJPY has tested the daily demand zone. Since then it has been in a uptrend and has still a lot of space to move up. It seems to be very near of breaking the uptrend so we stay patient to see the next move.


CHFJPY potential reversal!
CHFJPY expected to rise up to 1st resistance at 112.599 where it could potentially react off and drop down to 1st support at 110.909.
Trading CFDs on margin carries high risk.
Losses can exceed the initial investment so please ensure you fully
understand the risks.

SWISS FRANC / JAPANESE YEN (CHFJPY) DailyDates in the future with the greatest probability for a price high or price low.
The Djinn Predictive Indicators are simple mathematical equations. Once an equation is given to Siri the algorithm provides the future price swing date. Djinn Indicators work on all charts, for any asset category and in all time frames. Occasionally a Djinn Predictive Indicator will miss its prediction date by one candlestick. If multiple Djinn prediction dates are missed and are plowed through by same color Henikin Ashi candles the asset is being "reset". The "reset" is complete when Henikin Ashi candles are back in sync with Djinn price high or low prediction dates.
One way the Djinn Indicator is used to enter and exit trades:
For best results trade in the direction of the trend.
The Linear Regression channel is used to determine trend direction. The Linear Regression is set at 2 -2 30.
When a green Henikin Ashi candle intersects with the linear regression upper deviation line (green line) and both indicators intersect with a Djinn prediction date a sell is triggered.
When a red Henikin Ashi candle intersects with the linear regression lower deviation line (red line) and both indicators intersect with a Djinn prediction date a buy is triggered.
This trading strategy works on daily, weekly and Monthly Djinn Predictive charts.
This is not trading advice. Trade at your own risk.

SWISS FRANC / JAPANESE YEN (CHFJPY) WeeklyDates in the future with the greatest probability for a price high or price low.
The Djinn Predictive Indicators are simple mathematical equations. Once an equation is given to Siri the algorithm provides the future price swing date. Djinn Indicators work on all charts, for any asset category and in all time frames. Occasionally a Djinn Predictive Indicator will miss its prediction date by one candlestick. If multiple Djinn prediction dates are missed and are plowed through by same color Henikin Ashi candles the asset is being "reset". The "reset" is complete when Henikin Ashi candles are back in sync with Djinn price high or low prediction dates.
One way the Djinn Indicator is used to enter and exit trades:
For best results trade in the direction of the trend.
The Linear Regression channel is used to determine trend direction. The Linear Regression is set at 2 -2 30.
When a green Henikin Ashi candle intersects with the linear regression upper deviation line (green line) and both indicators intersect with a Djinn prediction date a sell is triggered.
When a red Henikin Ashi candle intersects with the linear regression lower deviation line (red line) and both indicators intersect with a Djinn prediction date a buy is triggered.
This trading strategy works on daily, weekly and Monthly Djinn Predictive charts.
This is not trading advice. Trade at your own risk.

CHFJPY potential reversal!
CHFJPY expected to rise up to 1st resistance at 112.479 where it could potentially react off and drop down to 1st support at 111.401.
Trading CFDs on margin carries high risk.
Losses can exceed the initial investment so please ensure you fully
understand the risks.

CHFJPY--Weekly Market Outlook from 06 to 10 April 2020Follow me for more update and Analysis.
What You Get:
- Weekly Market Analysis using my strategy.
- Results of our tried, tested and proven Strategies
- Latest and greatest news and content from the Forex World
Never Trade alone
we really hope you enjoy the All analysis
thank you

CHFJPY: Broadening formation Pattern. Thanks for Taking Interested in my Trading Idea.
CHFJPY: Broadening formation Pattern.
Note: This is only for Educational purposes; this is not investment advice.
Thanks for your support!
CHFJPY Sets To Resume Another RallyCHFJPY has just completed a 5-3 "impulse-correction" Elliot wave cycle.
The corrective structure was complex and erratic due to the last few weeks of volatility.
However, the price seems to make a triple zigzag pattern and rejected 61.8% Fibonacci level that lined up with the weekly support zone.
Price has the potential to move higher in five-wave and target above wave A high is plausible in the weeks ahead.
Looking for bullish price action at HL will be a good signal to position in this new bullish trend.
What's your take on CHFJPY?

CHFJPY potential bounce!
CHFJPY expected to reverse up to 1st support at 110.666 where it could potentially react and bounce to its resistance at 1st resistance at 111.645.
Trading CFDs on margin carries high risk.
Losses can exceed the initial investment so please ensure you fully
understand the risks.

CHFJPY potential reversal!CHFJPY expected to rise up to 1st resistance at 111.623 where it could potentially react off and drop down to 1st support at 110.880.
Trading CFDs on margin carries high risk.
Losses can exceed the initial investment so please ensure you fully
understand the risks.

CHFJPY: NEXT SELL AREA IS READY.Thanks for Taking Interested in my Trading Idea.
CHFJPY: NEXT SELL AREA IS READY.
Dear followers, the best Gift for me is "will be your likes , comments & Share
Note: This is only for Educational purposes; this is not investment advice.
Thanks for your support!

CHFJPY potential reversal!
CHFJPY expected to rise up to 1st resistance at 112.440 where it could potentially react off and drop down to 1st support at 112.071.
Trading CFDs on margin carries high risk.
Losses can exceed the initial investment so please ensure you fully
understand the risks.


CHFJPY potential bounce!
CHFJPY expected to reverse up to 1st support at 112.128 where it could potentially react and bounce to its resistance at 1st resistance at 113.018.
Trading CFDs on margin carries high risk.
Losses can exceed the initial investment so please ensure you fully
understand the risks.

CHF/JPY BUYTouch of ascending trendline and break of 0.236 fib level targeting a nice 80 pips here with the possibility for more depending on how fast we get a move!

CHFJPY potential reversal!
CHFJPY expected to rise up to 1st resistance at 113.336 where it could potentially react off and drop down to 1st support at 112.662.
Trading CFDs on margin carries high risk.
Losses can exceed the initial investment so please ensure you fully
understand the risks.

CHFJPY potential reversal!
CHFJPY expected to rise up to 1st resistance at 113.444 where it could potentially react off and drop down to 1st support at 112.959.
Trading CFDs on margin carries high risk.
Losses can exceed the initial investment so please ensure you fully
understand the risks.

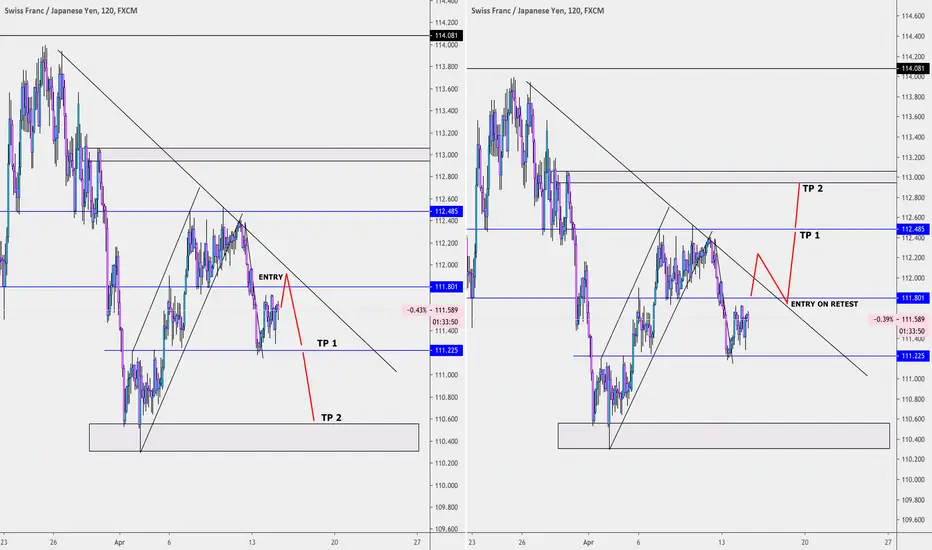
Has CHFJPY bottomed out?Current price action indicates that CHFJPY might have bottomed out and it will resume the uptrend soon.
If the support at 111.80 holds, there's a good chance that CHFJPY might reach the resistance at 113.
