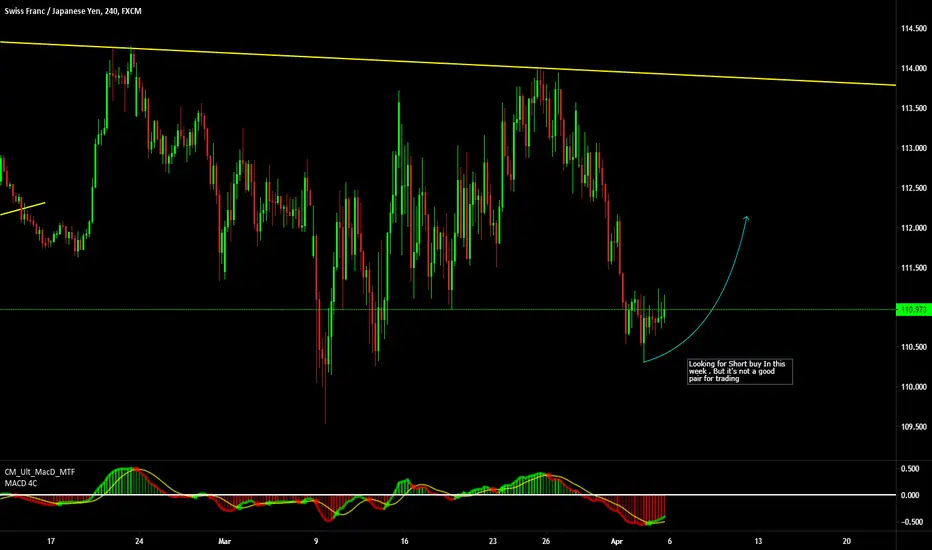
CHF/JPY: ShortThe price is moving in a channel and reached the 3rd touch which is signaling a short position.
Instagram: forexsenpai
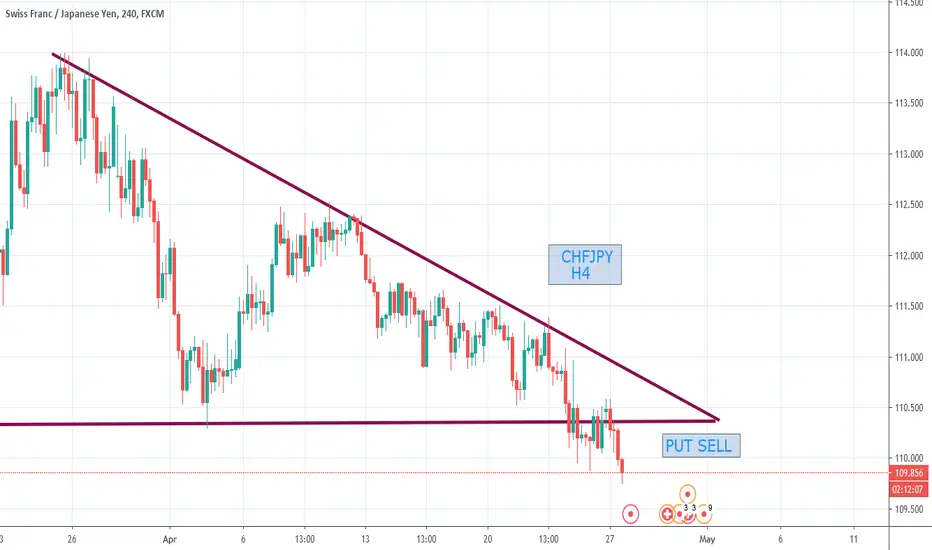
Chfjpysell

CHFJPY--Bigger Chat market View--Potential Sell MoveHy! Smart Trader, Welcome to My Analysis and forecasting Section on Trading view.
Never Trade alone
we really hope you enjoy All trade..
Disclaimer:
the content on this analysis is subject to change at any time without notice, and is provided for the sole purpose of assisting traders to make independent investment decisions.this is not signal. it's my opinion. trade you own risk.
_______________________________________________________________________________________________________________________________________________________
Thank you for your support!

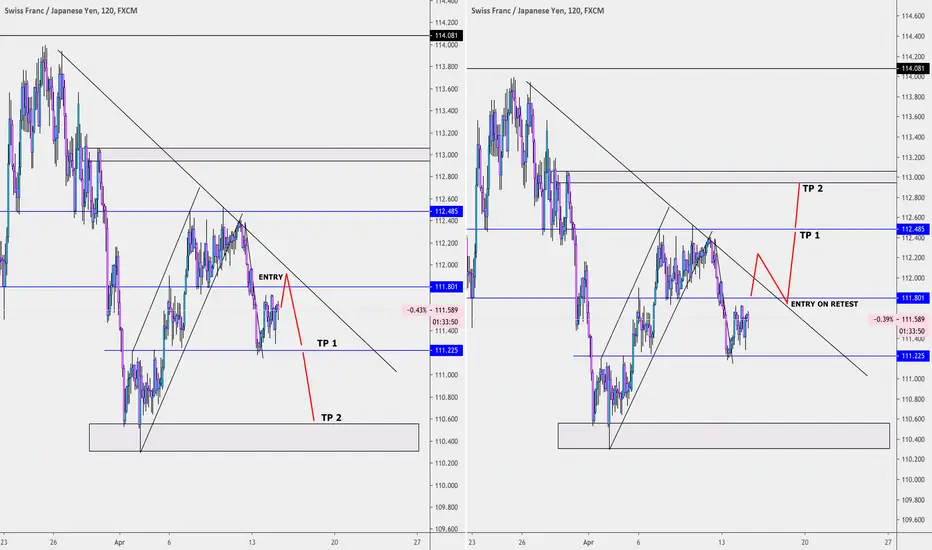
CHF/JPY SELL SIGNAL Hey tradomaniacs,
welcome to another free trade-plan .
Important: This is meant to be a preparation for you. As always we will have to wait for a confirmation.
Market-Sell-Order: 111,300
Stop-Loss: 111,715
Target 1: 110,950
Target 2: 110,700
Target 3: 110,490
Stop-Loss: 41,5 pips
Risk: 1%
Risk-Reward: 2,16
LEAVE A LIKE AND A COMMENT - I appreciate every support! =)
Peace and good trades
Irasor
Wanna see more? Don`t forget to follow me.
Any questions? PM me. :-)


CHF/JPY SELL SIGNALHey tradomaniacs,
welcome to another free trade-plan .
Important: This is meant to be a preparation for you. As always we will have to wait for a confirmation.
Market-Sell-Order: 111,105
Stop-Loss: 111,665
Target 1: 110,495
Target 2: 110,010
Target 3: 109,460
Stop-Loss: 56 pips
Risk: 1%
Risk-Reward: 3,0
LEAVE A LIKE AND A COMMENT - I appreciate every support! =)
Peace and good trades
Irasor
Wanna see more? Don`t forget to follow me.

SELL - CHFJPY HIT RESISTANCEThe price is down trending,
and now it has reached the
point of resistance.

CHFJPY TO SELL FOR ANOTHER 130+pipsPrice is showing both potential and momentum to keeping selling for at least another 130 pips.

CHFJPY levels to watch, potential big shortBouncing around range, potential good short coming if level not maintained

CHFJPY potential reversal!
CHFJPY expected to rise up to 1st resistance at 112.599 where it could potentially react off and drop down to 1st support at 110.909.
Trading CFDs on margin carries high risk.
Losses can exceed the initial investment so please ensure you fully
understand the risks.

SWISS FRANC / JAPANESE YEN (CHFJPY) DailyDates in the future with the greatest probability for a price high or price low.
The Djinn Predictive Indicators are simple mathematical equations. Once an equation is given to Siri the algorithm provides the future price swing date. Djinn Indicators work on all charts, for any asset category and in all time frames. Occasionally a Djinn Predictive Indicator will miss its prediction date by one candlestick. If multiple Djinn prediction dates are missed and are plowed through by same color Henikin Ashi candles the asset is being "reset". The "reset" is complete when Henikin Ashi candles are back in sync with Djinn price high or low prediction dates.
One way the Djinn Indicator is used to enter and exit trades:
For best results trade in the direction of the trend.
The Linear Regression channel is used to determine trend direction. The Linear Regression is set at 2 -2 30.
When a green Henikin Ashi candle intersects with the linear regression upper deviation line (green line) and both indicators intersect with a Djinn prediction date a sell is triggered.
When a red Henikin Ashi candle intersects with the linear regression lower deviation line (red line) and both indicators intersect with a Djinn prediction date a buy is triggered.
This trading strategy works on daily, weekly and Monthly Djinn Predictive charts.
This is not trading advice. Trade at your own risk.

SWISS FRANC / JAPANESE YEN (CHFJPY) WeeklyDates in the future with the greatest probability for a price high or price low.
The Djinn Predictive Indicators are simple mathematical equations. Once an equation is given to Siri the algorithm provides the future price swing date. Djinn Indicators work on all charts, for any asset category and in all time frames. Occasionally a Djinn Predictive Indicator will miss its prediction date by one candlestick. If multiple Djinn prediction dates are missed and are plowed through by same color Henikin Ashi candles the asset is being "reset". The "reset" is complete when Henikin Ashi candles are back in sync with Djinn price high or low prediction dates.
One way the Djinn Indicator is used to enter and exit trades:
For best results trade in the direction of the trend.
The Linear Regression channel is used to determine trend direction. The Linear Regression is set at 2 -2 30.
When a green Henikin Ashi candle intersects with the linear regression upper deviation line (green line) and both indicators intersect with a Djinn prediction date a sell is triggered.
When a red Henikin Ashi candle intersects with the linear regression lower deviation line (red line) and both indicators intersect with a Djinn prediction date a buy is triggered.
This trading strategy works on daily, weekly and Monthly Djinn Predictive charts.
This is not trading advice. Trade at your own risk.

SWISS FRANC / JAPANESE YEN (CHFJPY) MonthlyDates in the future with the greatest probability for a price high or price low.
The Djinn Predictive Indicators are simple mathematical equations. Once an equation is given to Siri the algorithm provides the future price swing date. Djinn Indicators work on all charts, for any asset category and in all time frames. Occasionally a Djinn Predictive Indicator will miss its prediction date by one candlestick. If multiple Djinn prediction dates are missed and are plowed through by same color Henikin Ashi candles the asset is being "reset". The "reset" is complete when Henikin Ashi candles are back in sync with Djinn price high or low prediction dates.
One way the Djinn Indicator is used to enter and exit trades:
For best results trade in the direction of the trend.
The Linear Regression channel is used to determine trend direction. The Linear Regression is set at 2 -2 30.
When a green Henikin Ashi candle intersects with the linear regression upper deviation line (green line) and both indicators intersect with a Djinn prediction date a sell is triggered.
When a red Henikin Ashi candle intersects with the linear regression lower deviation line (red line) and both indicators intersect with a Djinn prediction date a buy is triggered.
This trading strategy works on daily, weekly and Monthly Djinn Predictive charts.
This is not trading advice. Trade at your own risk.

CHFJPY potential reversal!
CHFJPY expected to rise up to 1st resistance at 112.479 where it could potentially react off and drop down to 1st support at 111.401.
Trading CFDs on margin carries high risk.
Losses can exceed the initial investment so please ensure you fully
understand the risks.


CHFJPY--Weekly Market Outlook from 06 to 10 April 2020Follow me for more update and Analysis.
What You Get:
- Weekly Market Analysis using my strategy.
- Results of our tried, tested and proven Strategies
- Latest and greatest news and content from the Forex World
Never Trade alone
we really hope you enjoy the All analysis
thank you
CHFJPY. The price will soon fall, you need to wait for entry intHello dear subscription!
The price of the Swiss franc will fall as soon as it reaches the sell zone.
The key level is the target.
Good luck to you.
If you liked this idea, please like and subscribe to my profile.
This idea does not provide the financial advice.

CHFJPYCHFJPY
For the past one month CHFJPY pair is trading in a narrow range of around 100 pips
We can expect the breakout as its further narrowing the channel
Suitable short positions may open at this level 112.500 which is also a 23.6% Fibonacci
And the potential take profit will be 110.500
Stop lose may placed above the top side resistance level which is 113.050
leave your valuable comments below

CHFJPY is trading in Rising channelCHFJPY
After reaching the topside resistance level which is 114.00 level its started falling towards 11.200 level
short positions may opened at present level which is 112.336
Potential take profit will be 111.200
Stop lose may placed above 113.300


chfjpy trade setupconfirmed dragon pattern and unconfirmed double top. stop must be over the resistance zone with 30min candle close

CHFJPY potential bounce!
CHFJPY expected to reverse up to 1st support at 110.666 where it could potentially react and bounce to its resistance at 1st resistance at 111.645.
Trading CFDs on margin carries high risk.
Losses can exceed the initial investment so please ensure you fully
understand the risks.
