Chfjpy flag pattern breakout CHFJPY make flag pattern and also break flag pattern
now retest the flag pattern breakout line
and possible its going down to expected target
trade with care and happy trading
Asad Ullah
Chfjpysell

CHFJPY Short OpportunitySeems like bulls can't break through this resistance level and has made multiple tops as a result. The bullish momentum from which this came from has been made too intensely and the bulls seem exhausted (or some may already be taking profits at this level) as shown by the decreasing volume.
Several reversal candle signals are visible such as the Bearish Engulfing, Tweezer Tops, and on lower time frames, Dark Cloud Cover.
RSI is showing divergence as well. We wait either for a breakout of the trendlines or breakout of the neckline before entering trades.

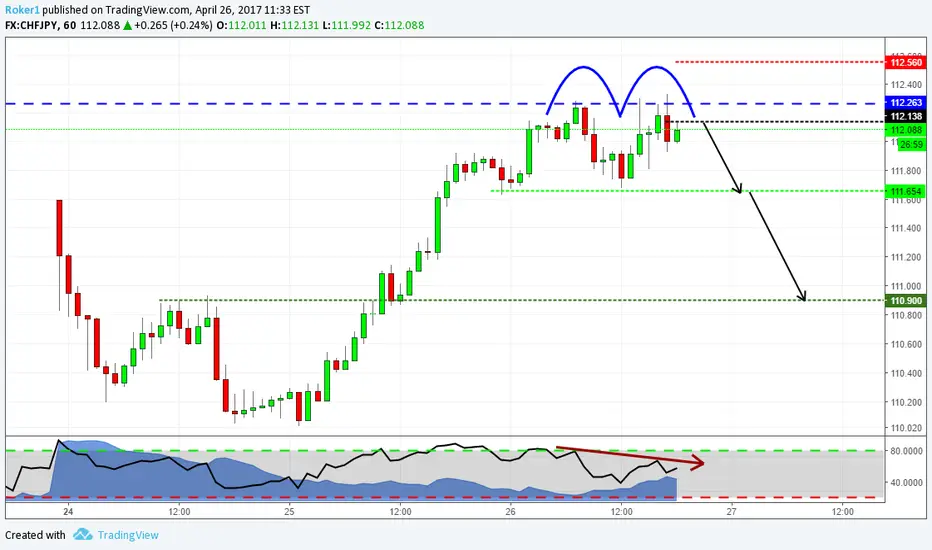
Double Top at Structure!Hi guys,
just to let you know why i'm shorting this pair, price has reached a key structure level (blue line) and here it's formed a nice double top with RSI divergence.
Stops above the highs, target1 and 2 as displayed in the chart.
If you want to ask questions or share your view, comment below.
Otherwise, see you in the next chart!
Double Top at StructureHi guys,
just to let you know why i'm shorting this pair, price has reached a key structure level (blue line) and here it's formed a nice double top with RSI divergence.
Stops above the highs, target1 and 2 as displayed in the chart.
If you want to ask questions or share your view, comment below.
Otherwise, see you in the next chart!


CHFJPY shorterm positionThe market is trading just below a trend line (the centre of the channel) dating back to the 3rd of the month. Momentum has been holding below the .3899 level. A break of the .3899 on momentum and the centre line of the channel on the market price will open up a long position aiming for the 114.20 area.


long CHFJPY @ 60 min @ trading capability for this 51st week `16This is only a trading capability - no recommendation !!!
Next week i`ll confirm or change my opinion about this SetUp :)
Buying/Selling or even only watching is always your own responsibility ...
Best regards
Aaron
