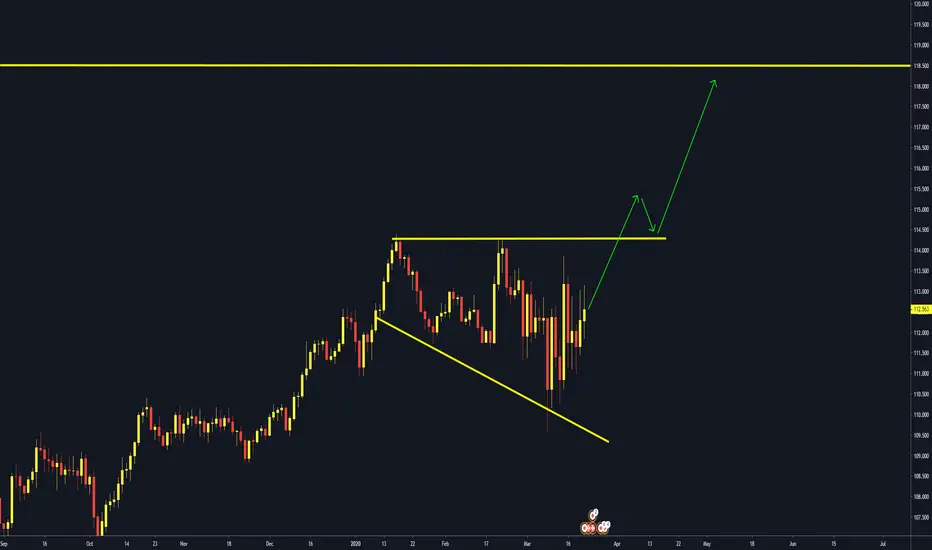
chfjpy trade setupthere is both ascendinf triangle on 4h chart and a bullish butterfly on daily chart. daily closing is important. blue box is the descendind triangle target. I will update the chart (butterfly tp) if it reaches the prz zone.first I open the short position first , the if it reach the blue lines I will look for a long position
Chfjpytrade

SWISS FRANC / JAPANESE YEN (CHFJPY) DailyDates in the future with the greatest probability for a price high or price low.
The Djinn Predictive Indicators are simple mathematical equations. Once an equation is given to Siri the algorithm provides the future price swing date. Djinn Indicators work on all charts, for any asset category and in all time frames. Occasionally a Djinn Predictive Indicator will miss its prediction date by one candlestick. If multiple Djinn prediction dates are missed and are plowed through by same color Henikin Ashi candles the asset is being "reset". The "reset" is complete when Henikin Ashi candles are back in sync with Djinn price high or low prediction dates.
One way the Djinn Indicator is used to enter and exit trades:
For best results trade in the direction of the trend.
The Linear Regression channel is used to determine trend direction. The Linear Regression is set at 2 -2 30.
When a green Henikin Ashi candle intersects with the linear regression upper deviation line (green line) and both indicators intersect with a Djinn prediction date a sell is triggered.
When a red Henikin Ashi candle intersects with the linear regression lower deviation line (red line) and both indicators intersect with a Djinn prediction date a buy is triggered.
This trading strategy works on daily, weekly and Monthly Djinn Predictive charts.
This is not trading advice. Trade at your own risk.

SWISS FRANC / JAPANESE YEN (CHFJPY) WeeklyDates in the future with the greatest probability for a price high or price low.
The Djinn Predictive Indicators are simple mathematical equations. Once an equation is given to Siri the algorithm provides the future price swing date. Djinn Indicators work on all charts, for any asset category and in all time frames. Occasionally a Djinn Predictive Indicator will miss its prediction date by one candlestick. If multiple Djinn prediction dates are missed and are plowed through by same color Henikin Ashi candles the asset is being "reset". The "reset" is complete when Henikin Ashi candles are back in sync with Djinn price high or low prediction dates.
One way the Djinn Indicator is used to enter and exit trades:
For best results trade in the direction of the trend.
The Linear Regression channel is used to determine trend direction. The Linear Regression is set at 2 -2 30.
When a green Henikin Ashi candle intersects with the linear regression upper deviation line (green line) and both indicators intersect with a Djinn prediction date a sell is triggered.
When a red Henikin Ashi candle intersects with the linear regression lower deviation line (red line) and both indicators intersect with a Djinn prediction date a buy is triggered.
This trading strategy works on daily, weekly and Monthly Djinn Predictive charts.
This is not trading advice. Trade at your own risk.

CHFJPY--Weekly Market Outlook from 06 to 10 April 2020Follow me for more update and Analysis.
What You Get:
- Weekly Market Analysis using my strategy.
- Results of our tried, tested and proven Strategies
- Latest and greatest news and content from the Forex World
Never Trade alone
we really hope you enjoy the All analysis
thank you
CHFJPY: Broadening formation Pattern. Thanks for Taking Interested in my Trading Idea.
CHFJPY: Broadening formation Pattern.
Note: This is only for Educational purposes; this is not investment advice.
Thanks for your support!
CHFJPYCHFJPY
For the past one month CHFJPY pair is trading in a narrow range of around 100 pips
We can expect the breakout as its further narrowing the channel
Suitable short positions may open at this level 112.500 which is also a 23.6% Fibonacci
And the potential take profit will be 110.500
Stop lose may placed above the top side resistance level which is 113.050
leave your valuable comments below

CHFJPY is trading in Rising channelCHFJPY
After reaching the topside resistance level which is 114.00 level its started falling towards 11.200 level
short positions may opened at present level which is 112.336
Potential take profit will be 111.200
Stop lose may placed above 113.300

CHFJPY: NEXT SELL AREA IS READY.Thanks for Taking Interested in my Trading Idea.
CHFJPY: NEXT SELL AREA IS READY.
Dear followers, the best Gift for me is "will be your likes , comments & Share
Note: This is only for Educational purposes; this is not investment advice.
Thanks for your support!

CHFJPY LONG This pair is currently having a retracement. So I will be looking to enter longs around the 112.000 levels if we see candle wick rejection on the 4hr time frame.
Take partial profits!
200 PIP GAIN 6/1 RR

CHFJPY SHORT quick 100 pips here, looking for another touch of the triple box for price to reject the 50 EMA, descending trend line as well as past structure to take a short here.
100 PIP GAIN 5/1 RR

CHFJPY - Short Timeshould be waiting for the invalidation level to get a sell position.
Let see what happens!
Cheers! ;)


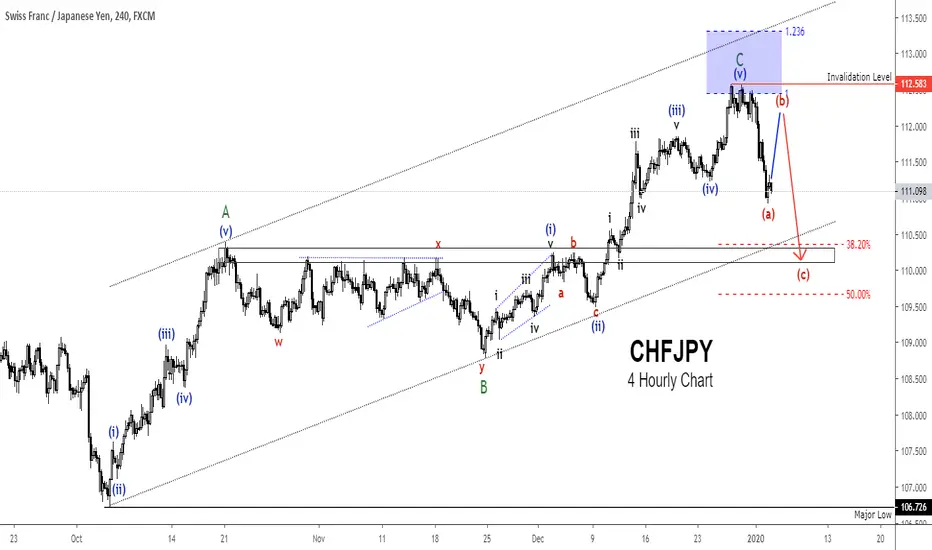
ELLIOT WAVE: CHFJPY TRADE IDEA CHFJPY completed A-B-C zigzag corrective pattern and setting up for a decline. This decline which can be another short-term correction could also be the beginning of a major decline.
What matters right now is that we would at least see a three-wave move to the downside to the nearest demand level as shown on the chart.
We will look for a short-term correction in wave (b) to position to a sell entry in wave (c).
Here is the 1-hourly outlook.
www.tradingview.com
What's your thought on CHFJPY? Let me know in the comment.
Thanks for reading.
Veejahbee.

Swiss Jpy - tug of warANALYSIS ON CHFJPY
Welcome to my analysis
-
30min CHart
-
Interesting Point of interest In the CHFJPY pair.
- Price below 200 day EMA.
- look for buy signals.
- Expecting some more upward movement.
- Watch 110.050 for take profit.
- MACD showing bullish divergence
Stay Tuned


START OF THE WEEK GUIDE (26 Aug - 30 Aug 2019) | CHFJPY(4H)See chart for illustration.
Follow up from long term speculation (see link below)

CHFJPY(DAILY) | LONG TERM PROJECTION | SHORT!See chart for illustration.
Expect lower time frame publication soon as price action is monitored


FREE ANALYSIS ON CHFJPY - time for the bearsFREE ANALYSIS ON CHFJPY
Welcome to SiriusTrading (managed by Segunby), Check out my Free analysis on Forex and Crypto. Follow me for regular Analysis and don't forget to LIKE, LIKE, LIIIKKKEEE :)
-
15 Min
Bearish Momentum found here. Price below all 3MA's.
1 HOUR
Price has just broke down the trendline and also tested it again. We can also see price breaking down off the MA 200 also. Expecting further down on this pair
4 HOUR
We are currently seeing a retracement of the recent bear run which started 30th June. Price broke down the 27day MA and the 100 MA's. Price did test the 200 MA and was rejected. we are now expecting price to test and break this MA 200 level for further bearish momentum.
OVERALL
Expecting more sell. see chart for TP expectations.
-
Thanks for reading
See previous analysis
Please share your thoughts and views on my analysis and don't forget to like it and share with others.


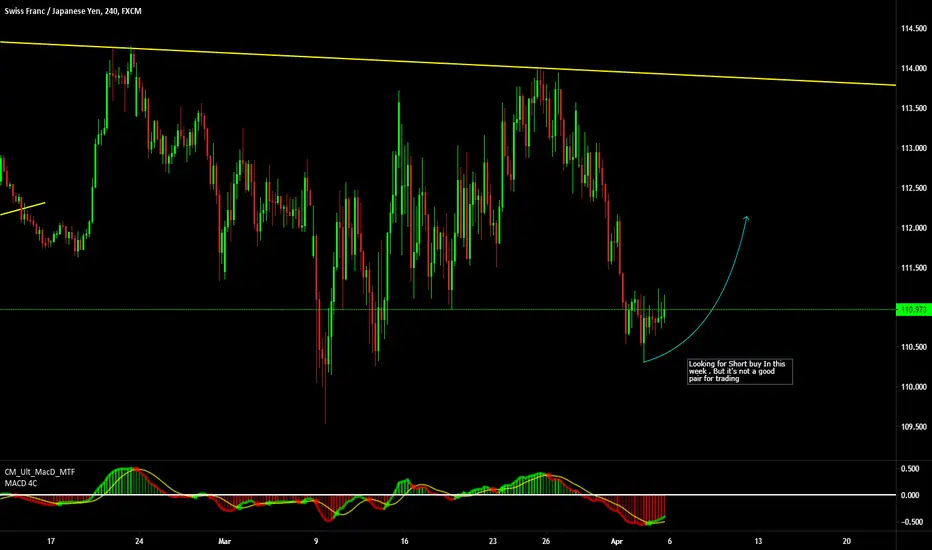
CHFJPY Short on 240Chfjpy had a bearish week last week and opened this week on the bullish side of the market but i think it is just a slight pullback before the price begins to drop further down.
