$CNIRYY -China CPI (May/2025)ECONOMICS:CNIRYY
May/2025
source: National Bureau of Statistics of China
- China's consumer prices dropped by 0.1% yoy in May 2025, matching the declines seen in the previous two months and slightly outperforming expectations of a 0.2% decrease.
This was the fourth straight month of consumer deflation, highlighting challenges from ongoing trade risks with the US, sluggish domestic demand, and concerns over job stability. Non-food prices were flat for the second month in a row, as increases in housing (0.1% vs 0.1% in April), clothing (1.5% vs. 1.3%), healthcare (0.3% vs 0.2%), and education (0.9% vs 0.7%) were offset by a sharper drop in transport (-4.3% vs -3.9%).
On the food side, prices fell at a steeper rate (-0.4% vs -0.2%), down for the fourth month.
Core inflation, which excludes volatile food and fuel prices, rose 0.6%, marking the highest reading since January and following a 0.5% gain in the prior two months.
On a monthly basis, the CPI declined by 0.2% in May, reversing a 0.1% gain in April and indicating the third monthly drop so far this year.
China

CHINA50 to break to the upside?CHN50 - 24h expiry
A break of the recent high at 13506 should result in a further move higher.
A Morning Doji Star formation has been posted at the low.
The overnight dip has been bought into and there is scope for further bullish pressure going into this morning.
We look for gains to be extended today.
Buying continued from the 78.6% pullback level of 13375.
We look to Buy a break of 13511 (stop at 13412)
Our profit targets will be 13808 and 13858
Resistance: 13506 / 13647 / 13815
Support: 13375 / 13274 / 13137
Risk Disclaimer
The trade ideas beyond this page are for informational purposes only and do not constitute investment advice or a solicitation to trade. This information is provided by Signal Centre, a third-party unaffiliated with OANDA, and is intended for general circulation only. OANDA does not guarantee the accuracy of this information and assumes no responsibilities for the information provided by the third party. The information does not take into account the specific investment objectives, financial situation, or particular needs of any particular person. You should take into account your specific investment objectives, financial situation, and particular needs before making a commitment to trade, including seeking advice from an independent financial adviser regarding the suitability of the investment, under a separate engagement, as you deem fit.
You accept that you assume all risks in independently viewing the contents and selecting a chosen strategy.
Where the research is distributed in Singapore to a person who is not an Accredited Investor, Expert Investor or an Institutional Investor, Oanda Asia Pacific Pte Ltd (“OAP“) accepts legal responsibility for the contents of the report to such persons only to the extent required by law. Singapore customers should contact OAP at 6579 8289 for matters arising from, or in connection with, the information/research distributed.

Fasten your seatbelts - China Southern Airlines to fly higherChina’s recent decision to grant visa-free entry to citizens of four Gulf Cooperation Council (GCC) countries—Saudi Arabia, Oman, Kuwait, and Bahrain—from June 9, 2025, is expected to significantly boost travel demand between China and the Gulf region.
Key benefits for China Southern Airlines:
> Increased passenger traffic from GCC countries for tourism, business, and cultural exchange.
> Opportunity to expand direct flight routes to major Gulf cities, enhancing its international network.
> Stronger hub positioning for cities like Guangzhou and Urumqi as gateways for Middle East–Asia connectivity.
> Improved load factors and revenue from both inbound and outbound travel, especially during peak seasons.
This policy complements earlier agreements with the UAE and Qatar, which already enjoy 30-day visa-free access, effectively making all GCC nations visa-exempt for short-term visits to China
Basis review of monthly chart, price has potential to retest level of 5.70 which is 46% upside from current level of 3.90. Price needs to breach the overhead resistance of 4 and sustain above it for multiple days for the upside momentum to kick in. However, this view is negated if price breaks below 3.20 level.

CHINA50 to find buyers at market price?CHN50 - 24h expiry
Buying continued from the 78.6% pullback level of 13375.
Offers ample risk/reward to buy at the market.
Although the bears are in control, the stalling negative momentum indicates a turnaround is possible.
Early pessimism is likely to lead to losses although extended attempts lower are expected to fail.
Daily signals are mildly bullish.
We look to Buy at 13385 (stop at 13280)
Our profit targets will be 13695 and 13765
Resistance: 13543 / 13647 / 13700
Support: 13386 / 13300 / 13170
Risk Disclaimer
The trade ideas beyond this page are for informational purposes only and do not constitute investment advice or a solicitation to trade. This information is provided by Signal Centre, a third-party unaffiliated with OANDA, and is intended for general circulation only. OANDA does not guarantee the accuracy of this information and assumes no responsibilities for the information provided by the third party. The information does not take into account the specific investment objectives, financial situation, or particular needs of any particular person. You should take into account your specific investment objectives, financial situation, and particular needs before making a commitment to trade, including seeking advice from an independent financial adviser regarding the suitability of the investment, under a separate engagement, as you deem fit.
You accept that you assume all risks in independently viewing the contents and selecting a chosen strategy.
Where the research is distributed in Singapore to a person who is not an Accredited Investor, Expert Investor or an Institutional Investor, Oanda Asia Pacific Pte Ltd (“OAP“) accepts legal responsibility for the contents of the report to such persons only to the extent required by law. Singapore customers should contact OAP at 6579 8289 for matters arising from, or in connection with, the information/research distributed.

Don't trade Aussie this week!Dear traders,
Among the top 8 forex market currencies, tariffs war affects the Aussie most, because Australia is highly dependent on China.
Rank Trading Partner Exports (A$ million)
1 China 185,141
2 Japan 119,889
3 European Union 31,816
4 United States 30,690
Uncertainty about China's future means, fluctuations in Aussie. I don't trade AUDUSD this week,
only if everything goes well with negotiations between Trump and China, I might use confirmed break over zone of 0.64355 to take long trades.
Regards, Ali

Nightly $SPY / $SPX Scenarios for May 13, 2025🔮 Nightly AMEX:SPY / SP:SPX Scenarios for May 13, 2025 🔮
🌍 Market-Moving News 🌍
🇺🇸 CPI Data Release Anticipated
The Bureau of Labor Statistics is set to release the April Consumer Price Index (CPI) data today at 8:30 AM ET. Economists forecast a 0.3% month-over-month increase, following a 0.1% decline in March. Year-over-year, CPI is expected to remain at 2.4%, with core CPI holding steady at 2.8% .
🤝 U.S.-China Trade Truce Boosts Markets
Markets rallied on Monday after the U.S. and China agreed to reduce tariffs for 90 days, easing trade tensions. The Dow Jones Industrial Average surged 1,160 points (2.8%), the S&P 500 rose 3.3%, and the Nasdaq gained 4.4%. Major tech stocks like Amazon ( NASDAQ:AMZN ), Apple ( NASDAQ:AAPL ), Nvidia ( NASDAQ:NVDA ), and Tesla ( NASDAQ:TSLA ) saw significant gains .
📈 Coinbase to Join S&P 500
Coinbase Global Inc. ( NASDAQ:COIN ) will be added to the S&P 500 index on May 19, replacing Discover Financial Services. The announcement led to an 11% surge in Coinbase shares during after-hours trading .
💎 Sotheby's to Auction $20M Blue Diamond
Sotheby's Geneva is set to auction the "Mediterranean Blue Diamond," a rare 10-carat gem valued at $20 million, today. The auction has garnered significant global interest from collectors and investors .
📊 Key Data Releases 📊
📅 Tuesday, May 13:
8:30 AM ET: Consumer Price Index (CPI) for April
8:30 AM ET: Core CPI for April
4:30 PM ET: API Weekly Crude Oil Stock Report
⚠️ Disclaimer:
This information is for educational and informational purposes only and should not be construed as financial advice. Always consult a licensed financial advisor before making investment decisions.
📌 #trading #stockmarket #economy #news #trendtao #charting #technicalanalysis

Liberation, Altercation & Boom: US China Trade talks CME_MINI:ES1!
Pointing to our previously written blog post (Liberation, Altercation or Doom) on March 31st. A mix of all scenarios played out.
Global universal tariffs with reciprocal tariffs layered on top. It resulted in a huge sell-off on April 2nd.
After months of tit-for-tat tariffs and growing economic friction, the US and China have agreed to hit pause. In a joint statement that’s given markets some breathing room, both countries announced a 90-day suspension on a large portion of their punitive tariffs—an initial step toward dialing back tensions and restarting dialogue.
Key Tariff Measures from US-China Joint Statement (90-Day Pause)
US Tariff Reductions:
Tariffs on Chinese goods were reduced from 145% to 30% for a 90-day period.
24 percentage points suspended, leaving a 10% base tariff in place.
China Tariff Reductions:
Tariffs on US goods reduced from 125% to 10% for the same 90-day period.
China also suspends 24 percentage points of additional ad valorem duties.
Retains a 10% baseline tariff on US imports.
Non-Tariff Measures: China to suspend or remove all non-tariff countermeasures imposed since April 2.
Includes sanctions on certain US companies.
Lifts export controls on some critical minerals.
Timeline & Commitment:
Both parties agree to implement these actions by May 14.
Commitment to continue trade and economic talks through a new bilateral mechanism.
Talks may be held in alternating locations (US/China) or via third-party venues.
No Agreement On:
Currency policy.
E-commerce “de minimis” exemptions.
Sector-specific tariff frameworks.
Future Key Dates and Timeline:
May - Potential US semiconductor tariffs.
May/June - Potential US pharmaceutical tariffs.
July 8th - 90-day tariff lowering for "worst offenders" expires.
July 14th - US tariffs on Mexican agriculture goes into effect.
August 10th - US-China tariff relief expires.
Was this really mutual or just a game of chicken?
There’s an argument to be made that this is more of a tactical pause than a full reconciliation. With China’s GDP in purchasing power parity terms now surpassing that of the US, and its continued technological advancements across sectors like aerospace, semiconductors, and critical minerals, the balance of economic leverage is shifting. For investors, this isn’t just about tariffs—it’s about the evolving structure of global trade.
Geopolitical undercurrents continue to shape the backdrop. China’s strategic influence in regional security, technology supply chains, and commodity access adds another layer to its negotiating position. Recent developments—such as China's reassertion of dominance in strategic corridors and growing control over key mineral exports—suggest its economic posture is becoming more assertive. This, in turn, has implications for US firms dependent on Chinese inputs or facing retaliatory restrictions.
In short, the 90-day window presents a tactical opportunity, but the structural story remains complex. Investors would be wise to monitor not just tariff updates, but broader shifts in trade alliances, export controls, and supply chain vulnerabilities—especially in sectors like tech, energy, and defense-adjacent industries.
ES Futures:
ES Futures and risk on assets are positive across the board following this announcement.
Key Levels:
Key LVN/ Key LIS: 5861-5837.25
200 Day MA: 5872.99
0.786 Fib Retracement level: 5921.75
0.618 Fib Retracement level: 5688.75
pWkHi: 5741
mCVAL 2025: 5639.75
Expectations for the week ahead:
US CPI and Retail Sales data on the docket this week along with slew of FED speakers.
Scenario 1: Risk on
ES Futures get back above 200-day moving average clearing the key LVN resistance zone and our key LIS, head towards 0.786 Fib retracement level before pulling back and consolidating for the remainder of the week.
Example trade:
Entry: 5861
Stop: 5837
Target: 5921.75
Risk: 96 ticks
Reward: 243 ticks
Risk/Reward ratio: 2.5 R
Scenario 2: Further consolidation
Markets consolidate below the key LVN resistance zone and prior weekly high.
Example Trade:
Entry: 5837
Stop: 5861
Target: 5741
Risk: 96 ticks
Reward: 384 ticks
Risk/Reward ratio: 4 R
Glossary:
VA: Value Area
VPOC: Volume Point of Control
VAL: Value Area Low
C: Composite (used as a prefix: VA, VAL, VAH, VPOC, etc.)
mC: micro Composite (used as a prefix: mCVA, mCVAL, etc.)
LNV: Low Volume Node
LIS: Line in Sand
Important Notes:
These are example trade ideas not intended to be a recommendation to trade, and traders are encouraged to do their own analysis and preparation before entering any positions.
Stop losses are not guaranteed to trigger at specified levels, and actual losses may exceed predetermined stop levels.

SPY weekly thoughts for May 12th - 16th. Trump Pump?What’s up traders — this is my first idea post here on TradingView, and I’m hyped to finally share something with the community. In this breakdown, I’ll be covering a few key areas I’m watching:
🟩 Support zones
📉 Resistance levels
🕯️ Weekly candle behaviour
🌍 Macro outlook and possible catalysts
📌 Important notes
⚠️ My current bias
Let’s jump in:
🟩 Support Zones:
Buyers are still showing up strong in that $505–$507 range(I highly doubt their orders will get filled lol). it had been a reliable bounce zone — we’ve seen repeated wicks rejecting that level and price snapping back VERY quickly.
Above that, $550 has developed into a new area of support, and right now that’s my main level to watch. If that gives out, I expect we’ll head back down to test the $507 zone again. But for now, bulls are doing their job.
📉 Resistance
SPY keeps getting stuck around $573–$575. That zone’s been tested a few times now, but buyers haven’t been able to push it through. Sellers are stepping in there almost every time.
🕯️ Weekly Candle Context
That’s three straight weekly closes below resistance. Bulls get some momentum mid-week, but by Friday, sellers take over. It’s showing signs of a stall — like the market’s running out of gas near the top.
🌍 Macro Outlook – What Could Move Things
There’s been some talk of softer trade discussions and early negotiations with China. If any of that turns into a real deal, it could be the spark SPY needs to finally break above resistance.
But on the flip side — if Trump starts pushing new tariffs (even smaller ones), those moves tend to hold stocks back, especially in tech.
So the big question is:
Can SPY hit new highs if tech keeps cooling off and there’s pressure from new trade policy?
That’s the tug-of-war right now — possible upside from improving global relations, but real downside risk from political decisions.
📌 Things I’m Watching:
A weekly close above $575 would shift me to a bullish bias.
If we lose $550, I’ll be watching closely to see how price behaves near $507.
⚠️ Current Bias
Right now I’m FAIRLY neutral with a slight bullish lean, but very excited for this next weekly candle.
The macro setup looks like it could support a move higher, but I’m staying decently cautious until we get a clear weekly breakout(+575) and close above resistance.
Let me know what you think — and if you’re watching the same levels.

HUGE +1,522% in 2 days from $0.61 to $9.90 $ASSTIt was clear from the very start this one will go insane because of the volume. It traded 315 million shares on first day when I posted about it. I sent out a message premarket at the very beginning of the move and it already had tens of millions of shares volume at that time.
Then the next day it got to 241 million shares, you just don't see stuff like that in regular stocks.
Awesome profits made along the way, can't wait for a new catch like that!
NASDAQ:ASST

From $1 to $10 doing 900% in 2 days $KIDZ💣💥 $1 to $10+ in 2 days +900% NASDAQ:KIDZ similar to AMEX:GPUS
Shortsellers attempted similar tricks during the day and got squeezed the same way on both 🤣 making us awesome gains along the way
Please 🐻 attempt to do it again on next setups.
3 Buy Alerts in $3.50 - $4.00 range more than enough money made into vertical to $10+

Nightly $SPY / $SPX Scenarios for May 7, 2025🔮 Nightly AMEX:SPY / SP:SPX Scenarios for May 7, 2025 🔮
🌍 Market-Moving News 🌍
🏛️ Fed Decision Day Amid Tariff Pressures
The Federal Reserve concludes its two-day meeting today, with expectations to maintain the benchmark interest rate at 4.25%-4.5%. Despite President Trump's calls for rate cuts, the Fed remains cautious due to inflationary risks from new tariffs and migration policies.
📈 U.S.-China Trade Talks Resume
U.S. stock futures rose overnight on news of upcoming high-level trade talks between the U.S. and China, marking the first discussions since the imposition of 145% tariffs on Chinese goods. Treasury Secretary Scott Bessent and U.S. Trade Representative Jamieson Greer are set to meet with senior Chinese officials later this week.
🛢️ Oil Prices Rebound on Demand Hopes
Oil prices climbed as U.S. production declined and demand in Europe and China showed signs of recovery. Brent crude rose 0.6% to $62.52 per barrel, while U.S. West Texas Intermediate increased 0.74% to $59.53 per barrel.
💼 Key Earnings Reports Ahead
Several major companies, including Uber ( NYSE:UBER ), Disney ( NYSE:DIS ), and Novo Nordisk ( NYSE:NVO ), are scheduled to report earnings today. Investors will be watching these reports for insights into corporate performance amid ongoing economic uncertainties.
📊 Key Data Releases 📊
📅 Wednesday, May 7:
2:00 PM ET: Federal Open Market Committee (FOMC) Meeting Announcement
2:30 PM ET: Fed Chair Jerome Powell Press Conference
3:00 PM ET: Consumer Credit Report (March)
⚠️ Disclaimer:
This information is for educational and informational purposes only and should not be construed as financial advice. Always consult a licensed financial advisor before making investment decisions.
📌 #trading #stockmarket #economy #news #trendtao #charting #technicalanalysis

MARKETS week ahead: April 28– May 4Last week in the news
The market is currently perceiving that there is sort of relaxation in the US-China trade war. This was the major premise which boosted US equity markets. The S&P 500 gained around 4,6% on a weekly level. A positive market sentiment and short relaxation on uncertainty brought the price of gold lower by 2% on Friday, ending the week at the level of $3.318. On the same premise reacted the US Treasury bond market. The 10Y US benchmark closed the week lower, at the level of 4,25%. The crypto market was also part of the positive sentiment, as BTC managed to make a break-through from previous levels and reach levels above the $95K.
The US-China trade war continues, however, with a softener rhetoric, which brought market sentiment to the positive side. Still, it remains quite confusing, where the majority of analysts are not sure what the final deal would look like. Actually, it seems that nobody knows, even the US Administration. The latest comment from the US President on the topic is that eventually tariff rates will “come down substantially, but it won't be zero”. Also, the US President commented that he has no intention of “firing Powell”.
The Financial Times posted an article in which the journal noted that Apple was planning to shift all Iphones assembly to India. Analysts, involved in the matter, reacted to this news with arguments that such a move is highly questionable, both from the logistic side and from a tariffs side.
The federal Reserve withdraws crypto guidance for banks. The Federal Reserve revoked its 2022 and 2023 guidance that required banks to notify or get approval before engaging in crypto or stablecoin activities.
As Reuters reported during the previous week, based on six sources, the ECB is considering further cutting of its policy rates at the June meeting. The relaxing inflation and drop in the economic outlook ECB members see as a good reason to further decrease their reference interest rates.
China is targeting the supremacy in the AI industry and development in comparison to its US counterparts. As news reported, the China President Xi Jinping called during the previous week for a “self-reliance and self-strengthening” in China within artificial intelligence. This now represents a key strategic area for China when it comes to their US counterparts.
JPMorgan published the results of a survey among investors over their perception of the US economy in the future period. There has been a consensus on a high potential of stagflation, while the majority of participants perceive the weak US Dollar during this year. The major risk is coming from the ongoing trade war, which will have a negative impact on the US economy, as per survey.
Crypto market cap
The crypto market is in green again. After several weeks of struggling, the crypto market finally made its final break-through and increased the value of the total market capitalization. This move was supported by the relaxation of rhetoric of the US Administration in an US-China trade war. Total crypto market capitalization was increased by 10% on a weekly basis, increasing its total value by $262B. Daily trading volumes almost doubled from the week before, trading around $166B on a daily basis. Total crypto market increase from the beginning of this year, currently stands at -10%, with $318B outflow of funds.
The major coins which drew the total crypto market to the higher grounds was BTC. The coin added $183B to its market cap, increasing it by more than 10% on a weekly basis. ETH also performed well, with an weekly inflow of $ 23B, which increased its market cap by 12%. Other major coins also performed well during the week. Solana added $5,4B to its market cap, which was an increase of 7,5%. DOGE surged by 14,8%, adding $3,4B to its market cap. Among higher gainers was IOTA, with a surge in value of 27,3%, LINK was traded higher by 15%, Algorand gained around 19% w/w. The majority of other coins gained above 10% on a weekly basis. This week there were almost no losers on the crypto market.
As for coins in circulation, this week Polkadot and Filecoin added 0,6% of new coins to the market, same as EOS. Maker made a significant increase of 0,8% within a single week. Stablecoin Tether increased its number of coins by 1,7%, which was one of the highest increases for this stablecoin within this year.
Crypto futures market
The crypto futures market also reacted on a positive sentiment caused by relaxation in rhetoric regarding trade tariffs. BTC futures were traded higher by more than 12% for all maturities. The positive development is that the long term futures returned to the levels above the $100K. Futures maturing in December this year closed the week at $99.770, and those maturing a year later were last traded at $105.755.
Similar situation is also with ETH futures. Positive is that the long term maturities reached levels above the $2K. In this sense December 2026 was closed at price $2.043, while futures maturing in December this year were last traded at round $1,9K.

$CNGRES -China's Gold Reserve (Q4/2024)ECONOMICS:CNGRES
Q4/2024
2.280 Tonnes
source: World Gold Council
- Gold Reserves in China increased to 2279.56 Tonnes in the fourth quarter of 2024 from 2264.32 Tonnes in the third quarter of 2024.
Gold Reserves in China averaged 1216.76 Tonnes from 2000 until 2024,
reaching an all time high of 2279.56 Tonnes in the fourth quarter of 2024 and a record low of 395.01 Tonnes in the second quarter of 2000.

Gold Approaches $3,400 Amid Weakening Dollar ConfidenceGold is rallying on a combination of safe-haven flows and Dollar weakness, approaching the $3,420 resistance. While momentum is elevated—resembling crisis-era extremes—further gains are possible amid continued uncertainty.
If $3,420-$3450 zone holds, aligning with key Fibonacci extensions (drawn from the 2018 lows, 2020 highs, and 2022 lows), and trendline connecting 2016 and 2020 peaks, gold could follow through on its cup and handle breakout pattern toward $3,700 and $4,000.
However, any geopolitical resolution or easing of trade tensions could trigger a sharp reversal, with potential downside levels at $3,000, $2,960, $2,900, and $2,800.
Written by Razan Hilal, CMT

A Broader Market Review...As we have all seen within the last month or so, the U.S. equity markets have been getting the worst ass whooping since 2020. And as much as we'd like to forget that absolute disaster, it does bring to thought the idea of buying general market funds (such as AMEX:SPY , NASDAQ:QQQ , or AMEX:DIA ) to gain a nice entry into the next bull market, whenever that may be. However, not everything is all smooth sailing. The unfortunate part of this market downturn is that no amount of technical astrology fortune-telling analysis could have predicted the market's reaction to the tariffs being levied on foreign nations. So we need to put our big-boy pants on and look at the market as if it isn't some automatic wealth generating pattern that points north-east all day long.
Let's start with the tariffs. Firstly, we know there has been a 90 day pause on all conforming countries most notably leaving out China. It's not like that's anything special, just almost all our crap is made there. Unfortunately, we are observing what may be the greatest economic error of our lifetimes.
For those who are lost, foreign governments DO NOT pay for the tariffs in the way we are told. The U.S. Government levies the tariffs on the exporter (Chinese companies in this case), who then pass it on to the buyer of the goods (think Walmart, Target, Apple, etc.), who then pass those charges onto YOU... Enjoy!
So with an attempt at a full blown trade war, which the U.S. cannot win nor even has the industrial strength or infrastructure to compete, we can expect the markets to completely do a Bald Eagle courtship nosedive into new lows as observed a few weeks ago. But what will the Creature from Jekyll Island think of this?
Well miraculously, Fed chairman Jerome Powell claimed that the Fed will NOT allow the tariffs to exacerbate inflation into new highs. Get that, the Federal Reserve will not allow economic movements that raise prices on an importing nation ( that's the United States by the way), to raise prices anymore. While he's at it, how about we just get no inflation ever since it's just that simple?
And as if that wasn't enough, Donald Trump called for Jerome Powell to lower rates for some reason, saying that Powell was too late on his economic movement at the Fed. As it turns out, our plan for strengthening the economy is to.... weaken the dollar? Not sure why that's the case but at least we will be able to borrow more money at a cheaper price, as if the United States doesn't already have a debt problem. The Fed lowering rates would of course open the possibility of getting yet another wave of quantitative easing which will most likely be observed further down the road. Another round of QE, along with rate cuts, will of course send the equity markets to new highs on top of a weaker dollar.
Speaking of a weaker dollar, we should lastly talk about the TVC:DXY which measures the comparative strength of the U.S. Dollar to other currencies. As it turns out in this scenario, the dollar is getting weaker and weaker every day, meaning that people are running from U.S. Debt like it's the plague. If we were going to get a weaker dollar, at least could we have a higher market to offset our inevitable losses? I guess not...
Here is the TVC:DXY 1D looking back into late 2024.
Lastly for what to expect out of the market. If the trade situation will all the tariffs and this neo-cold war cool down, we might see some tariff pauses or lowering which will of course fire the market into new highs. However, if the situation doesn't cool, our debt yields rise, the market is going to go south faster than a Canadian in December. On a positive note, macroeconomic events move slowly, so it should be clear when a turnaround is coming...

Gold Hits Fibonacci 3.618! What’s Next?GOLD (XAU/USD) Quick Analysis – April 2025
Gold just surged to $3,329/oz, reaching the Fibonacci 3.618 extension around $3,338 🚀
The trend remains strongly bullish, but the price is now extended far above key moving averages – signaling potential exhaustion.
Key Levels:
Support: $2,856 (Fibo 2.618)
Next Resistance: $3,635 (Fibo 4.236)
🧭 Outlook:
As long as price holds above $2,856 → the bullish structure remains intact
🎯 Strategy:
Wait for a healthy pullback → buy the dip near support
Or enter on a breakout-retest above $3,338 for potential continuation

Bitcoin (BTC): Fake-out Above 200EMA | Sellers DominatingBitcoin had a nice rejection yesterday where we failed to form the BOS and break above the local highs, which resulted in a fakeout above the 200EMA and the price falling below that line.
As we see the demand in downward movement, we are keeping our sell target active as long as we are again below the local highs (at $85,750).
Markets sell exhausted, economy doomed....Be sure to have a tight stop-loss and small leverage on any position you would want to open. We expect to see a big liquidation hunting to happen soon thanks to the #China and #USA tariff war.
Swallow Academy

Gold Holds Haven Status Above 3200Gold maintains its safe-haven appeal, holding firmly above the $3,200 mark. The current trend met resistance near $3,250, and a decisive breakout could drive further gains toward $3,290–$3,300, fueled by rising trade war tensions and ongoing dollar weakness.
• Downside Risks:
If the dollar reverses or U.S.–China trade talks show progress, a drop below $3,200 may lead to pullbacks toward $3,190 and $3,170.
A deeper decline could trigger a broader correction toward $3,100 and $3,090, helping to reset overbought momentum on higher time frames or set the stage for a deeper downturn.
- Razan Hilal, CMT

SIGNAL FOR TRADE IN 15m TIMEFRAMEBTCUSDT prepare for downward trend in 15m timeframe
its my opinion about this chart

Crude Oil Holds Rebound Above $55Crude oil's sharp rebound from the $55 support—aligned with the 0.618 Fibonacci retracement of the 2020–2022 uptrend—faced immediate resistance at the long-standing support-turned-resistance zone around $63.80, established in 2021.
A decisive move above $63.80 may clear the way for further gains toward $66, $68, $69.60, and ultimately $73. On the downside, a drop below $58 would bring $55 back into focus.
A clean break below that level could trigger further downside toward $49 per barrel, which aligns with the lower boundary of crude oil's long-term uptrend.
With global powers competing for oil, key events this week include:
🔹 OPEC report amid tariffs and efforts to regain market share
🔹 US–China trade talks
🔹 Chinese GDP, IP, Retail Sales (Wed)
Written by Razan Hilal, CMT

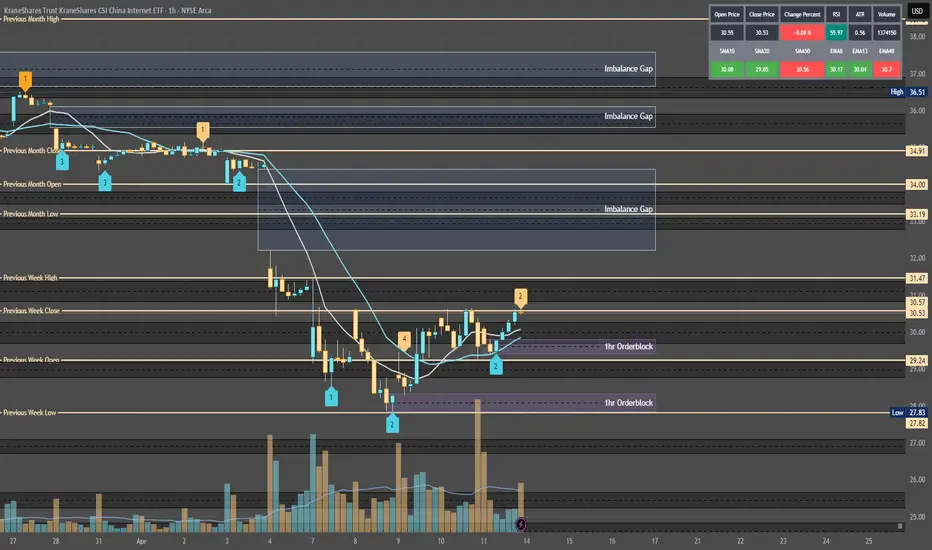
Quantum's KWEB Trading Guide 4/13/25Analysis:
Post-Close Options Activity (April 11):
Data: System reports 469.32K contracts traded on April 11, with puts at 10.99% (calls ~89%). High call volume at $31/$32 strikes suggests bullish bets.
Interpretation: Call-heavy flow indicates retail/institutional optimism, likely targeting a sweep above $31.35 (weekly high). Potential for a liquidity sweep trapping longs, aligning with ICT/SMT reversal.
RSI (14) Level and Trend:
Estimate: Daily RSI ~55 (neutral-bullish), based on April 11 close ($30.52, +2.97% from $29.62). Uptrend from April 8 low ($27.95) but below March 17 peak ($38.401) avoids overbought.
Interpretation: RSI supports bullish setups (above 50), with room for upside before resistance (~70). A sweep to $31.50 could push RSI higher, signaling OTE retracement.
Anonymized X Post Insights (April 11–13):
Summary: Posts highlight Chinese tech optimism (e.g., DeepSeek AI, consumer spending), tempered by tariff fears (Trump’s 125% threats). Some speculate on KWEB breaking $31, others note volatility risks.
Interpretation: Mixed sentiment leans bullish, with chatter about AI and stimulus driving buy-side interest. Tariff uncertainty suggests potential sell-side sweeps if news escalates.
Potential Reversals/Catalysts:
Liquidity Sweeps: Call-heavy options and X speculation point to a buy-side sweep above $31.35 (W-High), trapping retail longs before an OTE reversal to $30.00 (HVN).
Institutional Positioning: High call OI suggests dealers hedging bullish bets, but tariff risks could trigger smart money to fade retail.
Catalysts: Retail Sales (April 15) or tariff relief news could spike KWEB, while escalation could drive sell-side volatility.
Why: Sentiment aligns with ICT/SMT, where bullish retail chatter sets up sweeps, and smart money reverses at OTE. Neutral-bullish RSI and call volume support a setup.
Action: Log sentiment as neutral-bullish, expect sweep above $31 or drop to $29 on tariff news. Highlight for video: “KWEB’s call-heavy buzz could trap retail—watch for a smart money reversal.”
Tariff Impact
Assessment: Severe
Exposure:
KWEB’s holdings (e.g., PDD, JD.com, Tencent) rely on China’s internet economy, with significant supply chain and consumer exposure to U.S.-China trade. Tariffs (e.g., 125% proposed) raise costs for e-commerce and tech exports, hurting revenues.
Example: PDD (Temu) faces U.S. import duties, squeezing margins; JD.com’s logistics chain is tariff-sensitive.
Current Policy (April 13):
Context: Trump’s April 10 statement escalates tariffs to 125% on Chinese goods, with no relief confirmed by April 13. Web reports (Reuters, April 4) note market volatility from tariff fears, impacting KWEB’s April 8 low ($27.95).
Impact: Severe, as KWEB’s ETF structure amplifies holdings’ tariff pain (e.g., Alibaba, Tencent ADRs). Sentiment sours on escalation, driving sell-side sweeps.
Tariff Relief Potential:
Scenario: A 90-day pause or negotiation (rumored on X, inconclusive) could lift KWEB +3–5% ($31.50–$32.00), as seen in past relief rallies (e.g., February 2025, +1.6% on pause news).
Fundamentals: Relief boosts consumer spending on KWEB’s holdings, supporting bullish MSS. Without relief, bearish pressure persists.
AMT Tie-In: Tariff news creates imbalances (LVN breaks), with price seeking HVNs (e.g., $30.00) post-volatility.
Why: Severe tariff exposure makes KWEB sensitive to trade news, fueling sweeps (buy-side on relief, sell-side on escalation), per ICT/SMT.
Action: Rate tariff impact severe, monitor April 14 for negotiation updates. Video: “Tariffs could sink KWEB, but relief might spark a sweep to $32—stay sharp.”
News/Catalysts
Current (April 11, 2025)
Closing Price:
System Data: KWEB closed at $30.52 (currentPrice), +2.97% from prevDayClose ($29.62).
Verification: Matches April 11 high ($30.63), low ($29.41), open ($30.12).
Drivers:
Positive: Call-heavy options (89% calls) and AI buzz (DeepSeek, X posts) drove the rally. Web reports note Chinese tech resilience despite tariffs.
Negative: Tariff fears capped gains, with X posts citing Trump’s 125% threat as a drag.
Sector Trends: China ETFs rose (e.g., MCHI +2.1%, April 11), supporting KWEB’s move.
Why: Options flow and AI speculation fueled bullish momentum, but tariffs restrained breakout above $31.
Action: Highlight $30.52 close, +2.97%, driven by calls and AI. Video: “KWEB jumped 3% on AI hype, but tariffs loom large.”
Upcoming (Week of April 14–18)
Events:
April 15, Retail Sales (8:30 AM): Measures U.S. consumer spending, impacting KWEB’s e-commerce holdings (PDD, JD.com).
April 16–18, Tariff Talks: Potential U.S.-China negotiations, per X chatter (inconclusive).
Ongoing, China Stimulus: Rumored fiscal measures could lift Chinese tech, no date confirmed.
Predictions:
Bullish (+3%, ~$31.50): Strong Retail Sales (+0.5% MoM) or stimulus news boosts e-commerce, sweeping buy-side liquidity ($31.35).
Bearish (-3%, ~$29.50): Weak Retail Sales (-0.2% MoM) or tariff escalation triggers sell-side sweep ($29.41).
Neutral (±1%, $30.20–$30.80): Mixed data or no tariff news keeps KWEB near $30.00 (HVN).
Why: Catalysts drive displacement (sweeps to OHLC/LVNs), setting up OTE entries, per AMT/ICT.
Action: Set alerts for Retail Sales (April 15), monitor X for tariff updates. Video: “Retail Sales could push KWEB to $32 or drop it to $29—big week ahead.”
Technical Setup
Multi-Timeframe Analysis (Adjusted to April 11 Close, $30.52)
Weekly Chart
HVN (High Volume Node):
Level: $30.00 (POC, near W-Open $29.59, D-Close $30.52).
Role: Support, price consolidated March 24–April 11 ($29–$31).
Stance: Bullish (price above HVN, defending $30.00).
LVN (Low Volume Node):
Level: $31.50 (near W-High $31.35, April 4).
Role: Fast-move zone, price dropped post-$31.35 (April 4–8).
Stance: Neutral (price below LVN, potential sweep target).
EMA Trend:
Status: 8-week ($31.50) < 13-week ($32.00) < 48-week ($33.50), downtrend but flattening.
Stance: Neutral (price below EMAs, but $30.52 tests 8-week).
RSI (14):
Level: ~55 (neutral-bullish, up from 45 at $27.95, April 8).
Stance: Bullish (>50, room to 70).
MACD:
Status: Above signal, nearing zero (bullish crossover April 10).
Stance: Bullish (gaining momentum).
Bollinger Bands:
Status: Price at midline ($30.50), bands narrowing.
Stance: Neutral (breakout pending).
Donchian Channels:
Status: Above midline ($29.65, W-Low to W-High).
Stance: Bullish (breakout potential).
Williams %R:
Level: ~-40 (neutral, not overbought).
Stance: Bullish (>-50, rising).
ADR (Average Daily Range):
Status: Expanding (~3%, $0.90/day).
Stance: Bullish (volatility supports moves).
VWAP:
Status: Above VWAP (~$30.20, April 11).
Stance: Bullish (buyers control).
ICT/SMC:
MSS: Bearish (lower highs from $38.401, March 17, but higher low $27.95, April 8, signals potential shift).
Trend: Neutral (consolidation $29–$31, testing W-High $31.35).
Summary: Neutral-bullish, price at HVN ($30.00) with LVN ($31.50) as sweep target. Indicators favor upside, but MSS needs confirmation.
1-Hour Chart
Support/Resistance:
Support: $29.41 (D-Low, April 11), aligns with W-Open ($29.59), HVN ($30.00).
Resistance: $30.63 (D-High, April 11), near LVN ($31.50), W-High ($31.35).
Stance: Bullish (price above support, testing resistance).
RSI (14):
Level: ~60 (bullish, rising from 50 at $29.41).
Stance: Bullish (>50, not overbought).
MACD:
Status: Above signal, positive histogram.
Stance: Bullish (momentum building).
Bollinger Bands:
Status: Price near upper band ($30.60).
Stance: Bullish (breakout potential).
Donchian Channels:
Status: Above midline ($30.02).
Stance: Bullish (trend strength).
Williams %R:
Level: ~-30 (bullish, not overbought).
Stance: Bullish (>-50).
VWAP:
Status: Above VWAP (~$30.30, intraday April 11).
Stance: Bullish (buyers dominate).
ICT/SMC:
Buy-Side Liquidity: Above $30.63 (D-High), $31.35 (W-High), LVN ($31.50). Retail stops cluster here.
Sell-Side Liquidity: Below $29.41 (D-Low), $27.95 (W-Low/M-Low).
OB: Bullish OB at $29.80–$30.00 (April 10 consolidation, demand zone, near HVN $30.00).
FVG: Bullish FVG at $30.00–$30.20 (April 11 gap, unfilled, aligns with D-Open $30.12).
OTE: Fib 61.8%–78.6% from $29.41 (low) to $30.63 (high) = $30.05–$30.15 (overlaps OB/FVG/HVN).
Displacement: Potential impulsive move to $31.50 (LVN) or $29.00 (below D-Low) on Retail Sales or tariff news.
Summary: Bullish bias, with OTE ($30.05–$30.15) as entry zone post-sweep, supported by OB/FVG/HVN.
10-Minute Chart
Closing Move (April 11):
Status: Rallied to $30.52, closed near high ($30.63), strong volume.
Stance: Bullish (buyers pushed close).
EMA Direction:
Status: 8-EMA ($30.45) > 13-EMA ($30.40) > 48-EMA ($30.30), uptrend.
Stance: Bullish (EMAs rising).
RSI (14):
Level: ~65 (bullish, cooling from 70).
Stance: Bullish (>50, not overbought).
MACD:
Status: Above zero, bullish crossover.
Stance: Bullish (momentum intact).
VWAP:
Status: Above VWAP (~$30.40, late April 11).
Stance: Bullish (buyers control).
ICT/SMC:
Liquidity Sweep: Wick to $30.63 (8:50 AM, April 11) tested buy-side, no clear rejection yet.
Retracement: Potential retrace to $30.05–$30.15 (OTE) if sweep completes (e.g., April 14, 8:00 AM).
Entry Signal: Pin bar or engulfing at OTE (e.g., $30.10, 10-minute candle).
Summary: Bullish, awaiting sweep above $30.63 or $31.35, retrace to OTE for entry.
Options Data
Analysis:
GEX (Gamma Exposure):
Status: Positive GEX at $31 strike (high call OI), neutral at $30.
Impact: Dealers buy stock to hedge calls, supporting $31 pin or slight lift to $31.50.
Explanation: Positive GEX stabilizes price near high OI strikes, aligning with LVN ($31.50) sweep.
Stance: Neutral-bullish (pinning likely, breakout possible).
DEX (Delta Exposure):
Status: High call delta (+0.3, 89% call volume).
Impact: Bullish pressure, as dealers hedge calls by buying KWEB.
Explanation: Call-heavy delta fuels upside momentum, supporting buy-side sweep.
Stance: Bullish.
IV (Implied Volatility):
Status: Moderate (~25%, vs. 20–35% norm for KWEB).
Impact: Steady swings ($0.50–$1.00/day), good for ATM/OTM calls.
Explanation: Moderate IV balances premium cost and volatility, ideal for OTE entries.
Stance: Bullish (volatility supports options).
OI (Open Interest):
Status: Call-heavy (65% calls at $31, 20% at $32, 15% puts at $30).
Impact: Momentum toward $31–$32, potential pin at $31 (high OI).
Explanation: High call OI marks targets (W-High $31.35, LVN $31.50), puts at $30 guard HVN.
Stance: Bullish (calls drive upside).
Cem Karsan’s Application and Weekly Trading Breakdown:
Gamma: High at $31 (pinning risk), low at $32 (breakout potential).
Vanna: Rising IV (25% to 30% on Retail Sales) lifts calls, dealers buy KWEB, pushing to $31.50.
Charm: Near OPEX (April 18), $31 calls hold delta if ITM, spiking volatility April 17–18.
Volatility Skew: Call skew (higher IV for $32 vs. $30) favors upside breakouts.
Weekly OI (Exp. April 18): 65% calls at $31, 20% at $32. Pinning likely at $31 unless Retail Sales sparks breakout to $32.
Options Strategy:
Trade: Buy $31 calls at OTE ($30.10, April 14, 8:50 AM), premium ~$0.50.
Exit: $31.50 (W-High/LVN, premium ~$0.90), profit $0.40.
Stop: Below OB ($29.80, premium ~$0.20), risk $0.30.
R:R: 1.33:1 (adjust to 2:1 with partial exit).
ICT/SMC Tie-In: Enter post-sweep ($31.35), retrace to OTE ($30.10), target $31.50.
Vanna:
Status: IV rise (25% to 30%) amplifies calls, dealers buy KWEB.
Impact: Bullish lift to $31–$31.50, aligns with LVN sweep.
Explanation: Vanna boosts delta near high OI, supporting OTE reversal.
Charm:
Status: OPEX (April 18) nears, $31 calls gain delta if KWEB hits $31.
Impact: Volatility spikes April 17–18, favors quick OTE trades.
Explanation: Charm accelerates delta, amplifying sweep-to-OTE moves.
Timeframe Analysis:
Weekly (Exp. April 18):
OI: 65% calls ($31), 20% ($32), 15% puts ($30).
IV: Moderate (25%), rising on catalysts.
Stance: Bullish (calls dominate, breakout risk).
Monthly (Exp. May 2):
OI: Balanced (50% calls $32, 50% puts $29).
IV: Stable (~24%).
Stance: Neutral (consolidation likely).
3-Month (Exp. July 7):
OI: Call skew ($33–$35, 60% calls).
IV: Low (~22%).
Stance: Bullish (long-term upside).
Directional Bias:
Synthesis: Positive GEX ($31 pin), high call DEX (+0.3), moderate IV (25%), call-heavy OI (65% at $31), vanna (IV lift), charm (OPEX volatility), and ICT/SMC (buy-side sweep to $31.35, OTE at $30.10) suggest a bullish trend for April 14, with potential retracement post-sweep.
Why: Options data aligns with ICT/SMT (call OI = buy-side liquidity, OTE = dealer hedging zone), per AMT (LVN sweep, HVN reversal).
Action: Focus on $31 calls, highlight pinning vs. breakout. Video: “KWEB’s $31 call wall could pin or pop—perfect for an OTE play.”
Sympathy Plays
Correlated Assets:
MCHI (iShares MSCI China ETF): Tracks broader Chinese equities, rises ~2–3% if KWEB rallies (e.g., $31.50), due to shared holdings (Alibaba, Tencent).
BABA (Alibaba ADR): KWEB’s top holding, moves +3–4% on KWEB’s sweep to $31.35, driven by e-commerce/AI overlap.
Opposite Mover:
GLD (SPDR Gold ETF): Risk-off asset, fades ~1–2% if KWEB rallies (risk-on), as investors shift from safe havens to tech.
Why: Sympathy plays confirm sector momentum (Chinese tech), while GLD hedges tariff fears, per ICT/SMT sentiment.
Action: Monitor MCHI/BABA for confirmation, GLD for divergence. Video: “If KWEB pops, MCHI and BABA follow—watch gold for the flip side.”
Sector Positioning with RRG
Sector: Technology – Emerging Markets (China Internet).
RRG Position: Improving (vs. MCHI ETF).
Rationale: KWEB’s April 11 rally (+2.97%) outpaces MCHI (+2.1%), with RSI (~55) and call OI signaling strength. Tariff fears weaken absolute gains, but relative momentum grows.
Tie-In: Improving quadrant supports bullish MSS, OTE entries at HVN ($30.00).
Why: RRG aligns with sentiment (call-heavy) and technicals (above HVN), per AMT value area.
Action: Highlight Improving RRG for video: “KWEB’s gaining steam in China tech—prime for a sweep setup.”
Targets
Bullish:
Target: +3.5% to $31.60.
Levels: W-High ($31.35), LVN ($31.50), next resistance ($32.00).
Rationale: Buy-side sweep to $31.35 (W-High), breakout to LVN on Retail Sales or tariff relief, per ICT/SMC.
Bearish:
Target: -3.2% to $29.55.
Levels: D-Low ($29.41), below W-Open ($29.59), HVN ($29.50).
Rationale: Sell-side sweep below $29.41 on weak Retail Sales or tariff escalation, retracing to HVN, per AMT.
Why: Targets tie to OHLC (W-High, D-Low), HVNs/LVNs, and catalysts, ensuring ICT/SMC alignment (liquidity to OTE).
Morgan Stanley (NYSE: MS) Reports Strong Q125 ResultsMorgan Stanley (NYSE: NYSE:MS ) Beats Q1 estimates with record Equity Trading Revenue. The bank posted earnings per share (EPS) of $2.60, beating analyst expectations of $2.18. Revenue reached a record $17.74 billion, topping forecasts of $16.44 billion.
The bank's equity trading revenue soared 45% year-over-year. It reached a new high of $4.13 billion as growth came across business lines and regions. Asia showed particularly strong performance. Prime brokerage and derivatives led gains, fueled by high client activity in volatile markets.
Morgan Stanley shares dropped 1% after the earnings release. However, the stock remains up over 20% in the past year. Volatility in global markets helped trading desks outperform.
Technical Analysis
Morgan Stanley bounced sharply from the $95 support zone. Buyers stepped in near the previous breakout level. Volume increased and confirmed renewed interest. This was seen as Trump paused tariffs for the next 90 days as well. Current price action suggests a recovery trend. The RSI stands at 39, hinting at oversold conditions. A potential path points to $142.03, which acts as the immediate resistance level.
If the price breaks $113 cleanly, momentum could carry it to $130 and beyond. If it fails, it is most likely to retest $95 support level. A strong break above recent highs would confirm bullish continuation. For now, Watch out the $113 and $142 levels closely.

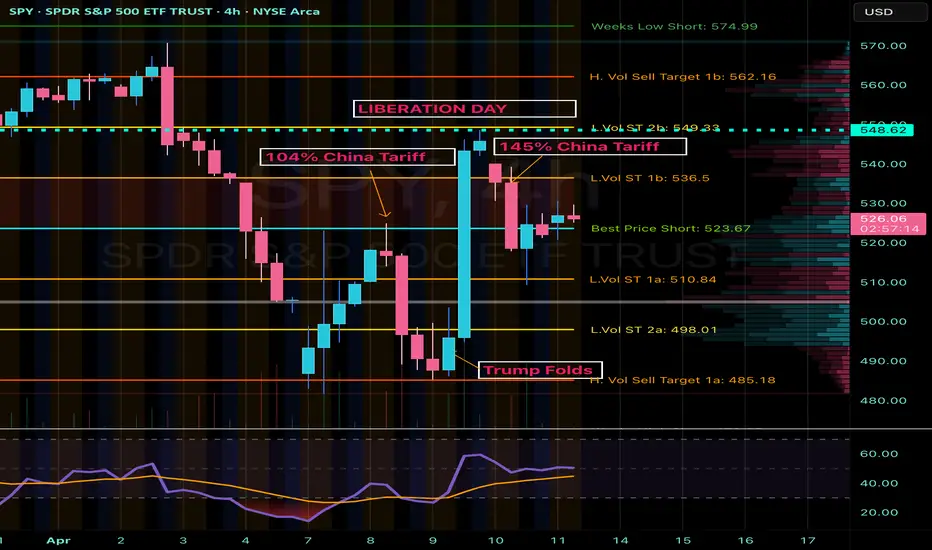
SPY Analysis: Navigating Tariff-Induced VolatilityContinuing from my last update, market volatility remains high due to Trump's unpredictable policy decisions. After initially folding and offering economic relief, Trump pivoted sharply with a sudden 145% tariff announcement. Today, China countered strongly with a 125% tariff. These escalating tariff exchanges continue to create significant uncertainty and market fluctuations, highlighting the critical need for careful analysis and precise trade management.
Technical Breakdown (4-Hour Chart)
Current Price Zone: Around $528.45
Key Resistance Levels:
- Immediate Resistance: $536.50 (L.Vol ST 1b)
- Critical Resistance: $549.33 - $549.60 (L.Vol ST 2b)
- Major Resistance Zone (Liberation Day): Approximately $562.16
Support Levels:
- Initial Support: $523.67 (Best Price Short)
- Secondary Support: $510.84 (L.Vol ST 1a)
- Important Lower Support: $498.01 (L.Vol ST 2a)
- Strong Support Level (Trump Folded area): ~$485.18
Trading Scenarios
Bullish Scenario (Potential Tariff Tension Relief):
- Entry Trigger: Confirmed breakout and sustained hold above resistance at $536.50.
Profit Targets:
- Target 1: $549.33 (next strong resistance level)
- Target 2: $562.16 (major resistance)
- Stop Loss: Below immediate support at $523.67, carefully managing downside risk.
Bearish Scenario (Ongoing Tariff Escalation or Increased Market Fear):
Entry Trigger: Inability to reclaim $536.50, or a decisive breakdown below support at $523.67.
Profit Targets:
- Target 1: $510.84 (nearest significant support)
- Target 2: $498.01 (secondary critical support)
- Target 3: $485.18 (robust support area)
- Stop Loss: Above resistance at $536.50 to protect against potential reversals.
Thought Process & Final Thoughts
The SPY currently trades within clearly defined resistance and support bands, heavily influenced by unpredictable tariff-driven headlines. Trump's volatile policy shifts and China's assertive retaliations amplify short-term market risks. Maintain flexible trading strategies, adhere strictly to established levels, and practice disciplined risk management. Continuous monitoring and swift response to evolving market sentiment will be essential for navigating this challenging environment effectively.