China50 Target Locked | Long Setup via Thief Strategy🏴☠️ CHINA50 Market Robbery Blueprint 🔥 | Thief Trading Style (Swing/Day Plan)
🌍 Hey Money Makers, Chart Hackers, and Global Robbers! 💰🤑💸
Welcome to the new Heist Plan by your favorite thief in the game — this time targeting the CHINA50 Index CFD like a smooth criminal on the charts. 🎯📊
This is not your average technical analysis — it's a strategic robbery based on Thief Trading Style™, blending deep technical + fundamental analysis, market psychology, and raw trader instincts.
💼 THE SETUP — PREPARE FOR THE ROBBERY 🎯
We're looking at a bullish operation, setting up to break into the high-value vaults near a high-risk, high-reward resistance zone — beware, it's a high-voltage trap area where pro sellers and bearish robbers set their ambush. ⚡🔌
This plan includes a layered DCA-style entry, aiming for max profit with controlled risk. Chart alarms on, mindset ready. 🧠📈🔔
🟢 ENTRY: "The Robbery Begins"
📍 Zone-1 Buy: Near 0.63700 after MA pullback
📍 Zone-2 Buy: Near 0.62800 deeper pullback
🛠️ Entry Style: Limit Orders + DCA Layering
🎯 Wait for MA crossover confirmations and price reaction zones — don’t chase, trap the market.
🔻 STOP LOSS: "Plan the Escape Route"
⛔ SL for Pullback-1: 13540 (4H swing low)
⛔ SL for Pullback-2: 13350
📌 SL placement depends on your position sizing & risk management. Control the loss; live to rob another day. 🎭💼
🎯 TARGET ZONE: “Cash Out Point”
💸 First TP: 14100
🏁 Let the profit ride if momentum allows. Use a trailing SL once it moves in your favor to lock in gains.
👀 Scalpers Note:
Only play the long side. If your capital is heavy, take early moves. If you’re light, swing it with the gang. Stay on the bullish train and avoid shorting traps. Use tight trailing SL.
🔎 THE STORY BEHIND THE HEIST – WHY BULLISH?
CHINA50 shows bullish momentum driven by:
💹 Technical bounce off major support
🌏 Macroeconomic & geopolitical sentiment
📰 Volume + sentiment shift (risk-on)
📈 Cross-market index confirmation
🧠 Smart traders are preparing, not reacting. Stay ahead of the herd.
👉 For deeper insight, refer to:
✅ Macro Reports
✅ COT Data
✅ Intermarket Correlations
✅ CHINA-specific index outlooks
⚠️ RISK WARNING – TRADING EVENTS & VOLATILITY
🗓️ News releases can flip sentiment fast — we advise:
❌ Avoid new positions during high-impact events
🔁 Use trailing SLs to protect profit
🔔 Always manage position sizing and alerts wisely
❤️ SUPPORT THE CREW | BOOST THE PLAN
Love this analysis? Smash that Boost Button to power the team.
Join the Thief Squad and trade like legends — Steal Smart, Trade Sharp. 💥💪💰
Every day in the market is a new heist opportunity — if you have a plan. Stay tuned for more wild robbery blueprints.
📌 This is not financial advice. Trade at your own risk. Adjust based on your personal strategy and capital. Market conditions evolve fast — stay updated, stay alert.
Chinaindex

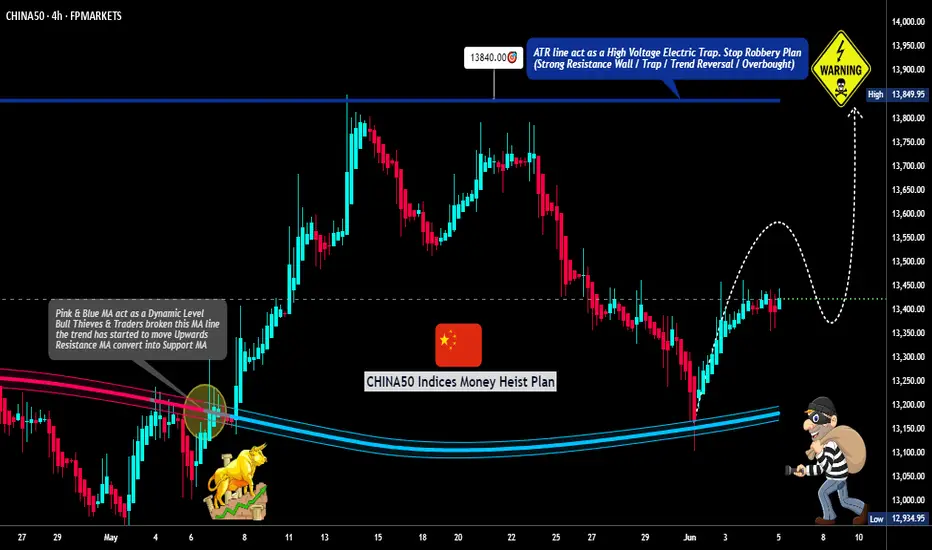
"CHINA50 Money Heist: Will You Join the Gang or Get Robbed?"🚨 CHINA50 HEIST ALERT: Bullish Loot & Trap Escape Plan! 🚨
🌟 Hi! Hola! Ola! Bonjour! Hallo! Marhaba! 🌟
Dear Money Makers & Market Robbers, 🤑💰💸✈️
Based on 🔥Thief Trading Style🔥 (technical + fundamental analysis), we’re plotting the ultimate heist on the CHINA50 Index Cash market! Our master plan focuses on a long entry—targeting the high-risk Red Zone (overbought, consolidation, potential reversal). Beware: Bears are lurking, and traps are set! 🏆💸 Book profits fast, stay wealthy, and trade safe! 💪🎉
🔓 ENTRY: The Vault Is Open – Swipe the Bullish Loot!
Buy Limit Orders: Place within 15-30min (recent swing low/high).
Alert Recommended! Don’t miss the heist.
🛑 STOP LOSS: Escape Route
Set near the latest swing low or below 4H MA (~13150.00).
Adjust based on risk, lot size, and multiple orders.
🎯 TARGET: 13840.00 (or Run Before It Hits!)
Scalpers: Only long-side plays! Use trailing SL to lock profits.
Swing Traders: Execute the robbery plan patiently.
📡 MARKET INTEL: Why CHINA50 is a Bullish Target
Fundamental Drivers: Macro trends, COT data, geopolitics, sentiment.
Intermarket & Index-Specific Factors in play.
👉 For full analysis, check the linkss below! 🔗🔗
⚠️ TRADING ALERTS: News & Position Safety
Avoid new trades during high-impact news.
Trailing SL is a MUST to protect profits.
💥 BOOST THE HEIST! Hit Like & Follow!
Support the plan → More profits → Easier robberies! 💰🚀
Stay tuned for the next heist! 🤑🐱👤🤩
"CHINA50" Index CFD Market Bullish Heist Plan (Day or Swing)🌟Hi! Hola! Ola! Bonjour! Hallo! Marhaba!🌟
Dear Money Makers & Robbers, 🤑 💰💸✈️
Based on 🔥Thief Trading style technical and fundamental analysis🔥, here is our master plan to heist the "CHINA50" Index CFD Market. Please adhere to the strategy I've outlined in the chart, which emphasizes long entry. Our aim is the high-risk ATR Line. Risky level, overbought market, consolidation, trend reversal, trap at the level where traders and bearish robbers are stronger. 🏆💸"Take profit and treat yourself, traders. You deserve it!💪🏆🎉
Entry 📈 : "The heist is on! Wait for the MA breakout (13300) then make your move - Bullish profits await!"
however I advise to Place Buy stop orders above the Moving average (or) Place buy limit orders within a 15 or 30 minute timeframe most recent or swing, low or high level.
📌I strongly advise you to set an "alert (Alarm)" on your chart so you can see when the breakout entry occurs.
Stop Loss 🛑: "🔊 Yo, listen up! 🗣️ If you're lookin' to get in on a buy stop order, don't even think about settin' that stop loss till after the breakout 🚀. You feel me? Now, if you're smart, you'll place that stop loss where I told you to 📍, but if you're a rebel, you can put it wherever you like 🤪 - just don't say I didn't warn you ⚠️. You're playin' with fire 🔥, and it's your risk, not mine 👊."
📍 Thief SL placed at the nearest/swing low level Using the 4H timeframe (13000) Day / Swing trade basis.
📍 SL is based on your risk of the trade, lot size and how many multiple orders you have to take.
🏴☠️Target 🎯: 13800 (or) Escape Before the Target
🧲Scalpers, take note 👀 : only scalp on the Long side. If you have a lot of money, you can go straight away; if not, you can join swing traders and carry out the robbery plan. Use trailing SL to safeguard your money 💰.
💰💵💸"CHINA50" Index Market Heist Plan (Swing/Day Trade) is currently experiencing a Bullish trend.., driven by several key factors.☝☝☝
📰🗞️Get & Read the Fundamental, Macro, COT Report, Geopolitical and News Analysis, Sentimental Outlook, Intermarket Analysis, Index-Specific Analysis, Future trend targets with Overall outlook score... go ahead to check 👉👉👉🔗🔗
⚠️Trading Alert : News Releases and Position Management 📰 🗞️ 🚫🚏
As a reminder, news releases can have a significant impact on market prices and volatility. To minimize potential losses and protect your running positions,
we recommend the following:
Avoid taking new trades during news releases
Use trailing stop-loss orders to protect your running positions and lock in profits
💖Supporting our robbery plan 💥Hit the Boost Button💥 will enable us to effortlessly make and steal money 💰💵. Boost the strength of our robbery team. Every day in this market make money with ease by using the Thief Trading Style.🏆💪🤝❤️🎉🚀
I'll see you soon with another heist plan, so stay tuned 🤑🐱👤🤗🤩

Phantom Heist: Sniping CHINA50 Longs for Epic Loot!🌍 Salutations, worldly wealth seekers! Ola! ✨
Dear Coin Conquerors & Chart Corsairs, 💸⚔️
Crafted in the 🔥 Phantom Trader’s cauldron of technical wizardry and fundamental finesse 🔥, behold our cunning plot to pillage the “CHINA50” Index Market. Follow the chart’s secret map, zeroing in on long entries. Our prize? Slip away near the treacherous ATR Red Zone, where overbought whispers, consolidation, reversals, and ambushes lurk, with bearish bandits poised to strike. 🦹♂️💰 “Secure your loot and treat yourself, traders—you’re a force to be reckoned with!” 🎊💥
**Entry 📊**: The vault’s cracked open! Seize the bullish bounty at current prices—the heist is on!
For precision strikes, set buy limit orders on a 15 or 30-minute chart at the latest swing low or high. Pro move: activate chart alerts to stay ahead of the game!
**Stop Loss 🛑**:
📍 Phantom SL planted at the recent swing low on the 8H timeframe (13500.00) for day or swing trades.
📍 Tweak SL to match your risk appetite, lot size, and open orders.
**Target 🎯**: Eye 14350.00—or vanish early if the market gets slippery!
🧨 **Scalpers, keep your wits!** 👁️: Stick to long-side scalps. Deep pockets? Dive in now! Lighter funds? Join swing traders for the caper. Use trailing SL to protect your treasure 💎.
💴 **CHINA50 Market Raid (Swing Trade Snapshot)**: Hovering in neutral territory with a bullish flicker, fueled by pivotal market tides. ☝
📰 **Uncover the full story**: Dive into Fundamental Signals, Macro Trends, COT Insights, Geopolitical Waves, Sentiment Cues, Intermarket Links, Index Drivers, Positioning, and Future Targets for the complete intel! 👉🔗🌎
⚠️ **Trade Warning: News & Position Strategy** 🗳️🚨
Market-moving news can stir chaos like a storm. Safeguard your gains:
- Avoid new trades during news drops.
- Use trailing stop-losses to lock profits and defend open positions.
💪 **Fuel our plunder!** 💥 Hit the Boost Button 💥 to supercharge our profit-grabbing game. Join the Phantom Trading Style crew and stack riches daily with flair. 🏅🤝🚀
Rendezvous at the next market ambush—stay sharp! 🤑🐆🎯

"CHINA 50" Index CFD Market Heist Plan (Scalping/Day Trade)🌟Hi! Hola! Ola! Bonjour! Hallo! Marhaba!🌟
Dear Money Makers & Robbers, 🤑💰✈️
Based on 🔥Thief Trading style technical and fundamental analysis🔥, here is our master plan to heist the "CHINA 50" Index CFD Market. Please adhere to the strategy I've outlined in the chart, which emphasizes short entry. Our aim is the high-risk Green Zone. Risky level, oversold market, consolidation, trend reversal, trap at the level where traders and bullish robbers are stronger. 🏆💸Book Profits Be wealthy and safe trade.💪🏆🎉
Entry 📈 : "The vault is wide open! Swipe the Bearish loot at any price - the heist is on!
however I advise to Place sell limit orders within a 15 or 30 minute timeframe most nearest or swing, low or high level.
Stop Loss 🛑: (13400) Thief SL placed at the nearest / swing high level Using the 8H timeframe swing / day trade basis.
SL is based on your risk of the trade, lot size and how many multiple orders you have to take.
Target 🎯: 12950 (or) Escape Before the Target
🧲Scalpers, take note 👀 : only scalp on the Short side. If you have a lot of money, you can go straight away; if not, you can join swing traders and carry out the robbery plan. Use trailing SL to safeguard your money 💰.
"CHINA 50" Index CFD Market Heist Plan (Swing/Day) is currently experiencing a bearishness,., driven by several key factors.
📰🗞️Get & Read the Fundamental, Macro Economics, COT Report, Geopolitical and News Analysis, Sentimental Outlook, Intermarket Analysis, Index-Specific Analysis, Positioning and future trend targets... go ahead to check 👉👉👉🔗
⚠️Trading Alert : News Releases and Position Management 📰 🗞️ 🚫🚏
As a reminder, news releases can have a significant impact on market prices and volatility. To minimize potential losses and protect your running positions,
we recommend the following:
Avoid taking new trades during news releases
Use trailing stop-loss orders to protect your running positions and lock in profits
💖Supporting our robbery plan 💥Hit the Boost Button💥 will enable us to effortlessly make and steal money 💰💵. Boost the strength of our robbery team. Every day in this market make money with ease by using the Thief Trading Style.🏆💪🤝❤️🎉🚀
I'll see you soon with another heist plan, so stay tuned 🤑🐱👤🤗🤩

ChinaH Index – Mid-Term Technical OutlookThe ChinaH Index is currently trading at $8,390, after recently rejecting the key resistance level of $9,200, a historically significant zone last tested in 2021. Despite this rejection, the index remains well-positioned within a strong and intact bullish channel, signaling long-term upward momentum.
Current Setup:
We are now observing a short-term relief bounce from $8,390, with potential to retest the $8,700 area. This move is part of a broader technical structure that suggests a healthy pullback phase before resuming long-term growth.
Pullback Scenario:
Following the potential retest of $8,700, the index may enter a correction phase, targeting $7,600 as a core support level—this zone previously acted as resistance in 2022 and is likely to serve as strong structural support heading into mid-2025.
Before reaching $7,600, the first interim support sits at $8,200, a level that previously served as support in 2020 and triggered the recent bounce. If $8,200 fails to hold during the retracement, a deeper correction toward $7,600 would allow for stronger consolidation and improved structural health within the overall bullish channel.
Two Potential Bullish Scenarios After Pullback:
Continuation within the Current Bullish Channel:
A bounce from $7,600 would resume upward momentum.
Primary upside target: $9,700 – a key multi-year resistance zone from 2017–2020.
A clean breakout above $9,700 would confirm a long-term bullish breakout and shift market sentiment decisively.
Formation of a New Bullish Channel:
In the event of prolonged consolidation, price could range between $7,100–$8,700 from September to December 2025.
A breakout in January 2026 would confirm a new ascending structure, offering a refreshed bullish path with long-term upside.
Key Levels to Watch:
Resistance: $8,700 → $9,200 → $9,700 (Major Breakout Zone)
Support: $8,200 → $7,600 → $7,100 (Range Floor if prolonged consolidation)
Summary:
While short-term pullbacks may test market resilience, the underlying bullish structure remains intact. A correction to $7,600 could act as a launchpad for the next major leg higher. Whether through continuation in the current channel or the formation of a new one, the ChinaH Index presents multiple bullish pathways, with $9,700 being the key level that could signal a long-term shift in trend.
Patience and disciplined positioning in the upcoming months will be crucial as we watch for confirmation of the next directional move.

CHINA 50 Index Cash Market Bullish Heist Plan🌟Hi! Hola! Ola! Bonjour! Hallo! Marhaba!🌟
Dear Money Makers & Robbers, 🤑 💰💸✈️
Based on 🔥Thief Trading style technical and fundamental analysis🔥, here is our master plan to heist the "CHINA 50 Index Cash" market. Please adhere to the strategy I've outlined in the chart, which emphasizes long entry. Our aim is the high-risk Red Zone. Risky level, overbought market, consolidation, trend reversal, trap at the level where traders and bearish robbers are stronger. 🏆💸Book Profits Be wealthy and safe trade.💪🏆🎉
Entry 📈 : "The vault is wide open! Swipe the Bullish loot at any price - the heist is on!
however I advise to Place buy limit orders within a 15 or 30 minute timeframe most recent or swing, low or high level. I Highly recommended you to put alert in your chart.
Stop Loss 🛑:
Thief SL placed at the recent / nearest low level Using the 4H timeframe (13100) swing trade basis.
SL is based on your risk of the trade, lot size and how many multiple orders you have to take.
Target 🎯: 14400 (or) Escape Before the Target
🧲Scalpers, take note 👀 : only scalp on the Long side. If you have a lot of money, you can go straight away; if not, you can join swing traders and carry out the robbery plan. Use trailing SL to safeguard your money 💰.
"CHINA 50 Index Cash" Market is currently experiencing a Neutral trend to Bearish., driven by several key factors.
📰🗞️Read the Fundamental, Macro Economics, COT Report, Seasonal Factors, Intermarket Analysis, Sentimental Outlook, Future trend predict.
Before start the heist plan read it.👉👉👉
📌Keep in mind that these factors can change rapidly, and it's essential to stay up-to-date with market developments and adjust your analysis accordingly.
⚠️Trading Alert : News Releases and Position Management 📰 🗞️ 🚫🚏
As a reminder, news releases can have a significant impact on market prices and volatility. To minimize potential losses and protect your running positions,
we recommend the following:
Avoid taking new trades during news releases
Use trailing stop-loss orders to protect your running positions and lock in profits
💖Supporting our robbery plan 💥Hit the Boost Button💥 will enable us to effortlessly make and steal money 💰💵. Boost the strength of our robbery team. Every day in this market make money with ease by using the Thief Trading Style.🏆💪🤝❤️🎉🚀
I'll see you soon with another heist plan, so stay tuned 🤑🐱👤🤗🤩

ChinaH Index: New Era of Economic Power and Market DominanceIn the current global economic shift, China is emerging as the leading force across multiple sectors, including economy, corporations, artificial intelligence, quantum technologies, and international alliances. With the U.S. facing economic struggles, including growing national debt, loss of investor confidence, and strained alliances, China is solidifying its position as the world's dominant economic power.
At $8,900, the ChinaH Index is in a strong bullish channel, following an impressive 34% rally from $6,700 on January 11 to its current level. Moving forward, there are two key scenarios that could play out:
Scenario 1: Healthy Pullback Before Resuming Growth
After reaching $9,000, the index could experience a natural correction to $7,600, allowing for a stronger consolidation phase.
This level would provide a solid base for the next bullish breakout, targeting $10,000 by mid-2025.
Scenario 2: Market Overextension and Historical Price Repetition
If the bullish momentum overextends, we could see a push toward $9,400–$9,800, representing a 44% rise, similar to past price movements.
The $9,700 level is a historically significant support zone from 2017–2020, making it a critical battleground for further gains.
A successful break above this level could send the index soaring toward $10,000 by July 2025, further reinforcing China’s dominance in the new global order.
Key Levels to Watch
$8,000 Support → A strong base in the new world economy. If it holds, further upside is likely.
$9,700 Resistance → A critical level from 2017–2020, which, if broken, confirms a long-term bullish shift.
$10,000 Target → A key psychological and technical milestone expected by mid-2025.
Conclusion: The ChinaH Index Reflects China’s Growing Global Influence
With shifting global economic dynamics favoring China, the ChinaH Index is positioned for long-term growth. If $8,000 holds, a breakout beyond $9,700 could confirm China’s continued financial dominance, leading to a potential target of $10,000 by July 2025. The next few months will be crucial in determining whether the market corrects before resuming its bullish trajectory or pushes straight toward new highs.

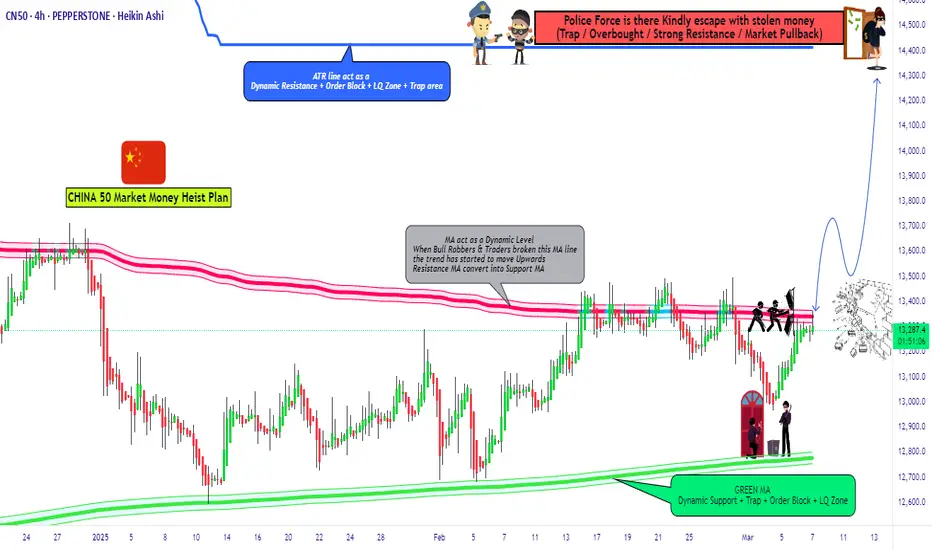
CN50 / CHINA50 Indices CFD Market Heist Plan🌟Hi! Hola! Ola! Bonjour! Hallo! Marhaba!🌟
Dear Money Makers & Thieves, 🤑 💰🐱👤✈️
Based on 🔥Thief Trading style technical and fundamental analysis🔥, here is our master plan to heist the CN50 / CHINA50 Indices CFD market. Please adhere to the strategy I've outlined in the chart, which emphasizes long entry. Our aim is the high-risk Red Zone. Risky level, overbought market, consolidation, trend reversal, trap at the level where traders and bearish robbers are stronger. 🏆💸Book Profits wealthy and safe trade.💪🏆🎉
Entry 📈 : "The heist is on! Wait for the MA breakout (13500) then make your move - Bullish profits await!"
however I advise to Place Buy stop orders above the Moving average (or) Place buy limit orders within a 15 or 30 minute timeframe most recent or swing, low or high level.
📌I strongly advise you to set an alert on your chart so you can see when the breakout entry occurs.
Stop Loss 🛑:
Thief SL placed at the recent/swing low or high level Using the 4H timeframe (13150) swing trade basis.
SL is based on your risk of the trade, lot size and how many multiple orders you have to take.
Target 🎯: 14400 (or) Escape Before the Target
🧲Scalpers, take note 👀 : only scalp on the Long side. If you have a lot of money, you can go straight away; if not, you can join swing traders and carry out the robbery plan. Use trailing SL to safeguard your money 💰.
📰🗞️Fundamental, Macro, COT Report, On Chain analysis, Sentimental Outlook etc....
CN50 / CHINA50 Indices CFD market is currently experiencing a Bearish to Bullish 🐃 trend,., driven by several key factors.
➤🔰 Fundamental Analysis
Fundamental factors assess the intrinsic drivers of the CHINA50:
Economic Growth:
China’s GDP growth is projected at 4.5% for 2025 (per IMF estimates), down from 4.9% in 2024, reflecting slower private consumption and export contributions—bearish signal.
Policy Support:
Aggressive fiscal stimulus (e.g., RMB 5tn local government debt quotas) and monetary easing (PBoC rate cuts to 3%) aim to counter deflation and boost sentiment—bullish counterweight.
Corporate Earnings:
A50 companies (e.g., Kweichow Moutai, CATL) show mixed results: consumer staples hold steady, but tech and industrials face margin pressure from tariffs—neutral to bearish.
Trade Environment:
Trump’s tariffs (25% on Mexico/Canada, 10% on China) reduce export competitiveness, though transshipments may mitigate impact—bearish short-term, neutral long-term.
Property Sector:
Stabilization efforts (e.g., debt restructuring) reduce drag, but residential investment remains weak—neutral, with upside potential.
Explanation: Fundamentals are mixed—stimulus supports the index, but slower growth and trade pressures weigh it down, suggesting cautious optimism.
➤🔰 Macroeconomic Factors
Macroeconomic conditions globally and domestically influence the CHINA50:
China:
Inflation at 1.5% (core), negative output gap (-0.5%)—subdued demand pressures growth—bearish.
PBoC easing and fiscal expansion (4% deficit) signal robust support—bullish offset.
U.S.:
Fed rates at 3-3.5%, PCE 2.6%—USD softening (DXY ~105) aids Chinese exports—bullish for CHINA50.
Tariffs disrupt trade flows—bearish short-term impact.
Eurozone:
PMI 46.2 (Eurostat)—stagnation reduces demand for Chinese goods—bearish.
ECB at 2.5% supports global liquidity—mildly bullish.
Global:
Japan 1%, emerging markets mixed—slow growth limits export recovery—bearish.
Oil at $70.44—stable costs, neutral for Chinese firms.
Explanation: Macro factors tilt bearish due to global slowdown and tariffs, but domestic stimulus and USD weakness provide a bullish buffer.
➤🔰 Commitments of Traders (COT) Data
COT data reflects futures positioning:
Speculators:
Net long ~30,000 contracts (down from 40,000 at 2025 peak)—cautious optimism, suggesting room for upside—bullish.
Hedgers:
Net short ~35,000 contracts—stable, profit-taking by producers—neutral.
Open Interest:
~70,000 contracts—steady interest indicates sustained market focus—neutral to bullish.
Explanation: COT shows a balanced market—not overbought, with speculators still favoring upside, supporting a bullish lean despite recent cooling.
➤🔰 Geopolitical and News Analysis
Geopolitical events and news impacting the CHINA50:
U.S.-China Trade Tensions:
Trump’s 10% tariff on Chinese imports (escalated from earlier threats) strains exports—bearish. China vows to “resolutely counter” (Reuters, Mar 7), hinting at retaliatory measures—mixed short-term volatility, bearish long-term if unresolved.
National People’s Congress (NPC):
“Two Sessions” (Mar 5-7) set a 5% GDP target, upped defense spending 7.2%, and issued RMB 1.3tn in special bonds (CNBC, Mar 6)—bullish domestic signal, but analysts doubt sufficiency against trade headwinds (SCMP, Mar 6).
Global South Appeal:
Foreign Minister Wang Yi positions China as a stable power amid U.S. “chaos” (Bloomberg, Mar 7)—bullish for investor confidence in emerging markets.
Property Sector:
Ongoing stabilization efforts noted at NPC—neutral, reducing systemic risk but not yet driving growth.
Explanation: Geopolitical tensions (tariffs) weigh heavily, but NPC stimulus and China’s global positioning provide bullish offsets, creating a volatile yet supported outlook.
➤🔰 Intermarket Analysis
Relationships with other markets:
USD/CNY:
At 7.20 (hypothetical)—weaker yuan vs. USD aids exports, bullish for CHINA50, though tariff impact mutes gains—mixed.
Hang Seng Index:
~20,000 (assumed)—strong correlation with CHINA50, reflects similar stimulus/tariff dynamics—neutral to bullish.
S&P 500:
~5,990—range-bound, neutral correlation; U.S. risk-off could lift CHINA50 via safe-haven flows—mildly bullish.
Commodities:
Oil $70.44, iron ore $100/ton—stable, neutral for Chinese industrials; gold $2,930 signals risk-off—bullish for China as a hedge market.
Bond Yields:
China 10-year 2.5% vs. U.S. 3.8%—yield gap supports capital inflows—bullish.
Explanation: Intermarket signals are mixed—USD/CNY and bonds favor CHINA50, but global equities and commodities suggest cautious stability.
➤🔰 Index-Specific Analysis
Factors unique to the CHINA50:
Technical Levels:
50-day SMA ~13,400, 200-day SMA ~12,800—price below 50-day but above 200-day signals consolidation—neutral.
Support at 13,200, resistance at 13,500—current price tests support.
Sector Composition:
Financials (40%), consumer goods (25%), tech (20%)—financials steady, tech hit by tariffs—mixed impact.
Volatility Index:
Implied volatility at 18%—moderate, suggesting ±200-point daily swings—neutral.
Market Breadth:
60% of A50 stocks above 200-day MA—broad participation, mildly bullish.
Explanation: Technicals and composition suggest a market in transition—neither strongly bullish nor bearish, with potential to swing based on catalysts.
➤🔰 Market Sentiment Analysis
Investor and trader mood:
Retail Sentiment:
55% short at 13,260 (trending on X)—contrarian upside potential—bullish signal.
Institutional:
Mixed—Morgan Stanley sees volatility, Goldman targets 14,000 by Q4 2025—neutral to bullish.
Corporate:
Firms hedge at 13,500-13,600—neutral, awaiting clarity on trade.
Explanation: Sentiment leans bearish short-term due to trade uncertainty, but retail shorts and institutional targets hint at bullish recovery potential.
➤🔰 Next Trend Move
Projected price movements:
Short-Term (1-2 Weeks):
Range: 13,200-13,500.
Dip to 13,200 if trade data disappoints; rebound to 13,500 if stimulus details emerge.
Medium-Term (1-3 Months):
Range: 13,000-14,000.
Below 13,200 targets 13,000; above 13,500 aims for 14,000, driven by policy clarity.
Catalysts: Trade balance, tariff developments, PBoC actions.
Explanation: The index is at a pivot—short-term downside risks from external pressures, medium-term upside from domestic support.
➤🔰 Overall Summary Outlook
CHINA50 at 13,260.00 balances bearish pressures (global slowdown, tariffs, post-rally correction) with bullish drivers (stimulus, USD softness, COT longs). Technicals suggest consolidation, sentiment is cautious but not panicked, and fundamentals favor long-term recovery. Short-term, a dip to 13,200 is likely, with medium-term upside to 14,000 if policy offsets trade headwinds.
➤🔰 Future Prediction
Bullish: 14,000-14,500 by Q3 2025 if stimulus scales up, tariffs soften, and global demand rebounds—60% probability.
Bearish: 12,800-13,000 if tariffs escalate, growth falters, or stimulus disappoints—40% probability.
Prediction: Bearish short-term to 13,200 (trade uncertainty), then bullish to 14,000 by mid-2025 (policy support prevails).
📌Keep in mind that these factors can change rapidly, and it's essential to stay up-to-date with market developments and adjust your analysis accordingly.
⚠️Trading Alert : News Releases and Position Management 📰 🗞️ 🚫🚏
As a reminder, news releases can have a significant impact on market prices and volatility. To minimize potential losses and protect your running positions,
we recommend the following:
Avoid taking new trades during news releases
Use trailing stop-loss orders to protect your running positions and lock in profits
💖Supporting our robbery plan 💥Hit the Boost Button💥 will enable us to effortlessly make and steal money 💰💵. Boost the strength of our robbery team. Every day in this market make money with ease by using the Thief Trading Style.🏆💪🤝❤️🎉🚀
I'll see you soon with another heist plan, so stay tuned 🤑🐱👤🤗🤩
CHINA50 CFD Index Market Bullish Heist Plan🌟Hi! Hola! Ola! Bonjour! Hallo!🌟
Dear Money Makers & Robbers, 🤑 💰
Based on 🔥Thief Trading style technical and fundamental analysis🔥, here is our master plan to heist the CHINA50 CFD Index Market. Please adhere to the strategy I've outlined in the chart, which emphasizes long entry. Our aim is the high-risk Red Zone. Risky level, overbought market, consolidation, trend reversal, trap at the level where traders and bearish robbers are stronger. Be wealthy and safe trade.💪🏆🎉
Entry 📈 : "The heist is on! Wait for the breakout (13100.0) then make your move - Bullish profits await!"
however I advise placing Buy limit orders within a 15 or 30 minute timeframe. Entry from the most recent or closest low or high level should be in retest.
Stop Loss 🛑: Using the 2H period, the recent / nearest low or high level.
Goal 🎯: 13600.0 (or) Escape Before the Target
Scalpers, take note 👀 : only scalp on the Long side. If you have a lot of money, you can go straight away; if not, you can join swing traders and carry out the robbery plan. Use trailing SL to safeguard your money 💰.
📰🗞️Fundamental, Macro, COT, Sentimental Outlook:
🟡Fundamental Analysis:
The Chinese government's stimulus measures have managed to partially stabilize the economy, but the threat of tariffs poses a significant risk.
China's manufacturing activity has rebounded, with the Caixin PMI reaching 50.3, its highest level in seven months.
🟠Macro Economic Analysis:
The ongoing trade tensions between the US and China are a significant risk factor for the Chinese economy.
The threat of tariffs poses a risk to China's export outlook and trade balance.
🟢COT Analysis:
Institutional traders are currently net long on the China 50 Index, indicating a bullish sentiment.
🔴Sentimental Analysis:
Retail traders are currently bearish on the China 50 Index, with a sentiment ratio of 45% bullish to 55% bearish.
Institutional traders are currently bullish on the China 50 Index, with a sentiment ratio of 60% bullish to 40% bearish.
🔵Institutional Trader Positioning:
Institutional traders are currently net long on the China 50 Index, with a positioning ratio of 62% long to 38% short.
🟤Retail Trader Positioning:
Retail traders are currently net short on the China 50 Index, with a positioning ratio of 55% short to 45% long.
Please note that these percentages are approximate and based on general market sentiment. They should not be taken as investment advice.
⚠️Trading Alert : News Releases and Position Management 📰 🗞️ 🚫🚏
As a reminder, news releases can have a significant impact on market prices and volatility. To minimize potential losses and protect your running positions,
we recommend the following:
Avoid taking new trades during news releases
Use trailing stop-loss orders to protect your running positions and lock in profits
📌Please note that this is a general analysis and not personalized investment advice. It's essential to consider your own risk tolerance and market analysis before making any investment decisions.
📌Keep in mind that these factors can change rapidly, and it's essential to stay up-to-date with market developments and adjust your analysis accordingly.
💖Supporting our robbery plan will enable us to effortlessly make and steal money 💰💵 Tell your friends, Colleagues and family to follow, like, and share. Boost the strength of our robbery team. Every day in this market make money with ease by using the Thief Trading Style.🏆💪🤝❤️🎉🚀
I'll see you soon with another heist plan, so stay tuned 🫂

CHINA 50 Index CFD Market Heist Plan🌟Hi! Hola! Ola! Bonjour! Hallo!🌟
Dear Money Makers & Robbers, 🤑 💰
Based on 🔥Thief Trading style technical and fundamental analysis🔥, here is our master plan to heist the CHINA 50 Index CFD market. Please adhere to the strategy I've outlined in the chart, which emphasizes long & Short entry. 👀 Be wealthy and safe trade 💪🏆🎉
Entry 📈 : You can enter a Bull or Bear trade at any point after the breakout.
Buy entry above 13100
Sell Entry below 12750
Stop Loss 🛑: Using the 2H period, the recent / nearest Pullbacks.
Goal 🎯: Bullish Robbers TP 13600 (or) Escape Before the Target
Bearish Robbers TP 12300 (or) Escape Before the Target
Fundamental Outlook 📰🗞️
From a technical standpoint, the China 50 index is currently showing neutral signals . The Relative Strength Index (14) and Stochastic %K (14, 3, 3) are indicating neither overbought nor oversold conditions. Additionally, the Moving Averages are also neutral, suggesting that the index is trading sideways.
Macro Analysis 📰🗞️
Macroeconomic indicators play a significant role in determining the overall trend of the China 50 index. Some key indicators to watch include:
GDP Growth Rate: A growing economy can lead to a bull run, while a slowing economy can lead to a bearish trend.
Inflation Rate: High inflation can lead to monetary policy tightening, which can negatively impact the index.
Interest Rates: Lower interest rates can boost economic growth, leading to a bull run.
Trade Balance: A trade surplus can lead to a strong currency, which can negatively impact exports and the index.
It's essential to monitor these indicators and adjust your analysis accordingly.
Trading the China 50 Index
If you're looking to trade the China 50 index, consider the following:
FTSE China A50 Index: This index represents the 50 largest and most liquid Chinese stocks ³.
CSI 300: This index tracks the performance of the 300 largest and most liquid Chinese stocks.
MSCI China Index: This index represents the performance of the Chinese equity market.......
Trading Alert⚠️ : News Releases and Position Management 📰 🗞️ 🚫🚏
As a reminder, news releases can have a significant impact on market prices and volatility. To minimize potential losses and protect your running positions,
we recommend the following:
Avoid taking new trades during news releases
Use trailing stop-loss orders to protect your running positions and lock in profits
Please note that this is a general analysis and not personalized investment advice. It's essential to consider your own risk tolerance and market analysis before making any investment decisions.
Keep in mind that these factors can change rapidly, and it's essential to stay up-to-date with market developments and adjust your analysis accordingly.
💖Supporting our robbery plan will enable us to effortlessly make and steal money 💰💵 Tell your friends, Colleagues and family to follow, like, and share. Boost the strength of our robbery team. Every day in this market make money with ease by using the Thief Trading Style.🏆💪🤝❤️🎉🚀
I'll see you soon with another heist plan, so stay tuned 🫂

"CHINA50" Index Market Bullish Heist PlanHola! Ola! My Dear Robbers / Money Makers & Losers, 🤑 💰
This is our master plan to Heist "CHINA50" Index Market based on Thief Trading style Technical Analysis.. kindly please follow the plan I have mentioned in the chart focus on Long entry. Our target is Red Zone that is High risk Dangerous level, market is overbought / Consolidation / Trend Reversal / Trap at the level Bearish Robbers / Traders gain the strength. Be safe and be careful and Be rich.
Entry 📈 : Can be taken Anywhere, What I suggest you to Place Buy Limit Orders in 15mins Timeframe Recent / Nearest Low Point take entry should be in pullback.
Stop Loss 🛑 : Recent Swing Low using 4H timeframe
Target 🎯 : 15.200
Attention for Scalpers : Focus to scalp only on Long side, If you've got a lot of money you can get out right away otherwise you can join with a swing trade robbers and continue the heist plan, Use Trailing SL to protect our money 💰.
Warning : Fundamental Analysis news 📰 🗞️ comes against our robbery plan. our plan will be ruined smash the Stop Loss 🚫🚏. Don't Enter the market at the news update.
Loot and escape on the target 🎯 Swing Traders Plz Book the partial sum of money and wait for next breakout of dynamic level / Order block, Once it is cleared we can continue our heist plan to next new target.
💖Support our Robbery plan we can easily make money & take money 💰💵 Follow, Like & Share with your friends and Lovers. Make our Robbery Team Very Strong Join Ur hands with US. Loot Everything in this market everyday make money easily with Thief Trading Style.
Stay tuned with me and see you again with another Heist Plan..... 🫂

CHINA 50 Index Market Money Heist Plan on Bearish Side.Ola! Ola! My Dear Robbers / Money Makers & Losers, 🤑💰
This is our master plan to Heist CHINA 50 Index Market based on Thief Trading style Technical Analysis.. kindly please follow the plan I have mentioned in the chart focus on Short entry. Our target is Green Zone that is High risk Dangerous level, market is oversold / Consolidation / Trend Reversal / Trap at the level Bullish Robbers / Traders gain the strength. Be safe and be careful and Be rich 💰.
Entry 👇 📉: Can be taken Anywhere, What I suggest you to Place Sell Limit Orders in 15mins Timeframe, Recent / Nearest High Point.
Stop Loss 🛑: Recent Swing High using 2h timeframe
Attention for Scalpers : Focus to scalp only on Short side, If you've got a money you can get out right away otherwise you can join with a swing trade robbers and continue the heist plan, Use Trailing SL to protect our money 💰.
Warning : Fundamental Analysis news 📰 🗞️ comes against our robbery plan. our plan will be ruined smash the Stop Loss 🚫🚏. Don't Enter the market at the news update.
Loot and escape on the target 🎯 Swing Traders Plz Book the partial sum of money and wait for next breakout of dynamic level / Order block, Once it is cleared we can continue our heist plan to next new target.
💖Support our Robbery plan we can easily make money & take money 💰💵 Follow, Like & Share with your friends and Lovers. Make our Robbery Team Very Strong Join Ur hands with US. Loot Everything in this market everyday make money easily with Thief Trading Style.
Stay tuned with me and see you again with another Heist Plan..... 🫂

CHINA 50 Market Money Heist Plan on Bullish Side.Hello! My Dear Robbers / Money Makers & Losers, 🤑 💰
This is our master plan to Heist CHINA 50 Market based on Thief Trading style Technical Analysis.. kindly please follow the plan I have mentioned in the chart focus on Long entry. Our target is Red Zone that is High risk Dangerous level, market is overbought / Consolidation / Trend Reversal / Trap at the level Bearish Robbers / Traders gain the strength. Be safe and be careful and Be rich.
Entry : Can be taken Anywhere, What I suggest you to Place Buy Limit Orders in 15mins Timeframe Recent / Nearest Swing Low
Stop Loss 🛑 : Recent Swing Low using 1h timeframe
Attention for Scalpers : If you've got a lot of money you can get out right away otherwise you can join with a swing trade robbers and continue the heist plan, Use Trailing SL to protect our money 💰.
Warning : Fundamental Analysis news 📰 🗞️ comes against our robbery plan. our plan will be ruined smash the Stop Loss. Don't Enter the market at the news update.
Loot and escape on the target 🎯 Swing Traders Plz Book the partial sum of money and wait for next breakout of dynamic level / Order block, Once it is cleared we can continue our heist plan to next new target.
Support our Robbery plan we can easily make money & take money 💰💵 Follow, Like & Share with your friends and Lovers. Make our Robbery Team Very Strong Join Ur hands with US. Loot Everything in this market everyday make money easily with Thief Trading Style.
Stay tuned with me and see you again with another Heist Plan..... 🫂

CHINA 50 Index Money Heist Plan on Bullish SideHola! My Dear Robbers / Money Makers & Losers, 🤑 💰
This is our master plan to Heist CHINA 50 Index based on Thief Trading style Technical Analysis.. kindly please follow the plan I have mentioned in the chart focus on Long entry. Our target is Red Zone that is High risk Dangerous level, market is overbought / Consolidation / Trend Reversal / Trap at the level Bearish Robbers / Traders gain the strength. Be safe and be careful and Be rich.
Entry : Can be taken Anywhere, What I suggest you to Place Buy Limit Orders in 15mins Timeframe Recent / Nearest Swing Low
Stop Loss 🛑 : Recent Swing Low using 1h timeframe
Attention for Scalpers : If you've got a lot of money you can get out right away otherwise you can join with a swing trade robbers and continue the heist plan, Use Trailing SL to protect our money 💰.
Warning : Fundamental Analysis news 📰 🗞️ comes against our robbery plan. our plan will be ruined smash the Stop Loss. Don't Enter the market at the news update.
Loot and escape on the target 🎯 Swing Traders Plz Book the partial sum of money and wait for next breakout of dynamic level / Order block, Once it is cleared we can continue our heist plan to next new target.
Support our Robbery plan we can easily make money & take money 💰💵 Follow, Like & Share with your friends and Lovers. Make our Robbery Team Very Strong Join Ur hands with US. Loot Everything in this market everyday make money easily with Thief Trading Style.
Stay tuned with me and see you again with another Heist Plan..... 🫂

CSI300 BULL FLAG ON SUPPORT LOOKS PROMISING. BREAKOUT NEEDED❗️❗️CSI has honored the significant demand zone, suggesting a potential continuation in the rally. The price respecting this highlighted zone coincides with the formation of a bullish flag on lower timeframes, further bolstering our bullish expectations. Notably, a bullish breakout has been confirmed on the formed flag, potentially leading to a rally with the creation of a pullback.
If sufficient volume and pressure emerge, there's a possibility of another bullish breakout on the trend line formed, which is crucial for validating our outlook.

China A50 LongChina has been on an uptrend.
It broke the resend resistance.
Dropped back on it and it up for today.
It seems likely we move more up to the next level.

Shanghai Comp SHCOMP ~ Bearish H&S Update (Feb 2024)SSE:000001 chart mapping/analysis.
Been a while since I've published any charts on TradingView - process is a pain in the a$$ tbh & procrastination crept in while lacking TA-edge on markets + other commitments..
That said, noticed Shanghai Comp chart still notching views given current environment so thought I'd give an update.
Initial TA thesis hasn't changed - bearish H&S identified in Dec 2023 completed & still in play, despite PBOC desperately throwing everything to keep their market afloat (don't fight the trend).
Chart notes:
Cleaned up clutter from previous chart
Added descending parallel channel for potential bounce play off lower trend-line
Labelled 50/200 EMA death cross to signify bear market trend (weekly chart)
Break below ~2666 = further capitulation
Break above ~2924 (R1) = bullish trend reversal
Stay tuned whether I get back on TradingView horse & update older charts or publish new ones, cheers.

Shanghai Composite SHCOMP ~ Bearish H&S Formation (Dec 2023)SSE:000001 chart mapping/analysis.
Bearish H&S formation on weekly chart.
Price action already broken below multi-decade trend-line.
Pattern follows through = -29% measured move down to 78.6% Fib / retrace to 2005 breakout / gap fill (weekly) confluence zone (green box).

Shanghai Comp. (SSE) -> Please Pay AttentionMy name is Philip, I am a German swing-trader with 4+ years of trading experience and I only trade stocks , crypto , options and indices 🖥️
I only focus on the higher timeframes because this allows me to massively capitalize on the major market swings and cycles without getting caught up in the short term noise.
This is how you build real long term wealth!
In today's anaylsis I want to take a look at the bigger picture on Shanghai Composite.
The Shanghai Composite index is the leading index of China and has been trading in a long term symmetrical triangle for more than 15 years.
Considering the fact that SSE entered bullish into this triangle, I do expect a bullish breakout which could happen in the next 6-18 months and then I do expect a major move to the upside.
- - - - - - - - - - - - - - - - - - - -
I know that this is a quite simple trading approach but over the past 4 years I've realized that simplicity and consistency are much more important than any trading strategy.
Keep the long term vision🫡

SHCOMP ~ Snapshot TA / Bearish H&S Development (TBC) / WeeklyChina's Economy is dangerously on the ropes...things have gotten so bad, CCP had to make an announcement on a Sunday night (AEST/UC+10) that they're going to intervene in their domestic market with a raft of "measures" in hopes of boosting market confidence:
- Halve stamp duty on stock trading
- Tighten pace of IPO listings
- Cut margin financing requirements
- Restrict listed companies' refinancing
- Restrict share reductions by major shareholders
My gut instinct tells me this will be a financial disaster...luckily we've got charts to tell us what's really going on.
Taking a (Snapshot TA) look, SSE:000001 appears to be developing a Bearish H&S. Extrapolating Head-to-Neckline indicates price could be heading towards a pretty interesting Confluence Zone :
- Gap fill (weekly)
- Retrace to previous 2014 break-out (aka Return to Scene of Crime)
- Key demand/support zone
- Multi-decade trend line
Note: While chart patterns (ie H&S) are great at spotting trends, etc. it's important to focus on associated demand/supply zones & how price interacts with key levels to determine when & where to scale in/out of positions.
All (technical) signs point to SHCOMP in process of capitulating...problem with Govt interventions is it becomes a momentum play in either direction & technicals take a back seat.
We'll just have to take note of critical levels, set alerts & wait for the dust to settle..
Boost/Follow appreciated, cheers :)
CFD/INDEX: PEPPERSTONE:CN50 PEPPERSTONE:HK50
US: NASDAQ:AIA AMEX:FXI AMEX:EEM AMEX:CQQQ AMEX:KWEB
ASX: ASX:IAA ASX:IZZ ASX:IEM ASX:CNEW ASX:ASIA

China A50 holds its ground despite weak sentimentAU wages came in weak, The RBA hinted that they think they're done tightening in the minutes, The PBOC cut rates (again) and a slew of data from China once again misses the mark. And all in a 30-minute period! I think we’re fast approaching a phase where bets will be on for another round of stimulus. The China A50 is holding its ground above 12,600 and AUD/USD has managed to hold above yesterday’s YTD low despite the weak data. There’s a floor under these prices, and any rumours of stimulus could potentially light the bullish match for these markets to bounce.
Economic data from China continues to disappoint, with retail sales, industrial production and fixed-asset investment data all missing the mark today. This follows on from disappointing trade figures for Q3 with imports and exports contracting at a much faster pace than feared, and loan demand falling to its lowest level since 2009.
Yet somehow, the China A50 is still holding above the 12,400 base it formed in Q2 (despite negative headlines) before falling on news of stimulus. Are we about to witness a similar scenario? Perhaps.
The PBOC announced that they have cut rates for a second month in three, a move not expected by the majority of economists. But it does suggest there is some panic, and with that comes hopes of more stimulus. If a market can’t go lower on bad news, it may not take much ‘good’ news to help it rally.
A bullish hammer formed on the daily chart on Monday and prices are holding above its low despite the negative sentiment. We therefore see the potential for a rally to at least 13k, either on hopes of stimulus (or confirmation of it).

China A50 holds 12400 with conviction. Bullish breakout pending?The China A50 trades within a bearish channel on the daily chart, although we strongly suspect it wants to break out of it to the upside.
If you look at the steady stream of weak data coming out of China over the past few months, why is the China A50 not breaking to new lows? In fact, each time the market has pulled back to the 12,400 area since early June buyers have stepped in. And they returned in force yesterday to produce a strong bullish engulfing candle at support.
Bulls could either wait for a break of the 12,857 high to confirm breakout. But if confident that some sort of ‘plunge protection team’ is defending the 12,400 level, any pullback towards it may prove to be a gift for bulls who are anticipating a countertrend breakout.
