China A50 index to fall below the 500-week moving average?China A50 index ( CN50 ), a measure of the Chinese onshore market that keeps track of 50 of the biggest Chinese A-share companies listed on the Shenzhen and Shanghai stock exchanges, broke a major upward trend that had been in place since 2016.
The technical picture sees the A50 index currently dominated by a descending channel pattern, having fallen 42% from its peak in February 2021, with prices now approaching a remarkable 500-week moving average.
Given the slowdown in the Chinese economy caused by the government's Zero covid policy, the downward trend in Chinese stocks has been ongoing for a while. However, the most recent sell-off has been triggered by a crumbling confidence among foreign investors as a result of Xi Jinping's reelection as president for a third term and a leadership reshuffle within the Politburo Standing Committee during the 20th National Congress.
The A50 index may not have reached its bottom yet, if the Zero-Covid policy and growing doubts about the new policymakers' plans for the country's economic future continue to dampen Chinese growth prospects. Even though the weekly RSI is beginning to exhibit extremely oversold conditions, which is extremely unusual for this market and hasn't happened since August 2011, bears still have total control over the index. But, given the wild price swings of the past few days, some technical and short-term price bounces could still happen.
The psychological 11,000 point level, which is down 7% from here, and the 10,200 point level, which was the low of January 2019 (down 14% from here), provide the next significant supports. The A50 will have dropped 50% from its peak if it reaches levels from January 2019, which might encourage some dip buying there.
Chinaindex

SSE Shanghai Composite W1 topped w/ a diamond? W2 comingThis China index confirmed its completion of ABC when lockdown ended & their economy resumes. It has risen so much from the ABC correction low of 2888 & we may see wave 1 topping out with a diamond reversal pattern. As seen in the past 2 times shown in chart, a diamond can be either a reversal or continuation pattern so proceed with caution.
Reasons why I see this as a reversal:
1) index has already risen 500 points (2888 to 3388 completes the 5 sub-waves of wave 1) without any major retracement.
2) price was rejected exactly at wma 50 & an anchored VWAP from 3300 bottom of July 2021
3) price was rejected at the 2015 red trendline
4) price has reached the 1.272 FIB retracement of the most recent leg down (an ideal spot for abc zigzag retracements)
The 2 most probable supports (the 2 yellow zones) for the wave 2 correction are:
1) the 0.383 FIB near the 3100 to 3200 pivot zone
2) the 0.618 zone near 3100
If wave 2 is shallow, then the future wave 4 may be a deeper correction like 61.8% or 78.6%.
Not trading advice

CHINA A50 CN50USD Weekly Elliot Wave AnalysisCHINA A50 CN50USD Weekly Elliot Wave Analysis ChinaA50 Index - Bullish Sign Active

The SZSE Component Index 6/5/22The SZSE Component Index is an index of 500 stocks that are traded at the Shenzhen Stock Exchange (SZSE). It is the main stock market index of SZSE.
Price reached Fib ( 0.618 )
Price reached Weekly FVG
Good opportunity of long position.
+41.5% if price reached first red line
Good Luck Trader💯💯
.
.
.
.
.
.
🧅Disclaimer :There are risks associated with investing in securities. Investing in stocks, bonds, exchange traded funds, mutual funds, and money market funds involve risk of loss. Loss of principal is possible. Some high risk investments may use leverage, which will accentuate gains & losses. Foreign investing involves special risks, including a greater volatility and political, economic and currency risks and differences in accounting methods. This is Not Financial Advice
🧅JUST AN OPINION OF THE ONION.🧅

SSE China bottomed@2863;may retest it before an abc to 3500SSE china composite index may have already bottomed at 2863.65 in April. It is now at my yellow pivot zone. It may go back down to retest the low.
2888 is a very impt FIBO level, exactly @0.786 retracement & is also coinciding with exactly 0.236 of my Fibo strategy on 2 separate retracements.
It is highly probable that SSEC may rally on early June. It may reach 3300 in early August before a long consolidation above the yellow pivot zone before another rally in early Nov2022 reaching as high as 3500
In 1Q2023. (A zigzag move)
If we see the Macro view in weekly Chart, SSEC actually finished wave 2 in 2005 at 1008.60. From there it zoomed up to 6124 ATH in Oct2007 just before the 2008 crash. From these 2 points it is actually making a very big wedge that is the big & long wave 4. The apex of this wedge has a definite destination. GUESS WHERE: exactly at 3500! It will whipsaw above & below the 3300 to 3500 zone for a while. It may reach as high as 3740 to 4000 before it finally breaks out of this BIG WEDGE to start the final wave 5.
Time to shine after zero-covid accomplishment.
Not trading advice

NTES Price TargetPrice target for NTES is $84.
All the Chinese stocks are primed for a strong recovery after China`s top administrative authority said it would work to stabilize the stock market and boost economic growth!
Traders are expecting the Chinese government would support the stock market like the FED did in the US.

BEKE Price TargetPrice target for BEKE is $19.
All the Chinese stocks are primed for a strong recovery after China`s top administrative authority said it would work to stabilize the stock market and boost economic growth!
Traders are expecting the Chinese government would support the stock market like the FED did in the US.

JD Price TargetPrice target for JD is $62.
All the Chinese stocks are primed for a strong recovery after China`s top administrative authority said it would work to stabilize the stock market and boost economic growth!
Traders are expecting the Chinese government would support the stock market like the FED did in the US.

HSI Index - Worse than the 2008 financial crisis?The Chinese stock market crash may be worse than the 2008 crisis!
Fundamenta Aspect
Everyone is concerned about the decline in the value of Chinese companies' stock and the resulting decrease in demand for commodities!
Today, selling pressure on Chinese stocks grew. China's major stock index fell to its lowest level since 2008 due to concerns about its relations with Russia and tighter regulators pressure.
The Hong Kong Index of Chinese Companies, a measure of Hong Kong stock prices for Chinese firms, declined by 6.6%. Likewise, the stock prices of Chinese companies dropped sharply the day before yesterday, since July 2015, this has been the largest fall.
Economic sanctions against China are a concern for the market due to China's ties to Russia. Concerns have also been raised about the quarantine of Chinese cities. Analysts are concerned that this time around's financial market catastrophe could be even worse than the one that occurred in 2008.

GXC Long Range CycleJust doing some research and then realized that the GXC (China ETF) has a 10 year historical cycle pattern. In this pattern, it appears to be at a bottoming out period.
Just sharing an observation from the technical cycle aspects. Other qualifiers suggest a similar indication (not discussed herein).
What you also can observe is that there is a peak about 2/3 into the cycle... which projects about end 2023 peak from the current projected bottom.

$SOS #stockmarket #live #news #business #trading #stocks #stock SOS Limited, a technology company, provides marketing data, technology, and solutions for emergency rescue services to corporate and individual members. It operates SOS cloud emergency rescue service software as a service platform that offers basic cloud products, such as medical rescue, car rescue, financial rescue, and mutual assistance rescue cards; cooperative cloud products, including information rescue center, intelligent big data, and intelligent software and hardware; and information cloud products, such as News Today and E-Commerce Today. The company serves insurance companies, financial institutions, medical institutions, healthcare providers, auto manufacturers, security providers, senior living assistance providers, and other service providers in the emergency rescue services industry. SOS Limited is based Qingdao, the People's Republic of China

HANG SENG CHINA ENTERPRISES INDEX Long idea1. Last lower high broke
2. Creating pattern
3. Waiting price to broke pattern

Double top on the Shanghai Composite Looks dangerous... breakdown below 3350 is spelling trouble in uppercase.
MACD is not committed but has downside bias.
Watch 3350 and then 3300 levels.

My Analyses On Kweichow Moutai STRONG BUYMy Analyses On Kweichow Moutai :
STRONG BUY. Strong Break Out .
Friends, please support my Free works by Following and Clicking LIKE Button .
Feel free to post your thoughts and charts here in comments, I'd love to see it.

Long China IndexLong on trend retracement. there will be some big news on the weekend so I might close this trade by COB Friday..

Hang Seng Set for Renewed UptrendUS China trade war resolution more forcefully impacts Shanghai Composite and Shenzhen Component, but Hang Seng should also see some gains. Moreover, we have seen a bit more progress in the negotiations apparently with tech transfers, tech war. Let's see if it pans out though. For more, check out www.anthonylaurence.wordpress.com

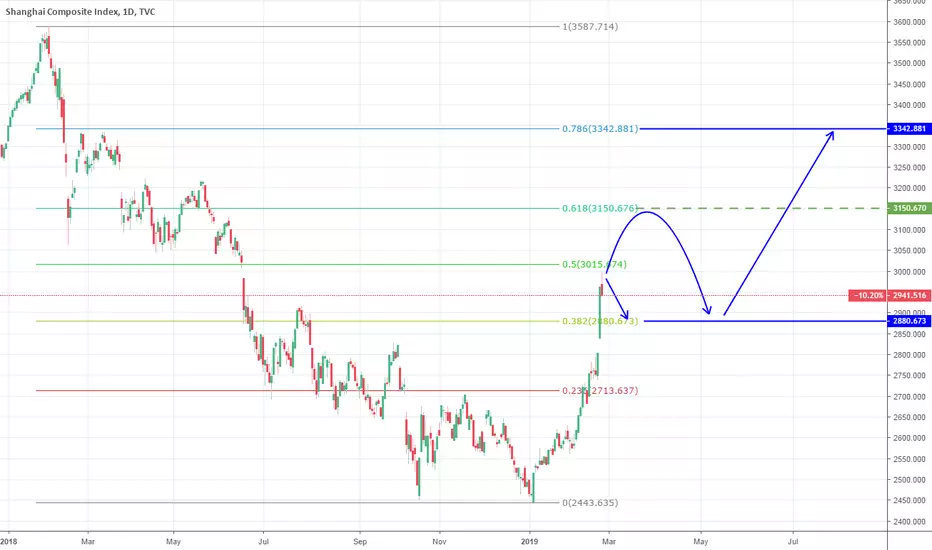
Shanghai Index: Buy the pull back.The Shanghai Composite Index has seen a considerable rise since the start of the year, which we predicted in December ( ). The parabolic rise on 1D has reached past the overbought zone (RSI hitting 80.000) and as it got close to the 0.500 Fibonacci retracement level (3,015), we should start see it consolidating. The strongest candidate for a pull back however is the 0.618 level (3,150). We are willing to buy any such pull back and target the 0.786 level at 3,340.
See below how we predicted this +22% rise in December:
** If you like our free content follow our profile (www.tradingview.com) to get more daily ideas. **
Comments and likes are greatly appreciated.