YY could be next china stock to breakoutChina stocks are hot right now. $bzun $$jd $wb $sina all having great strenght. $yy currently is consolidating in a nice flag and could run in sympathy and start to trend.
Chinese


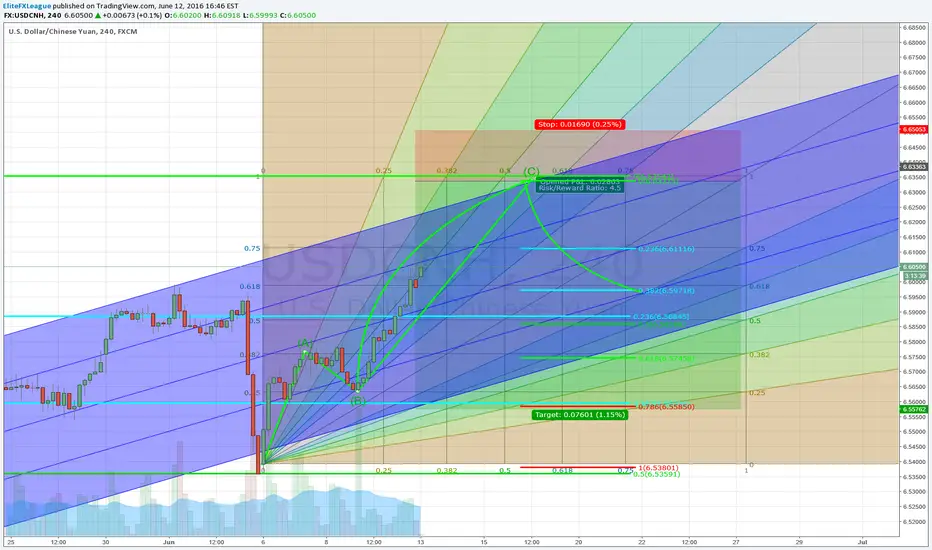
USDCNY. Filling the Mega Gap. Wave 5One of market wizards once told that to find the trend we should squeeze the chart.
Frankly speaking I thought USDCNY is in a correction before I squeezed the chart, the Monthly chart.
The pair had a Mega GAP in 1994.
It looks like we have an echo from that distant time in form of a downside impulse, which is filling the gap.
We could be in the last large wave down to hit the 5.8145 mark.
This idea is opposite to the primary market opinion of imminent devaluation of yuan.

Neo more risk on the downsideA week ago I wrote the most possitive scenario for Neo's price in the near future would be a neutral range. After leaving the apex of the triangle Neo formed a lower high and indeed went on sideways till today. Horizontal support broke, the drop stopped at an old peak-price. Then former horizontal support got back tested and now serves as resistance, the break of this supportline is a fact! For now we are confined between former support around 0.0081 and renewed support at former peaks price around 0.0064. On short term a revisit and maybe even a break of 0.0064 seems more likely than regaining the 0.0081.

$NEOETH CORRECTING BEFORE NEXT BULLISH WAVE, CONFIRM & BUY!Wait to confirm price reversal and buy $NEOETH at a discount before the next bullish run. NEO is in a unique position, fundamentally, as many ethereum projects are switching over to its chinese counterpart. Remember to keep your $NEO stored in a proper wallet so you don't miss out on the GAS dividends.


MOMO Gains Traction BEFORE EarningsFundamental:
I studied the company and I like the its past history and it meets my fundamental parameters. Past history does not guarantee future results.
It is a Chinese-based company.
Technical:
The volume clearly shows big players entering the stock of this company. Its time to surf the wave up!
The price chart consolidated sideways with volume divergence.
Targets:
The targets on the chart are merely "areas of reflection" where I will PAUSE and re-consider the company going forward.
Overall Plan:
Hold for 3 months to 52 weeks

Chinese Yuan USDCNY decreased 0.0027 or 0.04% The USDCNY decreased 0.0027 or 0.04% to 6.8974 on Friday April 28 from 6.9000 in the previous trading session. Historically, the Chinese Yuan reached an all time high of 8.73 in January of 1994 and a record low of 1.53 in January of 1981.

EDU beastchinese names have been hot lately I entered at 53 because of the enormous resistance level (top trend line). and strong support(bottom trend line). It's just been beasting and i wouldnt recommend buying after such a big move. Don't need excess indicators ke NYSE:EDU ep it simple.


USD/CNH, DAY CHART, SHORT (18-FEB-2017)From the Price Action, it is quite obvious that the
selling pressure is greater than buying pressure now.
Overall, we are bearish on USD/CNH
Here are 2 trading plans for you:
1. Wait for bearish signal to short
2. If price pull back higher to Resistance Zone,
wait for bearish signal to short :)

SOHU May Be Ready To Close Oct 24 GapThe long tail on Monday's candlestick shows the market maybe ready to support the stock at this level, and an insider buy of 48,000 shares from the CEO has piqued my interest.
Bullish if it clears the $37.28 resistance established on December 13.
Bearish if it falls below $33.78 support.

Keep care! Chinese manufacturing PMIThe Chinese manufacturing PMI will influence the market direction. If the PMI will be lower then the last time then we will have a breakout above the upper side of the triangle. The volume should increase around 28.11.2016. If the breakout to the upper side of the triangle fail we will retest the 4600-5800 yuan support zone which is also at the 50% Fibonacci retracement. RSI perfomed a bullish bounce, which indicades a bullish breakout by time.

How To Track The arbitrage Opportunities On Chinese YUANHere The Pretty Nice Setup To Hunt The Arbitrage Opportunities On Chinese YUAN.


Will USDINR breakout and depreciate INR further?China's central bank guided the yuan lower on Thursday FX_IDC:CNYUSD .
China's first shock devaluation in August jolted the global financial markets and Indian currency "INR" was also affected by this sudden move.
This second devaluation has come at such a crucial time, when money market was expecting strengthening in "INR" and start of appreciating trend.
Can "INR" sustain the pressure or it will prevail further devaluation?
Go long FX_IDC:USDINR
Trade Trigger 67.2
Target 68.6
SLTP 66.7

CNY FURTHER DEVALUATION! (RED IS GOOD!)China.
It's been in the media?
It's being painted as the bad guy! Well unlike Kim Jong Un Dropping H-Bombs
China will drop some more bombs in the future but it will be devaluaing the Yuan
Yuan is now in the SDR and many countries are going to start adopting more and more.
We see a devaluation to 6.8 maybe slightly further until you will see the yuan gain any more strength against global currencies.
Zhu ni hao yun!

Head and Shoulders for SOHU on Weekly ChartMany are asking if the sell-off in Chinese stocks has stopped after the last two weeks' beatings.
It looks like they are for now, or with moderate downside in the next 5-10 trading days.
Looking at SOHU, it lost nearly 30% of its value in two weeks. Looking at the long term chart,
SOHU can lose about 17% from its current price to reach the bottom of a multi-year trend channel.
If losses in China accelerate, it could go through that trend bottom quickly to 34.00, and
with the long standing head and shoulder pattern, it could accelerate even lower.
The pattern has the top at 100+ with the neckline close to 40.00. That would indicate a potential
0.00 stock price/bankruptcy unless the federal banks and Chinese government act accordingly.

Buy on BreakoutBidu could run to the above levels the key is volume on todays breakout and to see if by end of day it has closed above the breakout resistance level
