$MU bought calls and stockMorning Star forming on W chart.
Bought Jan 72.5 calls & Stock
$68.58 is my Stop
Chips

Nvidia - Double Top - Large Cap Stonks - Rising RatesAlways overbought. Run! *valuation matters
Great company though.

TrendyTrades: AMD to 110?AMD setting up for a break of structure and PT is 110. Let's get it. TRENDYCHARTSANALYSIS BABYY

NVDA In Danger??Today I contemplated closing 75% of my long in NVDA as it is well in profit and I have much leeway right now to walk away and let a small amount ride. The reason for this is because NVDA has broken both a key upward sloping trendline as well as the .786 Fibonacci level on the daily and 4 hour time frames.
This does not have to be the end of the road for NVDA but it is not a bullish sign either to say the least.
It does appear, however, that Nvidia could be in for some short to midterm consolidation before regaining the needed momentum to break back above all time highs.
A few things that are good from a bulllish perspective is that a week ago we broke out of downward sloping resistance and managed to break and close fully above the .786 Fibonacci level not to mention we set higher highs in the process of doing that.
For this reason I am remaining in my long.. but there is a further issue. The issue is that we are in the process of putting in a macro lower high and this could be very bearish for the asset if it does not find bids this week and at the very least break back above $203. If not, a retest of the $198 price level could be very likely.
This entire range from $198 all the way down to $194 could be a great re-entry area for a long as there is much bullish confluence in this region which should provide for ample support.
It is this reason that I am remaining in my long. I will not be looking to add to my position should the price come down to the aforementioned price levels.. I will, however, remain patient by waiting and seeing if any bids come in at the green zone I have showing on the chart. If this green zone does not hold, I will be 75% out of the trade should we break and close a daily candle below the 0.5 fib level at $194.
Tomorrow's open and close on the daily chart could be telling. Keep in mind though, that the week has just started and NVDA has plenty of time to make up for the major, yet small ground it has given up to start the trading week.

AMD Buy LevelsMid July I posted a bullish idea on AMD and how the $93.50 level approximately was the level we wanted to watch as being key to AMD retesting and breaking previous all time highs.
Well AMD broke and found support at the $93.50 price level and upon doing so the price sky rocketed from that exact point and found itself on every news network this week that covers equities.
A pullback as we can see was very likely as a rejection at exactly the 1.618 Fibonacci extension level.. a very common rejection/reversal area after an asset smashes through all time highs and runs up in price. And now we see it struggling and getting rejected at the classic .786 fib level as well, typically the final blow of a parabolic runup in price.
NVDA is an asset that just weeks ago did the same thing and presented what has been a wonderful trade so far for those who have followed my idea on it by buying the pullback.
We are still in that NVDA trade currently and the same things I spotted in NVDA long before its drop and subsequent pump are some of the same things I am now spotting in AMD.
Looking both left and right, if you observe the color coded horizontal Fibonacci levels, we see confluence with a few overlapping lines. This is not coincidence and is in reality a very good sign as it adds credit to the idea that other smart traders are observing and trading these same horizontal levels of Fibonacci support.
I will be watching this closely in the coming days for a continued pullback which could bring it down to the $84 price level approximately.
Anyone who knows my ideas know that I wait patiently for a break of the .236 fib level on pullbacks, so I can then buy the breakouts of the .236 on the rebound back up. Which in this case means the price I will be sizing up a trade for will be $92 per share on AMD. This would be a nice 25% discount in price from its all time high set just a few days ago.
Also, there will be small trade opportunities at shallow fibonacci retracement levels for light positions but the real opportunities for an entry and low-risk trade will come at the lower fib levels as always.
Lastly, as I always point out, AMD does not HAVE to fall or go to these exact projected price levels. It is well within AMD's realm of possibilities to run higher in price.
However, given the runup that AMD has seen, and the strong rejection at a key area it is currently getting.. it is a high probability that the AMD dip has arrived and it is my belief that it will give patient traders a beautiful entry for another awesome trade here in the coming days and weeks.
Buy Levels
$122.41
$113
$106.12
$101.55
$97.17
$92.01
$84.24

On Semi - Blowoff Top - House of CardsOverhyped Ponzi Pogs. Same as the rest. Cash exit while you can. #chipwars

NVDA [Update]So far on NVDA we are still up nicely on our original idea and as we predicted NVDA is now putting all of our fib levels to the litmus test as it finds itself right in the middle zone of the entire fib retracement.
I expected the .383 to be properly tested before liftoff and so far it is holding up.
If it can continue to hold, NVDA will find itself breaking out once more as a bullish falling wedge is now being painted on the 4 hour timeframe.
One could debate if this is valid or not due to the breakdown out of its lower trendline, and that is fine. Because what we are most interested in is the upper trendline of the falling wedge as it appears to be serving as resistance on the price.
This is not something to ignore as supply lines like this can often be a warning of an impending bearish downtrend if price continues to fail when touching it.
So for this reason I am moving my stop losses up to around $189.79. The reason for this is because of not only the bearish trendline over our head, but because a breaking to the downside of the .382 fib level with a confirming candle on the 4 hour could mean a retest of much deeper levels at or around the bottom of the falling wedge or our .236 fibonacci level. So closing my position in profit and buying right back in at a discount is what I will be looking for in the near future.
In the meantime, however, I am still in my long but I am monitoring closely. NVDA will need to get moving and break the red trendline but ultimately put in a higher high in price by breaking the .618 fibonacci level over our head but that discussion will be kept reserve for a future post or update.


NVDA Buy Levels [Post-Stock Split]So things got a little weird today at the open with the stock split as many traders checked their holdings to see NVDA down -70% today.
Once it adjusted and all of the speculative traders jumped ship, Nvidia found itself spending most of the day battling at our .236 fib level, which is now $185 approximately. For now it has found itself above this level after bouncing beautifully off of the floor of the fib extension at around $178.
As always, I am waiting patient for a full body candle close above our .236 fib level on the 4 hour.
Keep an eye on the open tomorrow, as this asset is still most likely trying to regain its footing after what has been a very volatile past 2 weeks.
It is in my opinion that as long as we hold where we are currently, entries for a long is fair game. HOWEVER, beware that if you open below this level tomorrow, or confirm a 4 hour candle close below this level, all bets are off and you would be wise to keep patient and allow the price action to play out as risk below the .236 becomes difficult to size up.
If you are long, make sure you have either stops or at the very least price alerts set up for $185 incase it breaks.
Considering the wicks we had today both to the upside and downside on the 4 hour chart, things are very indecisive at the moment so I am ok with simply continuing to monitor.
Also, if this level does break down and confirm, a retest of $178 would be in store. From a trader perspective, if there is a retest it will be important that it bounces and does not come back to it again anytime soon. Too many retests of $178 would put this fib retracement at risk of being violated.
On the flipside, respect and support of the current fib near $185 (.236 fib) could be the buy opportunity patient traders have been waiting for.
Below you will find my price levels after the stock split I am looking at. This was found using the same method as in the pre-stock split idea.
The same buy ladder from that idea can be applied here as well. The beauty of this is that the buy ladder works better on the way up than it does when price is falling down.
$178
$185
$190
$194
$198
$203
$210
PLZ USE ALERTS AND OR STOP LOSSES

Fib Levels On AEHR Going WAY BackHad to take the AEHR chart all the way back out to 2017 to find some levels to plot. Took the fib retracement and look what we found: high traffic area around the 236 level. Tested it for the first time since 2017 and failed to break & hold. After pulling back, AEHR came within testing distance of the 382 level. After such a huge extension it will be interesting to see if it ends up consolidating above this level or if it tests (or breaks below) it.
"If we consider that the market for computer chips is extremely in demand right now, we see just why AEHR is getting so much attention. While it is not a producer of these chips, it does work as an ancillary company in the industry. In the past six months, shares of AEHR stock have rocketed higher by around 31%. Over the past twelve months, that number shoots up to over 45%... Only recently, Aehr Test Systems won a $2.9 million follow-on order for its FOX-XP Wafer Level Test and Burn-in system as well as multiple WaferPak Contactors from its lead silicon carbide customers. While this alone is not a be-all-end-all deal, it is a big step for the commercialization of its products. Additionally, large orders tend to help with the notoriety of a product and can lead to more orders in the future... ...While many gains with penny stocks occur without news, AEHR made an exciting announcement in the early morning on Monday. The company stated that it received a $10.8 million order for its silicon carbide test and a burn-in customer regarding its FOX-XP systems its WaferPak product... "
Quote Sources:
7/12: 5 Top Penny Stocks on Robinhood That You Should Check Out in July
7/19: 3 Top Penny Stocks For Your Monday Morning Watchlist

AMD Buy?Its been a rough go for even the most bullish setups on equities lately due to the rocky nature of the macro with recent news of further inflation fears. Nonetheless we continue to hunt for the setups if not for the gains, then most definitely for the learning lessons that the markets can teach us.
For this asset, we keep things simple by keying in on an uptrend that has been supporting AMD since May.
It is expected that eventually this trend will break, but for now as long the price remains in the trend, buy opportunities exist at the green upward sloping trendline.
Once the green sloping line is broken, this will be our time to begin preparing for an exit.
The yellow line will be the first level of support should the trend be broken, but ultimately the bears will want to break the red line at $87.86 to confirm.
For the bullish case, continue to expect bounces at the green trendline of support until a full body candle closes outside of it on the daily and weekly time frames. A wise profit taking area will be around $93.50. If that level is broken and held as support, a retest of all time highs could be instore for AMD.


STM Triangle Wedge PatternIf breakout wait for pull back buy off support line which was previously resistence.
else if it pulls back to $36 level, 1/2 full size position with stop loss at less than 33.40
Big Picture story: Microchip Shortage = Demand

SMIC's R&D VP Resigns, Giving Up CNY 9.3 Mn in SharesOn July 4, Chinese chipmaking giant SMIC announced that the company's vice president of R&D and its core technician, Dr. Jingang Wu, has recently applied for resignation due to personal reasons. He will no longer hold any position in the company.
According to the recent statement of China's largest foundry SMIC (688981:SH, 00981:HK), the company's R&D work remains the same, and Dr. Wu's resignation has not imposed any significant adverse impact on the company's overall R&D strength.
Dr. Wu joined SMIC in 2001. Since then, he has successively served as assistant director, director and senior director. From 2014, he has been the vice president of R&D. During his tenure, Dr. Wu has mainly been in charge of the company's fin field-effect transistor (FinFET) advanced technology R&D and management, which is a critical enabler for furthering SMIC's 0.35-micron process technology to the nano-FinFET level.
Regarding confidentiality and competition restrictions, SMIC stated that Dr. Wu was required not to disclose any of the company's secrets or proprietary information and shall not work for any competitors within 12 months after his resignation.
Also, the 160,000 restricted stocks Dr. Wu has been granted for equity incentives in May, equivalent to the market value of CNY 9.3 million based on the current stock price, would become invalid after his resignation.

Time to Finally Sell NVDA?After a beautiful runup past all time highs weeks ago, NVDA has found itself in a similar position as the Nasdaq by hitting and getting rejected at the first fibonacci extension level.
I closed my long in this last week as I saw this level approaching and now it appears that a legit pullback may be coming into reality.
So I am bearish.. or am I?
Truth be told Nvidia is one of my favorite stocks, so I am aggressively watching for lower levels of re-entry and have been anticipating doing so for weeks now even as it ran up in price. I intend to load up and so I will be watching this closely over the coming days and weeks.
The best case scenario short term for Nvidia is that bulls can bullishly engulf and break above the key fib level and hold it as support on the weekly.
Until then, shorts or put options seem the most attractive bet in the immediate short term.

AMD potential 87-88 in 1-2 weeks. BULL FLAGWith the announcement of new chips, AMD is looking healthy for a comeback on an 87-88 level. Right now I see a BULL FLAG on the daily chart.
Break above 82 could lead to 86. After that, I hope to see some short consolidation before jumping to the 87-88 level.

TSM potential growth to 130. Entry above 120With the chip shortage, TSM looks amazing for a potential run. It's been consolidating for a while now. Looking to buy after the 120 level break-out.
2-3 weeks potential growth to 130.

$MU vs $AMD*This is not financial advice, so trade at your own risks*
*My team digs deep and finds stocks that are expected to perform well based off multiple confluences*
*Experienced traders understand the uphill battle in timing the market, so instead my team focuses mainly on risk management*
My team has been analyzing $MU for the past few months. After consolidating in the $74-84 range for the past few weeks we finally believe that $MU is ready to take its leap to go past $100.
$MU is a semiconductor company much like $AMD. With this being said investors should expect these two to uptrend similarly short-term along with other semiconductor companies.
For long-term investors $AMD is the chip tyrant that will most likely dominate its competition, but that doesn't mean that we're not going to show $MU some love in the meantime.
We entered $MU this morning at $79.36 and plan to take profit 1-2 months from now at $104.
Entry: $79.36
Take profit: $104
Stop loss: $75
If you want to see more, please like and follow us @SimplyShowMeTheMoney

$TSM descending triangle - what do you think? Up or down?Beautiful channel formation here but the time has come where descending triangle is forming, these are usually bearish.
TSM is having problems with production due to water shortage, $MU ceo yesterday talked about how NAND demand is not necessarily as high as the market thinks. Different industry, but is this company really worth 3x pre-covid?
I lean towards bullish as the 200ma approaches but the technicals on paper say otherwise.

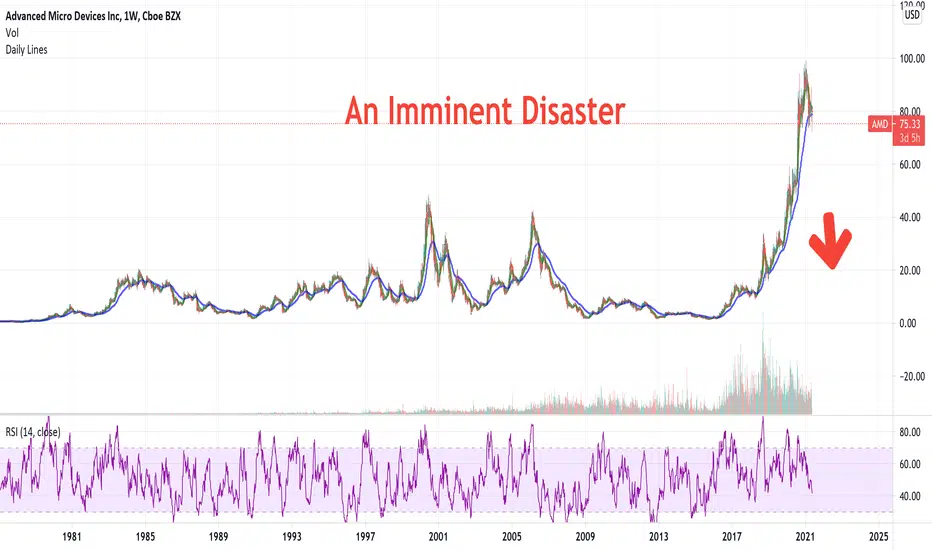
AMD - An Imminent Disaster - Chip Shortage Shenanigans - FOMOThe supply is goofed for a #poof
#fomo #stonks #valuationmatters
#marijuanamovement wins
#gnln
#thegem
Global Chip Shortage - Massively Overbought - Sell Sell Sell #cashexit the #fomo #stonks. Watch for all the incoming dead cat bounces. Stay away from them too.

QCOM - $165 PRICE TARGET QCOM - Current Price $130.48 Price Target $165
Qualcomm is set to benefit greatly not just from the chip shortage but the unexpected drop in supply of chips used for cellphones and handsets.Qualcomm’s Snapdragon 888, its new high-end chip with a 5G modem for Android phones. The newer chip which came out in Dec 2020 supports many types of 5G networks, the chip improved graphics rendering and improved artificial intelligence capabilities for things like facial and image recognition. Their 5G chip couldn’t come at a better time as tensions between the rest of the world and china continue, companies outside of China have started to avoid buying from Huawei. Back in 2019 Trump banned Huawei products in the US, and in July of 2020 the UK banned Huawei and their 5G chips and even said the companies existing equipment in the country will be removed by 2027. This is the perfect time to buy a trusted US chip maker that has a unique ability to steal significant market share in the 5G chip market. Great Value @ under 20x PE, 1.9% dividend!

Intel just popped through a resistance lineThere's some chatter in both the US and Europe about subsidizing chip manufacturing to help deal with the semiconductor shortage. That has sent chip stocks surging today, including Intel. I like Intel a lot, because it's quite reasonably valued for a chip company and has lots of plans for expanding its manufacturing capacity, which means it's poised to be a big beneficiary from any subsidies. Here are some vital statistics:
forward p/e: 12
forward p/s: 3
p/fcf: 12
forward div yield: 2.6%
patents per year per B$ market cap: 14
upside to median 4-year valuation: 8%
upside to average analyst price target: 20%
average S&P Global fundamentals rating: 70/100
average analyst score: 8/10
esg score: above average
put-call ratio: 0.9
Honestly, I think this is a long-term buy-and-hold. I had hoped for a dip to $52.20, but it looks like we may not get that low. Look for a close above resistance as confirmation of a breakout here. If we pull back and close below the resistance line, that's a signal that we may continue down to $52.20 after all.
