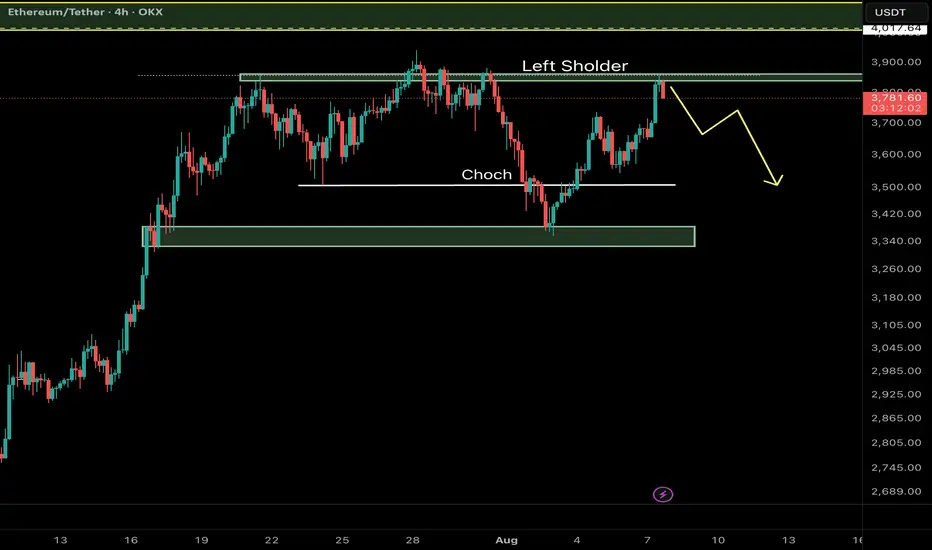
Ethereum (ETH/USDT) – Key Reversal Zone RetestAfter a major CHoCH (Change of Character) on the 4H timeframe, Ethereum has shown a strong bullish move from a high-probability demand zone and is now retesting a critical resistance area aligned with the Left Shoulder of a classic RTM pattern.
⸻
🔍 Key Technical Elements:
• CHoCH confirms the shift from a distribution phase to accumulation.
• Strong reaction from a demand zone near $3,340–$3,380.
• Price is now testing the Left Shoulder, which often acts as a reaction zone before continuation.
⸻
📌 Potential Scenarios:
🔼 Bullish Case (Primary):
If ETH breaks and closes above $3,870, a move toward the next liquidity pool around $4,010–$4,050 is likely.
🔽 Bearish Case (Alternative):
Failure to hold above the current resistance may lead to a pullback toward the $3,340–$3,380 demand zone for another accumulation attempt.
⸻
💡 Educational Note:
In RTM methodology, retests of the Left Shoulder after CHoCH are considered one of the most efficient entry zones — especially when confluence with liquidity voids or imbalance exists.
Follow for more Smart Money & RTM insights.
Choch
XAUUSD Smart Money Technical Analysis – Bullish Potential XAUUSD Smart Money Technical Analysis – Bullish Potential from Strong Support
Gold (XAUUSD) is currently trading around $3,291.780, showing a potential bullish reversal setup from the strong support zone after a clear liquidity sweep and market structure shifts.
🔍 Key Technical Highlights:
✅ Strong Support Zone (Demand)
Price is reacting from a major demand zone (Strong Low) between $3,275 – $3,225, a level that previously triggered bullish rallies.
Multiple Breaks of Structure (BOS) and CHoCH indicate previous bullish control and a possible re-accumulation phase.
✅ CHoCH Near Support
A recent Change of Character (CHoCH) around the support area shows the first signs of smart money accumulation.
Liquidity below recent lows has been swept, triggering possible bullish intent.
✅ Bullish FVG (Fair Value Gap)
A clear Bullish FVG remains unmitigated around the mid-range, offering target confluence at $3,349.560.
Price may aim to rebalance inefficiency and fill the FVG as part of the bullish move.
✅ Resistance Zone Above
The resistance area near $3,325 – $3,350 acts as a short-term target for long positions.
Further resistance lies at the Buy-Side Liquidity & Weak High zone around $3,450 if momentum sustains.
🧠 Smart Money Concept Interpretation:
Liquidity Grab: Price dipped into strong demand to collect sell-side liquidity before potential reversal.
CHoCH + BOS Alignment: Indicates the market may now transition into a bullish phase.
FVG as Magnet: Price is drawn toward unfilled value zones—ideal for bullish target projection.
🎯 Trade Idea (Educational Purposes Only):
Bias: Bullish
Entry: Around current zone ($3,290)
Target: $3,349.560 (FVG zone)
Invalidation/SL: Below strong low (~$3,225)

Trend Exhaustion Detected – Bearish Structure AheadUS100 (NASDAQ) 30-minute chart as of July 26, 2025, with technical insights based on the visible elements.
🔍 1. Trend Analysis
Primary Trend: Uptrend (bullish structure)
The price has been respecting a rising parallel channel, marked by:
Ascending support (lower boundary)
Ascending resistance (upper boundary)
Market structure shows:
Higher Highs (HH)
Higher Lows (HL)
✅ This indicates continuation of bullish momentum until structure breaks.
📐 2. Market Structure Elements
Structure Type Label on Chart Price Zone (approx.)
Break of Structure (BOS) BOS (center-left) ~22,950
Higher Low (HL) HL (2x) ~22,700 (1st), ~23,050 (2nd)
Higher High (HH) HH (2x) ~23,150 and ~23,300
Resistance Labelled ~23,300–23,320
Demand Zones Labelled ~22,450–22,700
🔁 Break of Structure (BOS)
The BOS occurred after a prior swing low was broken, followed by a new higher high, confirming a bullish shift.
🧱 3. Support / Resistance Analysis
🔼 Resistance Zone
The price is testing strong resistance around 23,300–23,320
Multiple rejections in this area
Trendline resistance also aligns here
A rejection arrow is drawn, indicating potential bearish reaction
🔽 Support Zone (Immediate)
23,180–23,220: highlighted green box is a local support block
If broken, likely to revisit 23,000–23,050, or even down to 22,900 range
🟩 4. Demand Zones
Zone 1:
22,450–22,600: Strong bullish reaction historically — likely to act as a key demand if a deeper pullback occurs
Zone 2:
22,850–22,950: Validated with prior accumulation & BOS event
🧠 5. Key Observations
Price is at a critical inflection zone:
Testing a resistance zone
At the upper trendline of an ascending channel
A bearish reaction is projected (black arrow)
Possibly targeting the green support zone around 23,180–23,220
If that fails, demand at ~23,000 will likely be tested
Ichimoku Cloud:
Currently price is above the cloud → still bullish
Cloud is thin → potential weakness or upcoming consolidation
⚠️ 6. Trading Bias & Setup Ideas
✅ Bullish Bias (if price holds above ~23,180)
Long entries can be considered on bullish reaction from support
Target: retest of 23,300–23,350 or even breakout continuation
❌ Bearish Bias (if breakdown below support)
Short entry valid below 23,180 with:
TP1: 23,050
TP2: 22,900
A breakdown from the ascending channel would signal trend exhaustion
🔚 Conclusion
Current Price: 23,298.4
Trend: Bullish, but at resistance
Next move: Watch for reaction at resistance and support box below
Bias: Neutral-to-bullish unless the structure breaks below ~23,180

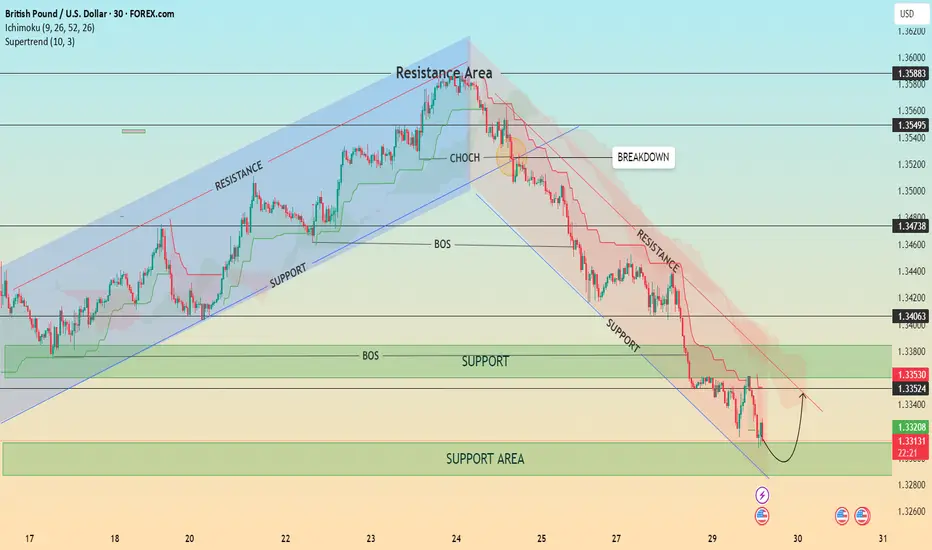
GBP/USD – Bearish Structure with Possible Short-Term Pullback📊 GBP/USD – Bearish Structure with Possible Short-Term Pullback
Timeframe: 30-Minute | Date: July 29, 2025
Price action recently broke down from a well-respected ascending channel, confirming a shift in market structure with a Change of Character (CHOCH) followed by a Break of Structure (BOS). Since then, GBP/USD has been respecting a descending trend channel, forming consistent lower highs and lower lows.
🔍 Current Setup:
Price is testing a major support area around 1.3300–1.3320.
A minor pullback is expected as indicated by the bullish wick rejections.
However, the overall bias remains bearish unless we break and hold above the 1.3353–1.3406 resistance zone and the descending trendline.
The Ichimoku Cloud and Supertrend both show bearish momentum.
📈 Potential Scenario:
Price may bounce from the support area and retest the upper boundary of the descending channel before resuming the bearish trend.
⚠️ Key Levels to Watch:
Resistance: 1.33530 / 1.34063 / 1.34738
Support: 1.33200 / 1.33000
💡 Structure Notes:
CHOCH = Trend Reversal Signal
BOS = Confirmation of Downtrend
Cloud = Dynamic Resistance
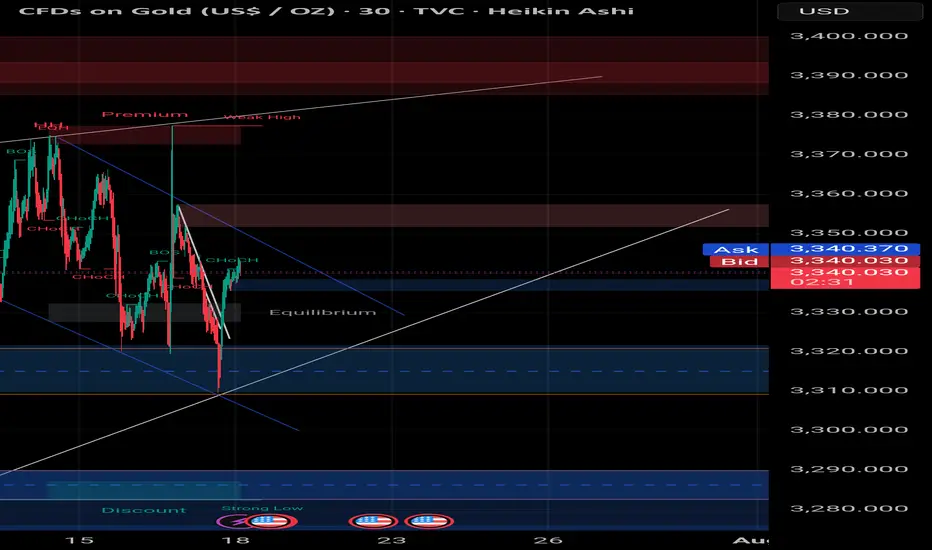
Gold 29 July – H4 Demand Holds, M15 Structure ShiftsGold (XAUUSD) Analysis – 29 July
The Mirror is Forming at 3310: Structure + Reaction in Focus
The market has successfully held the H4 demand zone, particularly near the critical level around 3310. This level is not just another number on the chart — it’s an inflection point. A possible first higher low or swing low, from which the next directional leg in gold could emerge.
Yesterday’s price action swept liquidity beneath this zone and then showed a strong bullish reaction. This isn’t just a bounce. It’s a behavioral shift — one that hints at absorption of selling pressure and the re-entry of aggressive buyers.
🔍 Structure Alignment: H4 + M15
On the H4 timeframe, price has stabilized within the demand zone.
Zooming into M15, we now see internal price action beginning to shift:
• First, a Change of Character (ChoCH) — the earliest clue that momentum is starting to turn.
• Then, a Break of Structure (BoS) to the upside — signaling potential bullish intent.
This multi-timeframe alignment — H4 support holding + M15 structure shifting — builds a strong case for a potential reversal and continuation of the uptrend.
📍 What Next?
The next step is to mark a refined M15 Point of Interest (POI) — a zone where price may pull back before making its next move upward.
We don’t chase price. We let it come to us.
✅ Look for Lower Timeframe Confirmation
Once price returns to your POI, it’s time to observe.
You’re not looking for obvious signals. You’re watching for subtle behavior —
a sharp reaction, a psychological flush, or a precise candle footprint that reveals intent.
The deeper signals aren’t always visible to the untrained eye — but they’re there for those who’ve studied the mirror.
( For those who know what to look for — this is where the sniper entry reveals itself. )
🎯 Summary
• Bias: Bullish — structure and reaction support long setups
• Plan: Wait for price to retest the M15 POI
• Execution: Only enter on confirmed lower timeframe intent and confluence
• Target: 120 pips (fixed, as per system)
• Stop Loss: 40 pips (always 1:3 R:R minimum)
📚 This is the kind of structure-based clarity we teach in The Chart is the Mirror .
Let the chart speak.
Let the structure guide you — not your emotion.
📘 Shared by @ChartIsMirror

ChoCH: The Quiet Shift Most Traders Ignore“Most traders chase price. Few notice when price quietly turns around.”
Before a trend ends, before a breakout fails, before a setup forms —
There’s often a silent clue: Change of Character (ChoCH) .
What is ChoCH?
Change of Character marks the first structural sign that the market may be reversing — not continuing.
It’s a break in the internal rhythm of price, often happening after a liquidity sweep or inside a key zone.
In simpler terms:
BoS = Continuation
ChoCH = Potential Reversal
Most traders treat ChoCH like a green light to enter... but that’s a mistake.
ChoCH alone doesn’t mean a trend is ready to reverse.
It only tells you the current trend has paused or cracked — not ended.
What matters more is:
– Where the ChoCH happens
– Why it happens
– What came before it
This is where context matters.
How I Use ChoCH in My Trading Framework:
My approach is built around multi-timeframe structure:
✅ H4 – Bias
✅ M15 – Setup Alignment
✅ M1 – Sniper Entry
So when I see a ChoCH on M15 , I ask:
Does this align with my H4 bias ?
Has price entered a key zone or swept liquidity before the shift?
If yes — I start watching closely.
If no — it’s likely just noise.
ChoCH without narrative is just confusion.
BoS vs ChoCH – Know the Difference:
• BoS (Break of Structure) confirms trend continuation
• ChoCH (Change of Character) hints at a trend shift
• They look similar on a chart — but their implications are opposite
Mistake to avoid: Entering just because ChoCH appeared
Better approach: Let it warn you , not trap you
🪞 Final Thought:
ChoCH is not an entry. It’s an invitation.
A quiet shift the market offers only to those still enough to see it.
Some notice it.
Fewer understand it.
Even fewer know what to do after.
That’s the difference between recognizing a change… and trading it with conviction.
💬 If this spoke to you, share your thoughts below.
There’s more beneath the surface — tell me what direction you'd like to explore next.
Some of the most powerful methods I use aren’t shared openly — but those who’ve seen them know why.
You’ll know where to look if it’s meant for you.
📘 Shared by @ChartIsMirror
Smart Money Sell Setup on Gold (15-Min TF)# Smart Money Sell Setup on Gold (15-Min TF)
### 🔍 Market Context:
Gold has recently formed a strong bullish retracement after a sharp impulsive bearish move. Now, price has returned to a critical zone — the **Equilibrium level (EQ)** — which also aligns with a **valid supply zone** and **bearish trendline resistance**.
This zone is often considered the "decision point" where Smart Money evaluates whether to continue upward or resume the previous bearish trend.
---
## 📉 Strategy: Sell Limit Based on Structure + Liquidity
### ✅ Entry Zone:
**3341.500 – 3343.000**
(At the EQ zone + premium pricing area)
### 🛑 Stop Loss:
**Above 3345.000**
(Just beyond the last liquidity wick and top of supply)
### 🎯 Take Profit Targets:
- **TP1:** 3338.000 → First demand zone
- **TP2:** 3332.500 → Liquidity sweep target under previous lows
### 📐 Risk to Reward Ratio:
**1:3 or higher**, depending on execution precision.
---
## 🔎 Confluences Supporting the Setup:
| Factor | Confirmation |
|--------|--------------|
| EQ Zone (50% of previous move) | ✅ |
| Supply Zone | ✅ |
| Bearish Trendline Resistance | ✅ |
| Liquidity above EQ | ✅ |
| CHoCH + BOS (Market Structure Shift) | ✅ |
---
## 🧠 Why This Setup Works:
This is a classic **"Premium Price Rejection"** in a bearish environment, combining:
- Institutional logic (EQ level)
- Structural resistance (previous BOS)
- Liquidity traps above
---
## 🧵 Summary:
- **Sell Limit:** 3341.5 – 3343
- **SL:** 3345
- **TP1:** 3338
- **TP2:** 3332.5
- **RR:** 1:3+
- **Style:** Smart Money / Liquidity + Structure Based
---
🔔 **Disclaimer:** This is not financial advice. Always do your own analysis and manage risk accordingly.
#gold #XAUUSD #smartmoney #tradingview #liquidity #supplydemand #priceaction #forex #structure
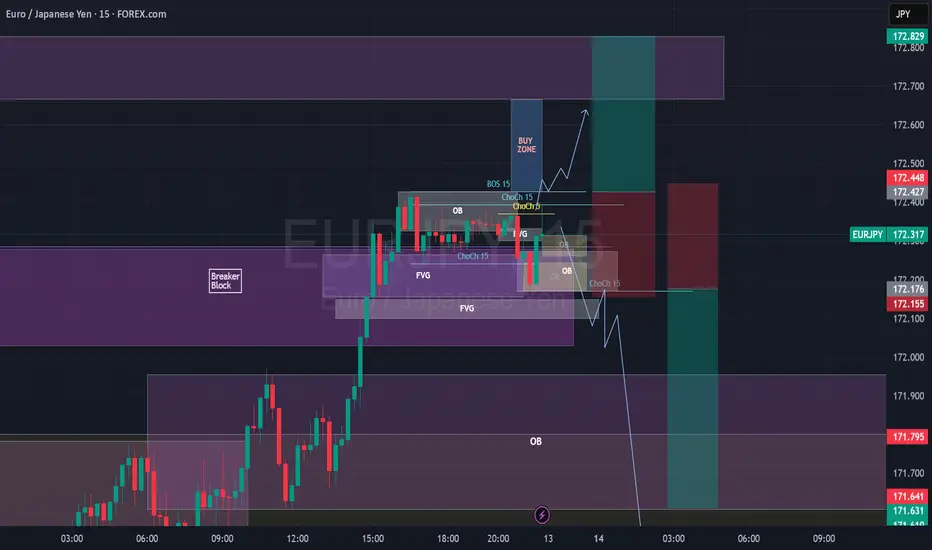
EURJPY Break of Structure, Retest and Fly5m - Monthly timeframes Bullish.
Price body candle closed and retested a 1H BB on 1H Timeframe.
Also retesting a 5M Bullish OB.
I want to wait for price to body candle close above the 15m BoS, create 3m/5m ChoCh, retest and look for Buys towards 172.665 (at the 1H OB or potentially 172.829, top of the 1H OB. SL under the 15m ChoCh.
How to Trade Smart Money Concepts (SMC)\ How to Trade Smart Money Concepts (SMC)\
\ This article explores the foundation, key tools, and practical insights of Smart Money Concepts — and why it’s worth your attention.\
In today's fast-changing financial landscape, Smart Money Concepts (SMC) has become a popular strategy among modern traders. But what is SMC exactly, and how can it improve your trading decisions? This article breaks it down in a simple, professional way for traders at all levels.
---
\ What Are Smart Money Concepts?\
SMC is a trading approach based on the belief that large institutions ("smart money") like banks and hedge funds control most of the market's movements. These institutions often move the market in ways that confuse or trap retail traders. The goal of SMC is to understand and follow the footsteps of these big players.
Instead of relying on simple patterns or indicators, SMC focuses on:
\ - Market structure\
\ - Supply and demand zones\
\ - Liquidity pools\
By aligning your trades with the behavior of smart money, you can position yourself more strategically in the market.
---
\ Key SMC Concepts Explained\
\ Order Blocks\
Order blocks are zones on the chart where large institutions have placed significant buy or sell orders. These zones often lead to strong price reactions and act as hidden support or resistance levels. Order blocks are considered more precise than traditional supply and demand areas.
Example: ()
\ Fair Value Gap (FVG)\
A Fair Value Gap occurs when price moves sharply in one direction, leaving a gap or imbalance in the price action. These areas often get filled later and can act as magnets for price.
In a bearish move, the FVG is the gap between the low of the previous candle and the high of the next one. In a bullish move, it's the reverse.
Example: ()
\ Timeframe Consideration\
If you can’t monitor charts during the day, avoid relying on 5–30 minute setups. Consider 4H or daily timeframes for clearer signals and more manageable trading decisions.
\ Liquidity\
Liquidity refers to price zones where lots of pending orders exist. These are usually at obvious highs, lows, or trendlines. Smart money often targets these areas to trigger stop-losses and generate movement.
One common tool to identify liquidity is a "pivot point," which is a candle with a lower low or higher high than its neighbors.
Example: ()
\ Break of Structure (BOS)\
BOS occurs when price breaks above or below a previous high or low, signaling a possible trend continuation.
Example: ()
\ Change of Character (ChoCH)\
ChoCH happens when the market changes direction. For example, if price breaks a higher low in an uptrend, it may signal a reversal.
Example: ()
Combined with BOS: ()
---
\ How SMC Compares to Wyckoff\
The idea of "smart money" isn't new. Richard D. Wyckoff, a pioneer in technical analysis, laid the foundation for understanding market cycles driven by institutions. His price cycle theory includes four phases:
\ 1. Accumulation\
Smart money buys while the public is unaware.
\ 2. Markup\
Price rises as smart money pushes the market.
\ 3. Distribution\
Smart money sells into public buying.
\ 4. Markdown\
Price falls as the cycle completes.
SMC borrows from this logic but focuses more on structure and liquidity zones. Still, the core idea is the same: understand what big players are doing, and follow them.
\ For deeper insights into Wyckoff, explore additional resources focused on accumulation/distribution cycles.\
---
\ Summary\
Smart Money Concepts give traders a deeper look into market mechanics. By focusing on order blocks, fair value gaps, liquidity, and structure breaks, SMC helps identify high-probability trade setups based on institutional behavior.
It may seem complex at first, but once you understand the basics, SMC can become a powerful tool in your trading strategy. Whether you’re new or experienced, aligning with smart money can improve your edge in the market.

What Is a Change of Character (CHoCH) and How Can You Trade It?What Is a Change of Character (CHoCH) and How Can You Trade It?
Navigating the nuances of Smart Money Concept (SMC) trading requires a keen understanding of market signals like the Change of Character (CHoCH). This concept can help traders detect and react to potential trend reversals. Today, we’ll delve into the mechanics of CHoCHs, explaining how they manifest in different market conditions and how they can be strategically leveraged for trading decisions.
Understanding Breaks of Structure
Understanding Breaks of Structure (BOS) is essential for traders before delving into concepts like Change of Character (CHoCH). A BOS in trading signifies a continuation within the current trend and is marked by a clear deviation from established swing points that indicate previous highs and lows.
In the context of an uptrend, a BOS is identified when the price exceeds a previous high without moving below the most recent higher low. This action confirms that the upward momentum is still strong and likely to continue as buyers push the market to new heights.
Similarly, in a downtrend, a BOS occurs when prices drop below a previous low without breaking the prior lower high, suggesting that sellers remain in control and the downward trend is set to persist.
By recognising these points where the market extends beyond its former bounds, traders can confirm that the current trend is robust and act accordingly. This foundational concept of BOS not only helps in assessing trend strength but also sets the stage for understanding more complex patterns like CHoCH, where the focus shifts from trend continuation to potential trend reversals.
CHoCH Trading Meaning
In trading, a Change of Character (CHoCH) signals a potential shift in market dynamics, often indicating a reversal from the prevailing trend. This concept is particularly valuable as it helps traders discern when the momentum is shifting, offering a strategic point to consider adjusting their positions.
A CHoCH occurs when there's a noticeable deviation in the market's price trend. For example, in a bullish trend characterised by a series of higher highs and higher lows, a CHoCH is indicated by the price failing to set a new high and subsequently falling below a recent higher low. This suggests that buyers are losing control, and a bearish trend could be emerging.
Similarly, during a bearish trend marked by lower highs and lower lows, a bullish CHoCH would occur if the price unexpectedly breaks above a recent lower high. This break indicates that sellers are losing their grip, and a bullish trend may be starting.
The Significance of CHoCHs Across Timeframes
The fractal nature of financial markets means that patterns and behaviours recur across various timeframes, each providing unique insights and implications for trading. Understanding CHoCHs in different timeframes is crucial for traders to effectively align their strategies with both short-term opportunities and long-term trend shifts.
In intraday trading, where decisions are made on lower timeframes (like minutes or hours), a CHoCH can signal a possible short-term trend reversal. For example, if a currency pair in a downtrend on a 15-minute chart suddenly posts a higher high, this could indicate a weakening of the bearish momentum, suggesting a potential bullish reversal.
Traders might use this information to close short positions or to consider a long position, capitalising on the emerging upward trend. These short-term CHoCHs allow traders to respond quickly to market changes, potentially securing returns before larger market shifts occur.
Conversely, CHoCHs observed on higher timeframes, such as daily or weekly charts, are particularly significant because they can indicate a shift in the broader market trend that might last days, weeks, or even months. Such changes can then be used by both long and short-term traders to adjust their positioning and directional bias.
How to Identify a CHoCH
The initial step to identify a CHoCH in trading involves clearly defining the existing trend on a specific timeframe. This is done by marking the significant swing highs and lows that delineate the trend's progress. These points should represent somewhat meaningful retracements in the price, providing clear markers of trend continuity or potential reversal points.
According to the Smart Money Concept (SMC) theory, the integrity of an uptrend is maintained as long as the price does not trade through the most recent significant higher low. Conversely, a downtrend is considered intact if the price does not surpass the most recent significant lower high. Therefore, traders focus their attention on these critical points.
To identify a CHoCH, traders watch for a break in these crucial high or low points. For instance, in an uptrend, a bearish CHoCH is indicated when the price achieves a higher high but then reverses to descend below the previous significant higher low.
Similarly, in a downtrend, a bullish CHoCH occurs when the price drops to a lower low before reversing to break above the previous significant lower high, setting a new high. Both types of breaks signal a potential reversal in the trend direction.
How to Trade a CHoCH
When trading a CHoCH, it’s essential to recognise that it should be integrated with other aspects of the SMC framework to get the best results. This includes the use of order blocks and imbalances, which are key components in identifying potential reversals.
Order Blocks and Imbalances
An order block is essentially a substantial consolidation area where significant buying or selling has occurred, and prices often revisit these zones before reversing. These blocks can be seen as levels where institutional orders were previously concentrated.
An imbalance, also known as a fair value gap, occurs when the price moves sharply up or down, leaving a zone that has not been traded extensively. Price often returns to these gaps to 'fill' them, establishing equilibrium before a potential reversal happens.
In practice, traders can look for a sequence where the price first approaches an order block and begins to fill any existing imbalances. This setup increases confidence in a potential reversal. As the price meets these criteria and a CHoCH occurs, this indicates that the influence of the order block is likely to initiate a price reversal.
Practical Example on GBP/USD
Consider the 4-hour chart of the GBP/USD pair above. We see the pair encounter an order block on the left, one that’s visible on the daily chart. As the price interacts with this block, it begins to retrace, attempting to fill the imbalance but moves away. Eventually, the price completes the fill of the imbalance and meets the previously established order block.
Switching to a 1-hour timeframe, this scenario unfolds similarly. After reaching the order block on the 4-hour chart, another CHoCH occurs, signalling the start of a new uptrend. This lower timeframe CHoCH, following the meeting of the order block, corroborates the potential for a reversal initiated by the higher timeframe dynamics.
This example illustrates how CHoCHs can be effectively utilised across different timeframes, tying back to the fractal nature of markets discussed earlier. By recognising these patterns and understanding their interaction with order blocks and imbalances, traders can strategically position themselves to capitalise on potential market reversals, aligning their trades with deeper market forces at play.
CHoCH vs Market Structure Shift
A Market Structure Shift (MSS) is a specific type of Change of Character that includes additional signals suggesting a potential trend reversal. Unlike a straightforward CHoCH that typically indicates a trend is shifting but may also be a false break, an MSS can be seen as a higher confluence CHoCH. An MSS occurs after the market first makes a key movement contrary to the established trend—forming a lower high in an uptrend or a higher low in a downtrend—without plotting a higher high or lower low.
Following these preliminary signals, an MSS is confirmed when there is a decisive break through a significant swing point accompanied by a strong displacement (i.e. impulse) move, creating a CHoCH in the process. This sequence not only reflects that the prevailing trend has paused but also that a new trend in the opposite direction is establishing itself.
Due to these additional confirmations, an MSS can offer added confirmation for traders, indicating a stronger likelihood that a new, sustainable trend has begun. This makes the MSS particularly valuable for traders looking for more substantiated signals in their trading strategy.
The Bottom Line
The concept of a CHoCH is instrumental in navigating the complexities of SMC trading. By identifying these crucial market signals, traders may align their strategies to capitalise on market movements efficiently.
FAQs
What Is CHoCH in Trading?
In trading, CHoCH is a technical observation that signifies a change in the trend's character, where the price movement breaks from its established pattern of highs and lows, suggesting a potential reversal or substantial shift in the market's direction.
What Is CHoCH in SMC Trading?
In Smart Money Concept (SMC) trading, a Change of Character (CHoCH) refers to a clear shift in market behaviour that indicates a potential reversal of the prevailing trend. This concept is used by traders to detect early signs of a momentum shift that might lead to significant changes in price direction, enabling strategic adjustments to their trading positions.
What Is a CHoCH in the Market Structure?
A CHoCH in market structure is identified when there is an observable deviation from established price patterns — specifically when new highs or lows contradict the current trend. It signifies that the previous market sentiment is weakening, and a new opposite trend may be starting, prompting traders to reassess their strategies.
How Do You Identify a CHoCH?
Identifying a CHoCH involves monitoring significant swing highs and lows for breaks that are contrary to the existing trend. For instance, in an uptrend, a CHoCH would be indicated by a failure to reach a new high followed by a drop below the recent higher low, suggesting a shift to a bearish outlook.
What Is ChoCH vs BOS in Trading?
While both CHoCH and Break of Structure (BOS) are critical in assessing market dynamics, they serve different purposes. CHoCH indicates a potential trend reversal by highlighting a significant change in the price pattern. In contrast, a BOS indicates a continuation of the current trend by showing the price surpassing previous significant highs or lows, reinforcing the ongoing direction.
This article represents the opinion of the Companies operating under the FXOpen brand only. It is not to be construed as an offer, solicitation, or recommendation with respect to products and services provided by the Companies operating under the FXOpen brand, nor is it to be considered financial advice.

Learn Best Change of Character CHoCH Model in Trading with SMC
Most of the SMC traders get Change of Character CHoCH WRONG!
In this article, I will share with you Change of Character models that have a low accuracy and better to be avoided.
I will teach you the best CHoCH model for Forex Gold trading and show you how to identify it easily.
Let's start with the basic theory first and discuss what Change of Character signifies.
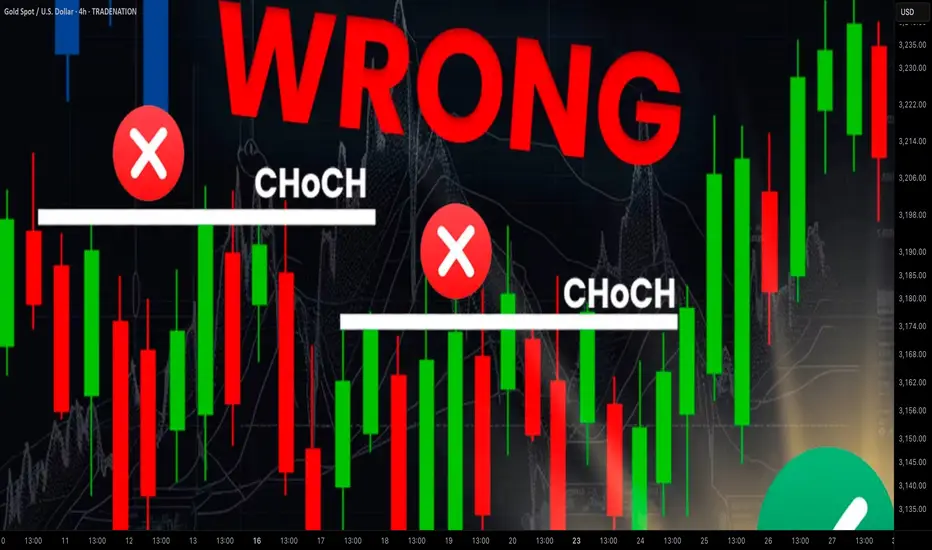
Change of Character in Bearish Trend
In a downtrend, Change of Character CHoCH is an important event that signifies a violation of a bearish trend.
CHoCH is confirmed when the price breaks and closes above the level of the last lower high.
Above, is a text book Change of Character model in a bearish trend.
For the newbie traders, such a price action provides a strong signal to buy while it fact it is NOT .
One crucial thing is missing in this model to confirm a bullish reversal.
According to basic trend analysis rules, we say that the market trend is bullish if the price forms a bullish impulse, retraces and sets a Higher Low HH , forms a new bullish impulse with a new Higher High HH.
Only then, we can say that the market is trading in up trend.
CHoCH model above confirms a bearish trend violation BUT it does not confirm a trend change.
Such a model may easily signify a deeper correction.
Look what happened with GBPNZD.
Though the price formed a confirmed bearish CHoCH, it was a false signal and just an extended correction.
That's a perfect bullish reversal model.
It combines CHoCH and conditions for a bullish trend.
Such a union is extremely accurate in predicting up movements.
Examine a price action on USDJPY.
Not only the price formed a confirmed CHoCH but also we see a start of a new bullish trend.
Change of Character in Bullish Trend
In an uptrend, Change of Character CHoCH is a significant event that signifies a violation of a bullish trend.
CHoCH is confirmed when the price breaks and closes below the level of the last higher low.
Above is a typical model of a bearish CHoCH.
For many traders, that is the signal to open short.
However, it is not that accurate and one important component is missing there.
According to basic price action rules, the market trend is bearish
if the price forms at least 2 bearish impulses with Lower Lows LL and a pullback between them with a Lower High LH.
Only when these 3 conditions are met, a bearish trend is confirmed .
Perfect bearish Change of Character model should include both CHoCH and a bearish trend price action. That will confirm a violation of a bullish trend and start of a new bearish trend.
EURCAD has a very strong potential to continue falling:
not only we see a valid bearish Change of Character but also
a start of a new bearish trend based on a price action.
Next time when you identify CHoCH on forex market, make sure that you check the preceding price action. It will help you to more accurate assess reversal probabilities and make a wiser trading decision.
❤️Please, support my work with like, thank you!❤️
I am part of Trade Nation's Influencer program and receive a monthly fee for using their TradingView charts in my analysis.
GOLD: A Week After Israel Bombs Iranmy view on where gold is going and how i caught the buy on friday after much accumulation

AAVEUSDT → A false breakdown provokes a change of characterBINANCE:AAVEUSDT.P maintains a bullish market structure. The coin is consolidating, with bulls trying to hold their ground above the key support line.
Against the backdrop of a correction, the price is testing liquidity, with a false breakdown of support provoking a change in character to bullish within the local timeframe. Bulls are trying to maintain the bullish structure.
The price is breaking through the resistance of local consolidation, forming a change in character, but before growth, the market may close the gestalt in the form of an order block or liquidity located in the 249.5 zone.
Support levels: 249.11, 240.0
Resistance levels: 274.27, 280.47
Technically, the coin looks quite good and promising overall. If the bulls hold their ground in the 249-250 zone, then in the short to medium term, we could see good movement with the possibility of new highs...
Best regards, R. Linda!

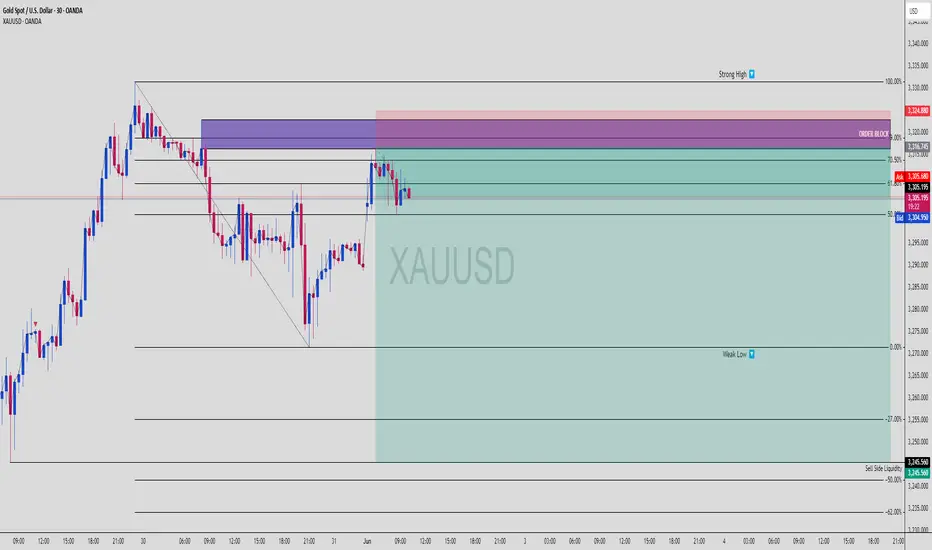
XAUUSD | Premium Zone Hit – Is Gold Ready to Nuke?XAUUSD | 30-Min Bearish Setup – OB Tap + Liquidity Engineering
Let’s break this down ninja-style ⚔️
📌 1. Market Context:
Gold has retraced into a premium pricing zone after a significant sell-off and is now:
Respecting a refined bearish Order Block
Sitting at 61.8–70.5% Fibonacci retracement (textbook premium)
Below a strong high (liquidity magnet)
This is classic smart money engineering:
➡️ Pull back
➡️ Lure in breakout buyers
➡️ Raid the high
➡️ Dump toward liquidity
🧠 2. Key Levels:
📈 Strong High: 3,324.880
🟪 Order Block Zone: ~3,316.745 to 3,324.880
🔻 Current Price: ~3,307.000
🔵 Weak Low: 3,270.000
🩸 Sell Side Liquidity: 3,245.560
We’re watching for a possible rejection from the OB and a drive down into the Sell Side Liquidity zone.
📊 3. Entry Plan (Confirmation-Based):
Wait for a bearish M5–M15 BOS from OB
Look for FVG entry or last mitigation
Target weak low & SSL
Maintain 1:2 to 1:4 RRR depending on entry precision
Ideal RR Target:
🎯 TP: 3,245.560
🛑 SL: Just above 3,324.880
🔁 RR ~ 1:3+
📉 4. SMC Story:
🧩 Price swept internal liquidity and tapped into premium zone
🔍 OB + Fib confluence = high-probability reaction area
🧲 Weak low is unprotected = juicy target for sell-off
🤖 This move could create displacement and fuel next bearish leg
Smart Money is looking to trap late longs before hitting the liquidity pool.
🎯 5. Bonus Tip:
If you’re on M1 or M5, scale into partials as the move confirms via:
Bearish engulfing
BOS + FVG combo
Lower timeframe mitigation plays
Stay reactive, not predictive. Let the market confirm the trap. ⚠️
💬 Drop “Gold Trap Setup 👑” in the comments if you see the same thing
🔁 Save this to track the next move
🎯 Follow @ChartNinjas88 for daily sniper setups!
BTCUSD Breakdown from Pennant – MMC Structure Analysis + Target🧠 Introduction: Why This Chart Matters
Bitcoin recently provided a textbook example of market manipulation, where the price action formed a bullish-looking pattern (Pennant), trapped traders with a fake breakout, and then reversed strongly to the downside. By using Mirror Market Concepts (MMC), we can clearly see the logic behind this move—how the market mirrored a previous pattern and fulfilled a predictable target zone.
This analysis breaks it all down, step-by-step, for both educational and practical trading purposes.
🔍 Detailed Chart Breakdown:
1️⃣ The Illusion – Bullish Pennant Formation
Initially, BTC/USD formed what looked like a bullish pennant—a common continuation pattern in technical analysis. The pattern appeared after a sharp upward move, followed by converging trendlines suggesting consolidation.
Retail traders often anticipate a breakout above the pennant as a sign of bullish continuation. This is where the trap begins.
Why It’s a Trap: The pattern looked clean and reliable—but the context told another story. This move was designed to lure breakout traders into long positions right before a reversal.
2️⃣ The Fakeout – Liquidity Grab Above the Pattern
Shortly after the pennant formed, price pushed above the upper trendline, triggering breakout entries and stop losses of short-sellers. But instead of continuing up:
The price reversed sharply.
This aggressive move confirmed the fakeout.
This is a classic example of a liquidity hunt, where the market moves briefly in one direction to gather orders before executing the real move.
📌 MMC Insight: This behavior mirrors a prior setup—price previously faked upward, then dropped to a key demand zone. The mirror pattern gives a clue that the same outcome might repeat.
3️⃣ CHoCH – Change of Character Confirmed
After the fakeout, BTC broke below a key internal support and trendline structure, signaling a CHoCH (Change of Character)—a shift from bullish to bearish market control.
This moment is crucial:
It confirms the smart money’s intention.
It signals that the previous bullish move was just a setup.
Sellers now have control.
💡 Pro Tip: CHoCH is one of the earliest and most reliable signs of a reversal when combined with liquidity patterns.
4️⃣ Trendline Break & Structural Sell-Off
The break of the trendline following CHoCH solidified the bearish direction. This was the best confirmation-based entry point, as the structure flipped and began forming lower highs and lower lows.
5️⃣ Target Fulfilled – Previous Demand Zone Hit
The price then continued down aggressively and hit the marked MMC target zone. This area coincided with:
A previous demand zone (where buyers stepped in before).
A Mirror Market reversal point, seen earlier in the chart.
This fulfillment of the MMC target validates the entire analysis—from trap to reversal to target.
🎯 Key Zones:
Fakeout High: $69,600 area (liquidity sweep)
CHoCH Break Level: Around $69,100
Trendline Break Confirmation: $69,000
Final Target Zone: $68,500–$68,700
📈 Trading Strategy Recap:
Entry Idea: Enter short after CHoCH and trendline break
Stop Loss: Above fakeout high ($69,600+)
Take Profit: MMC demand zone ($68,500–$68,700)
This trade offered excellent risk-to-reward and confluence using multiple tools (MMC, CHoCH, structure, liquidity sweep).
🧠 What You Can Learn from This Setup:
Patterns Can Lie: A pattern like a pennant isn’t enough—context is key.
Liquidity Is King: Understand where the market needs to go to collect orders.
Mirror Market Concepts Work: Historical behavior often repeats in reverse. Use MMC to forecast likely outcomes.
CHoCH is Powerful: It's your early alert system for trend changes.
🔎 Final Thoughts:
This BTC/USD chart is a powerful example of how smart money operates—with manipulation, pattern traps, and mirrored market behavior. If you’re a price action trader or use MMC, this breakdown is a must-study.
Don't just trade patterns—trade context. Look for traps. Use MMC. Watch CHoCH. And always have a mapped target based on structure.

XRPUSDT 4H | Untested Demand Zone RevisitIn this 4-hour chart analysis of XRPUSDT, I’m focusing on a clear and well-defined untested demand zone between 2.05–2.13 USDT . Unlike the first demand zone (already tested and played out), this second zone has not been retested since its formation, making it a fresh area of interest for a potential long setup.
Why this matters :
Untested demand zones often act as powerful magnets for price when revisited, as they represent areas where large buy orders might be waiting to be filled. Because this zone has not been revisited yet, there’s a higher probability for a bullish reaction when price returns to it.
Key Technical Factors :
✅ The 2.05–2.13 demand zone was formed following a significant bullish impulse that created a clear break of structure to the upside.
✅ Price is currently consolidating above this demand zone and also above a potential bearish CHoCH at 2.0784 . This suggests that the bullish structure is still valid unless price breaks below 2.0784.
✅ My bullish target is 2.65 USDT , where previous highs were formed and potential liquidity exists.
✅ My stop loss is set just below the demand zone, around 2.05 , to protect against a deeper retracement or a shift in market structure.
My Thought Process :
I expect that if price returns to the demand zone, there will be a strong chance for buyers to step in and push the market higher. However, I’m aware that if price breaks below 2.0784 , it would signal a bearish CHoCH and invalidate the long scenario. Therefore, patience is key — I’ll wait for price to either test the zone and react strongly or stay above 2.0784 to keep the bullish bias intact.
Clear Trade Setup :
📌 Entry Zone : 2.05–2.13
🛑 Stop Loss : Below 2.05
🎯 Take Profit : 2.65
🧩 Invalidation : Break below 2.0784
💬 Let me know if you have a similar zone marked out or if you see a different setup! Let’s share ideas and refine our strategies together.

USDJPY Just Flipped — Liquidity Has a New Target🧠 Smart Money Breakdown: USDJPY | 15-Min Chart
We’ve got a textbook bearish reversal setup forming right now on USDJPY, and Smart Money traders are paying close attention.
🔄 1. Change of Character (ChoCh)
The first key sign was a ChoCh, which flipped the internal structure from bullish to bearish. This signals a potential shift in market control from buyers to sellers — Smart Money often initiates big moves after such a flip.
🟫 2. Bearish Order Block + Rejection Wick
Price pulled back right into a fresh bearish Order Block (OB) around the 148.056–148.337 zone. This OB lines up perfectly with the upper trendline + internal liquidity area.
Price is now rejecting hard from this level, signaling Smart Money sell-side pressure.
🕳 3. Fair Value Gap (FVG) Below
Below current price lies a clean FVG, serving as a magnet for price. Smart Money often targets these imbalances to rebalance the market.
The gap extends from around 146.200 to 147.400 — with Sell Side Liquidity resting right below at 145.872. That’s the likely kill zone. 💀
📐 4. Trade Setup (R:R Approx. 3.5:1)
🔼 Entry Zone: 147.980–148.050 (inside OB)
❌ Stop Loss: Just above OB: 148.400
✅ Target: 145.872 (Sell Side Liquidity sweep)
Perfect for swing traders and intraday SMC setups.
📊 Strategy:
Look for:
Bearish engulfing candle confirmation
Break of minor internal low (lower TF BOS)
Entry on OB rejection with tight SL above high
Bonus: Enter partials on FVG fill, hold runner to liquidity.
📎 Confluences:
✅ ChoCh confirmed
✅ Bearish OB
✅ Price rejecting from premium zone
✅ FVG below = imbalance magnet
✅ Sell-side liquidity clearly marked
⚠️ Risk Reminder:
Let price show intent before jumping in
Use confirmation, not assumption
Trade what the chart says, not what you hope
🔚 Summary:
Smart Money has flipped the script. With a strong ChoCh, OB rejection, and an FVG inviting price lower, this setup screams bearish continuation.
🔻 Expecting a clean run into liquidity. Stay sharp. 🧠
💬 Drop a “💀” if you’re eyeing the same setup.
📈 Follow for more clean SMC plays weekly.

BTCUSD Double Tap Into OB Before Massive Sell-Off! 2,000+ PipsHere’s why this could be one of the cleanest bearish setups of the week based on institutional flow and price action:
🚨 Step 1: Liquidity Engineering in Full Effect
We’ve got multiple areas where price was engineered to grab liquidity — clearly visible with those highlighted zones. Bitcoin pumped into a Strong High, tagging liquidity above a key trendline while respecting an internal parallel channel.
This move was not random. It was a textbook liquidity sweep.
🔁 Step 2: Order Block + 70.5% Fib Confluence
After the sweep, price retraced precisely into a bearish Order Block that overlaps perfectly with the 70.5% Fibonacci level — a hidden gem Smart Money loves to use for optimal entries. It’s the sniper zone.
This is where the first rejection came in, marking the start of bearish intent.
⚠️ Step 3: Break of Structure + Weak Low Exposed
As price dropped, it broke back under a weak low, confirming shift in market structure. This is your Change of Character (ChoCh) — the moment sellers regain control.
We’re now seeing retracement candles struggling to push above the OB/Fib zone. Rejection here confirms the setup.
🎯 Target Zones Breakdown:
✅ TP1 - Weak low around 110,200
✅ TP2 - -27% Extension (~109,500)
✅ TP3 - -62% Fib extension (109,268)
🚀 Extended Target - Possible sweep of Sell Side Liquidity all the way to 108,000–107,500
This is a potential 2000+ pip move if the full extension plays out.
🧠 Market Psychology in Play:
Institutions love to trap traders long after major breakouts. That last pump into the high? It wasn’t retail demand — it was liquidity generation. Now that they’ve swept the highs, they're driving price down to rebalance and mitigate.
Every highlighted zone on this chart? It’s a Smart Money footprint.
📌 Entry Game Plan:
Watch how price behaves around the current OB zone (111,250–111,618).
If price rejects and flips back under the midpoint (111,116), that’s your trigger.
Enter with tight SL above 111,750 and aim for TP1, TP2, and trail the rest to TP3 or lower.
📈 Risk Management Reminder:
Set your SL above structure.
Don’t overleverage — this is a clean setup, but patience is 🔑.
Let price come to you, not the other way around.
✍️ Final Thoughts:
This BTCUSD setup screams Smart Money — we’ve got:
Liquidity grabs ✅
Clean OB + Fib confluence ✅
ChoCh + structural rejection ✅
Strong R:R with multiple targets ✅
This might be the move to catch before the weekend liquidity sweep.
💬 Comment "BTC MOVE" if you’re watching this with me!
🔁 Tag your trading fam who needs to see this breakdown!

Will Gold Finally Reverse?After a strong and extended uptrend, gold is now ranging. On the 4H timeframe, a clear CHoCH broke structure, hinting at early weakness.
The inducement above price acts like a magnet. If swept, it could trigger a reaction from the 4H supply zone. That area marks a potential turning point for a deeper shift.
If this rejection holds, we may be witnessing the first signs of a high-timeframe reversal.

CHFJPY - BEARISH MOVEHello Traders !
On Tuesday 13 May, The CHFJPY reached a strong resistance level (176.482 - 176.010).
The price broke the higher low (change of character).
So, I expect a bearish move📉
________________
TARGET: 173.280🎯

Supply Zone Rejection & BOS Confirm Downtrend ContinuationAfter a clean shift in structure marked by a CHoCH and subsequent BOS, price retraced into a clear supply zone—offering a high-probability short setup. Here's how the setup unfolded:
🧠 Trade Rationale
Break of Structure (BOS): Price broke below a key higher low, confirming a bearish structure.
Change of Character (CHoCH): Signaled the end of bullish momentum earlier in the sequence.
Supply Zone: Price retraced into a well-defined supply area (aligned with imbalance and prior support turned resistance).
Entry: Short taken as price tapped into the supply and failed to make a new high—further confirmed by a lower timeframe CHoCH.
Target: Aiming for the next BOS level below, aligning with clean equal lows/liquidity draw.
🔍 Key Concepts Highlighted
Structure-based trading with CHoCH and BOS labeling.
Supply zone entries based on price action confirmation.
Risk-to-reward driven decision-making (tight SL above supply, TP near next demand).
💬 What do you think? Do you wait for confirmation within supply, or enter at touch?
Let’s discuss—drop your thoughts and feedback!

How to use Dynamic Market Structure to track market moves🔍 Idea Overview
This chart demonstrates the effectiveness of the Dynamic Market Structure Indicator in live conditions, capturing key Break of Structure (BoS) and Change of Character (ChoCH) points. Each zone dynamically adapts based on price behavior and helps identify crucial turning points.
📌 Highlights from the Chart
• ✅ Early BoS detection led to accurate identification of the bullish breakout before the major rally starting May 7.
• ✅ Multiple successful ChoCH zones indicated potential reversal areas and pause zones during sideways consolidation.
• ✅ The green (BoS) and red (ChoCH) horizontal zones aligned perfectly with price reaction levels, acting as reliable support/resistance.
• ✅ During the pullback post-high, the indicator caught clear bearish ChoCH before price dropped nearly $2,000, showing high responsiveness.
📊 Summary of Performance
• Rally captured from ~95,000 to ~104,000 with early BoS signals.
• Sideways zones around 103,000–104,000 marked with structural shifts that predicted stalling.
• Post-drop behavior accurately highlighted re-test of ChoCH zones before reversal attempts.
⚙️ Indicator Logic (Brief)
• BoS (Green): Confirms trend continuation when structure breaks in the direction of the trend.
• ChoCH (Red): Signals a potential trend reversal with key level break.
No repainting. Zones are locked once confirmed.
In volatile markets like BTC, accurate detection of structural shifts can define risk and opportunity. This indicator consistently tracked evolving zones and highlighted major inflection points — without lag or overfitting.

BTCUSD ChoCh + FVG Rejection = Drop Incoming🧠 Smart Money Concepts | BTCUSD 1H Breakdown
Here’s a crystal-clear Smart Money setup on Bitcoin that screams bearish intent. The wedge was a trap, the ChoCh confirmed the flip, and now price is reaching back into a Fair Value Gap that’s likely to reject hard.
Let’s dissect the setup:
🧱 1. Structure: Rising Wedge + ChoCh
Bitcoin climbed with a grinding structure inside a rising wedge — classic liquidity trap.
Smart Money lured in longs, then snapped structure (ChoCh) at ~102,700 — that’s your reversal confirmation.
📉 2. Fair Value Gap (FVG) Rejection Zone
After the ChoCh, price retraced into a juicy FVG zone around 103,219 – 103,913 —
right below a Strong High at 105,900. Inducement bait for breakout traders.
That’s premium pricing in a bearish environment = high-probability short.
🎯 3. Liquidity Target: Weak Low + Sell Side Sweep
Price is eyeing the Weak Low at 99,114, and below that sits the real magnet:
Sell Side Liquidity at ~98,800. That’s your ultimate draw.
📐 4. Trade Idea (R:R Approx. 3.5:1)
📍 Entry Zone: 103,200–103,900 (FVG zone)
❌ SL: Above Strong High @ 106,000
✅ TP1: Weak Low at 99,114
🏁 TP2: Sell Side Liquidity @ ~98,800
🧩 Confluences Checklist:
✅ Rising Wedge Trap
✅ ChoCh Confirmed
✅ FVG in Premium Zone
✅ Bearish Order Flow
✅ Weak Low + Sell Side as Target
⚠️ Caution:
Don’t short blindly. Wait for reaction in the FVG zone — ideally a rejection wick or lower timeframe BOS.
If price closes above the Strong High — setup is invalidated.
📊 Summary:
This BTCUSD setup is dripping with manipulation. Smart Money engineered a wedge, flipped structure, and is now likely to distribute before the next leg down.
Stay sharp. Trade with the big players, not against them.
💬 Type “🚨 BTC Short Alert” in the comments if you caught this setup too.
📉 Follow @ChartNinjas88 for more SMC alpha and sniper setups.
👀 Tag a fellow trader who thinks wedges always break upward 😂
