CHR/USDT Major Breakout! Bullish Momentum Ignites🧠 Complete Technical Analysis:
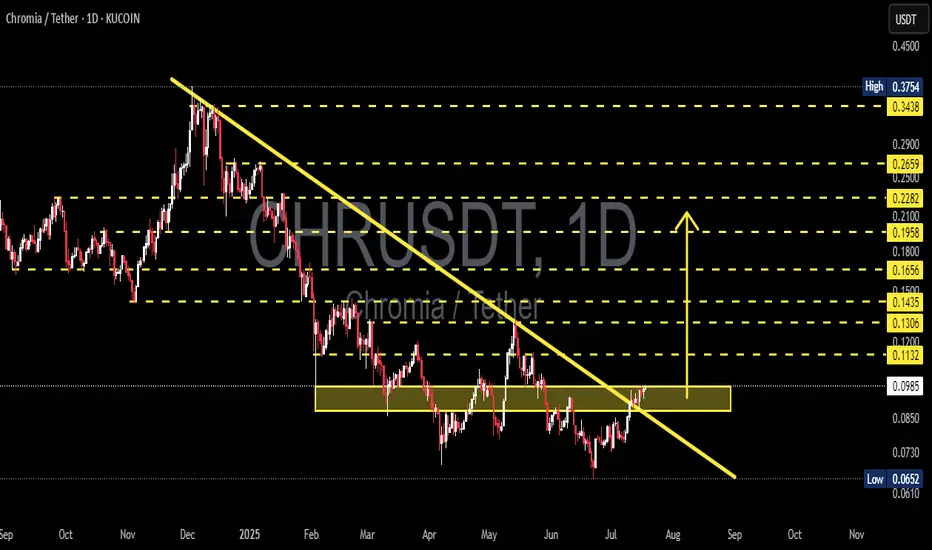
After months of being trapped in a prolonged downtrend since December 2024, Chromia (CHR) has finally shown signs of awakening. The price has successfully broken out of a major descending trendline, while also breaching a critical consolidation resistance zone between $0.093–$0.098 (highlighted in yellow).
This breakout not only indicates a potential trend reversal, but also opens the door for a medium-term bullish rally if sustained.
📊 Structure and Pattern Highlights:
Descending Trendline Breakout: CHR has decisively broken out of the long-standing bearish structure.
Validated Accumulation Zone: The $0.075–$0.098 range has proven to be a strong accumulation base after multiple tests.
Layered Horizontal Resistances: A clear ladder of resistance levels awaits as price pushes upward.
Potential Bullish Patterns: With a healthy pullback and higher low, CHR could form an Inverse Head and Shoulders or a Bullish Flag continuation pattern.
📈 Bullish Scenario:
If CHR can hold daily candle closes above the $0.098 breakout zone, the following targets come into play:
Target Level Description
$0.113 Breakout confirmation zone
$0.120 Psychological mini-resistance
$0.130 Historical horizontal resistance
$0.143 Previous local top
$0.165 Key breakdown level
$0.180 – $0.228 Medium-term target range with historical supply
$0.265 – $0.290 Strong resistance area from past distribution
$0.343 – $0.375 Long-term bullish target
💡 Note: If buying volume increases and BTC remains stable or bullish, these targets become increasingly realistic.
📉 Bearish Scenario:
However, if this breakout turns out to be a fakeout, CHR may fall back below the $0.093 zone and retest:
$0.085 (minor support)
$0.075 (base support)
As low as the demand zone around $0.065–$0.070
📌 Candle close and volume confirmation are critical. Avoid chasing price without solid validation!
📎 Conclusion & Strategy:
> CHR/USDT is currently at a pivotal moment. This breakout from a multi-month downtrend signals a potential trend reversal and a medium-term opportunity for swing traders and position holders.
📈 Trading Strategy Suggestion:
Entry: After a successful retest of the $0.095–$0.098 zone
Stop Loss: Below $0.085
Take Profit: Scale out at resistance levels listed above
#CHRUSDT #Chromia #CryptoBreakout #TrendReversal #AltcoinSeason #TechnicalAnalysis #CryptoTrading #BullishPattern #BreakoutSignal #ChartSetup
Chrusdtlong
#CHR Is gearing up for an update ?#CHR
The price is moving within a descending channel on the 1-hour frame, adhering well to it, and is on its way to breaking it strongly upwards and retesting it.
We have a bounce from the lower boundary of the descending channel. This support is at 0.0788.
We have a downtrend on the RSI indicator that is about to break and retest, supporting the upside.
There is a major support area in green at 0.0750, which represents a strong basis for the upside.
Don't forget a simple thing: ease and capital.
When you reach the first target, save some money and then change your stop-loss order to an entry order.
For inquiries, please leave a comment.
We have a trend to hold above the 100 Moving Average.
Entry price: 0.0793
First target: 0.0820
Second target: 0.0843
Third target: 0.0861
Don't forget a simple thing: ease and capital.
When you reach the first target, save some money and then change your stop-loss order to an entry order.
For inquiries, please leave a comment.
Thank you.

#CHR READY TO NEW EXPLODE !#CHR
The price is moving within a descending channel on the 1-hour frame and is expected to break and continue upward.
We have a trend to stabilize above the 100 moving average once again.
We have a downtrend on the RSI indicator that supports the upward break.
We have a support area at the lower boundary of the channel at 0.0474, acting as strong support from which the price can rebound.
Entry price: 0.0756
First target: 0.0768
Second target: 0.0785
Third target: 0.0810
To manage risk, don't forget stop loss and capital management.
When you reach the first target, save some profits and then change the stop order to an entry order.
For inquiries, please comment.
Thank you.

CHRUSDT 1W AnalysisCHR ~ 1W Analysis
#CHR Buy back gradually from here if you still have confidence in this coin with a short term target of at least 20%+ from here.

CHRUSDT 1D AnalysisCHR ~ 1D Analysis
#CHR Buy gradually from here if you still have confidence in this coin with a short term target of at least 15%+ from here.

CHRUSDT 1DCHR ~ 1D Analysis
#CHR Buy after successfully penetrating this resistant line with a short -term target of at least 10%+ from here.

#CHR/USDT#CHR
The price is moving within a descending channel on the 1-hour frame and is expected to continue upward.
We have a trend to stabilize above the 100 moving average once again.
We have a downtrend on the RSI indicator that supports the upward move with a breakout.
We have a support area at the lower boundary of the channel at 0.0956.
Entry price: 0.1000
First target: 0.1036
Second target: 0.1067
Third target: 0.1100

CHRUSDT 1WCHR ~ 1W Analysis
#CHR If you still have a Conviction on this coin,. Maybe you can consider this support to start buying back from here.

CHROMIA READY TO EXPLODE !!!CHROMIA getting ready to take of 🚀
Don't under estimate this beast will melt the faces soon

CHRUSDT 1WCHR ~ 1W
#CHR If you still have Conviction on this coin,. Buy in stages from here with a minimum target of 20%++

#CHR/USDT Ready to go higher#CHR
The price is moving in a descending channel on the 1-hour frame and sticking to it well
We have a bounce from the lower limit of the descending channel, this support is at 0.2390
We have a downtrend on the RSI indicator that is about to be broken, which supports the rise
We have a trend to stabilize above the moving average 100
Entry price 0.2410
First target 0.2510
Second target 0.2628
Third target 0.2748

CHRUSDT 1WCHR Update ~ 1W
#CHR Again rejected from this resistance line. If you still have Conviction on this coin,. This support block would be a very good buying place for now,. with a minimum target of 20%++, it is only a matter of time until this resistance line is successfully penetrated.

#CHR/USDT#CHR
The price is moving within a 12 hour descending channel pattern, which is a strong retracement pattern
We have a bounce from a major support area in the color EUR at 0.2000
We have a tendency to stabilize above the Moving Average 100
We have a downtrend on the RSI indicator that supports the rise and gives greater momentum and the price is based on it
Entry price is 0.2365
The first target is 0.2690
The second target is 0.3180
The third goal is 0.3744

CHRUSDTCHR ~ 4D
#CHR Continue moving in this descending pattern. Wait for this descending pattern to be successfully broken to start buying this coin.

CHRUSDTCHR ~ 5D ✅
#CHR Make purchases in stages from here. it's just a matter of time until the bulls come back and start pumping these Coins.

CHRUSDTCHRUSDT.
Will CHRUSDT get bids from buyers ?
As the price is at strong support level and bullish divergence indicating the buyers may attack this zone. If this happens and buyers start buying from here then the next target could be 0.305 followed by 0.350
What you guys think of this idea?

#CHR/USDT#CHR
The price is moving in a triangle on the 12-hour frame and we have a support area in green at the 0.350 level
We have a higher stability moving average of 100
We have a good bounce being prepared from the lower border of the triangle once the downtrend breaks to the upside
The RSI indicator has a downtrend that is about to break higher
Entry price is 0.3800
The first target is 0.4121
The second target is 0.4550
The third target is 0.5100

CHRUSDT - Trend + Resistance Breakout!CHRUSDT (1D Chart) Technical analysis
CHRUSDT (1D Chart) Currently trading at $0.123
Buy level: Above $0.121
Stop loss: Below $0.097
TP1: $0.136
TP2: $0.165
TP3: $0.195
TP4: $0.3
Max Leverage 3x
Always keep Stop loss
Follow Our Tradingview Account for More Technical Analysis Updates, | Like, Share and Comment Your thoughts

CHRUSDT Triangle Breakout!CHRUSDT Technical Analysis update
CHRUSDT price is breaking its triangle pattern.
Buy zone : Below $0.29
Stop loss : $0.265
Thanks
Hexa

CHR/USDT - Chromia: BBand Breakout◳◱ On the $CHR/ CRYPTOCAP:USDT chart, the Bband Breakout pattern suggests an upcoming trend shift. Traders might observe resistance around 0.2813 | 0.2972 | 0.3349 and support near 0.2436 | 0.2218 | 0.1841. Entering trades at 0.3636 could be strategic, aiming for the next resistance level.
◰◲ General info :
▣ Name: Chromia
▣ Rank: 197
▣ Exchanges: Binance, Kucoin, Bybit, Huobipro, Gateio, Hitbtc
▣ Category/Sector: Infrastructure - Application Development
▣ Overview: Chromia (previously Chromapolis) is a Layer-1 blockchain that is also an Ethereum Virtual Machine (EVM) compatible Layer-2 solution for Ethereum and the Binance Smart Chain. Chromia is designed to achieve three goals: allow dApps to scale to millions of users, improve the user experience of dApps to match those of centralized applications, and create familiar paradigms that allow developers to build secure applications.
◰◲ Technical Metrics :
▣ Mrkt Price: 0.3636 ₮
▣ 24HVol: 12,843,426.679 ₮
▣ 24H Chng: 12.465%
▣ 7-Days Chng: 36.36%
▣ 1-Month Chng: 28.82%
▣ 3-Months Chng: 183.90%
◲◰ Pivot Points - Levels :
◥ Resistance: 0.2813 | 0.2972 | 0.3349
◢ Support: 0.2436 | 0.2218 | 0.1841
◱◳ Indicators recommendation :
▣ Oscillators: BUY
▣ Moving Averages: STRONG_BUY
◰◲ Technical Indicators Summary : STRONG_BUY
◲◰ Sharpe Ratios :
▣ Last 30D: 2.36
▣ Last 90D: 3.89
▣ Last 1-Y: 0.92
▣ Last 3-Y: 1.04
◲◰ Volatility :
▣ Last 30D: 1.07
▣ Last 90D: 1.11
▣ Last 1-Y: 0.87
▣ Last 3-Y: 1.53
◳◰ Market Sentiment Index :
▣ News sentiment score is N/A
▣ Twitter sentiment score is 0.49 - Bearish
▣ Reddit sentiment score is 0.42 - Bearish
▣ In-depth CHRUSDT technical analysis on Tradingview TA page
▣ What do you think of this analysis? Share your insights and let's discuss in the comments below. Your like, follow and support would be greatly appreciated!
◲ Disclaimer
Please note that the information and publications provided are for informational purposes only and should not be construed as financial, investment, trading, or any other type of advice or recommendation. We encourage you to conduct your own research and consult with a qualified professional before making any financial decisions. The use of the information provided is solely at your own risk.
▣ Welcome to the home of charting big: TradingView
Benefit from a ton of financial analysis features, instruments and data. Have a look around, and if you do choose to go with an upgraded plan, you'll get up to $30.
Discover it here - affiliate link -

CHR Bullish CHR here looks good to be longed here.
Successful retest here can send it 50% more up.
Looking good RR (1:14) from here.
Entry 1550-1580
Stoploss 1500-1520
Note: Not a Financial Advice.

CHR/USDT - Chromia: Trend Reversal◳◱ On the $CHR/ CRYPTOCAP:USDT chart, the Trend Reversal pattern suggests momentum building up for a significant move. Traders might observe resistance around 0.1458 | 0.162 | 0.1935 and support near 0.1143 | 0.099 | 0.0675. Entering trades at 0.1355 could be strategic, aiming for the next resistance level.
◰◲ General info :
▣ Name: Chromia
▣ Rank: 307
▣ Exchanges: Binance, Kucoin, Bybit, Huobipro, Gateio, Hitbtc
▣ Category/Sector: Infrastructure - Application Development
▣ Overview: Chromia (previously Chromapolis) is a Layer-1 blockchain that is also an Ethereum Virtual Machine (EVM) compatible Layer-2 solution for Ethereum and the Binance Smart Chain. Chromia is designed to achieve three goals: allow dApps to scale to millions of users, improve the user experience of dApps to match those of centralized applications, and create familiar paradigms that allow developers to build secure applications.
◰◲ Technical Metrics :
▣ Mrkt Price: 0.1355 ₮
▣ 24HVol: 2,751,739.737 ₮
▣ 24H Chng: 4.714%
▣ 7-Days Chng: 4.59%
▣ 1-Month Chng: 14.79%
▣ 3-Months Chng: 53.35%
◲◰ Pivot Points - Levels :
◥ Resistance: 0.1458 | 0.162 | 0.1935
◢ Support: 0.1143 | 0.099 | 0.0675
◱◳ Indicators recommendation :
▣ Oscillators: BUY
▣ Moving Averages: STRONG_BUY
◰◲ Technical Indicators Summary : STRONG_BUY
◲◰ Sharpe Ratios :
▣ Last 30D: 1.56
▣ Last 90D: 1.89
▣ Last 1-Y: 0.26
▣ Last 3-Y: 1.00
◲◰ Volatility :
▣ Last 30D: 0.98
▣ Last 90D: 0.83
▣ Last 1-Y: 0.81
▣ Last 3-Y: 1.54
◳◰ Market Sentiment Index :
▣ News sentiment score is N/A
▣ Twitter sentiment score is 0.49 - Bearish
▣ Reddit sentiment score is 0.42 - Bearish
▣ In-depth CHRUSDT technical analysis on Tradingview TA page
▣ What do you think of this analysis? Share your insights and let's discuss in the comments below. Your like, follow and support would be greatly appreciated!
◲ Disclaimer
Please note that the information and publications provided are for informational purposes only and should not be construed as financial, investment, trading, or any other type of advice or recommendation. We encourage you to conduct your own research and consult with a qualified professional before making any financial decisions. The use of the information provided is solely at your own risk.
▣ Welcome to the home of charting big: TradingView
Benefit from a ton of financial analysis features, instruments and data. Have a look around, and if you do choose to go with an upgraded plan, you'll get up to $30.
Discover it here - affiliate link -

CHR/USDT - Chromia: Double_Bottom◳◱ We've a Double Bottom pattern on the TSX:CHR / CRYPTOCAP:USDT chart. This pattern is a bullish indication and could indicate a potential trend reversal. We may consider buying at the neckline at the current price. The next resistance key levels are at 0.0977 | 0.1025 | 0.1138 and the major support zones are respectively at 0.0864 | 0.0799 | 0.0686.
◰◲ General info :
▣ Name: Chromia
▣ Rank: 334
▣ Exchanges: Binance, Kucoin, Bybit, Huobipro, Gateio, Hitbtc
▣ Category/Sector: Infrastructure - Application Development
▣ Overview: Chromia (previously Chromapolis) is a Layer-1 blockchain that is also an Ethereum Virtual Machine (EVM) compatible Layer-2 solution for Ethereum and the Binance Smart Chain. Chromia is designed to achieve three goals: allow dApps to scale to millions of users, improve the user experience of dApps to match those of centralized applications, and create familiar paradigms that allow developers to build secure applications.
◰◲ Technical Metrics :
▣ Mrkt Price: 0.094 ₮
▣ 24HVol: 957,337.045 ₮
▣ 24H Chng: 2.285%
▣ 7-Days Chng: 1.91%
▣ 1-Month Chng: -1.45%
▣ 3-Months Chng: -12.15%
◲◰ Pivot Points - Levels :
◥ Resistance: 0.0977 | 0.1025 | 0.1138
◢ Support: 0.0864 | 0.0799 | 0.0686
◱◳ Indicators recommendation :
▣ Oscillators: NEUTRAL
▣ Moving Averages: STRONG_BUY
◰◲ Technical Indicators Summary : BUY
◲◰ Sharpe Ratios :
▣ Last 30D: -1.08
▣ Last 90D: -1.17
▣ Last 1-Y: -0.34
▣ Last 3-Y: 0.86
◲◰ Volatility :
▣ Last 30D: 0.51
▣ Last 90D: 0.72
▣ Last 1-Y: 0.82
▣ Last 3-Y: 1.56
◳◰ Market Sentiment Index :
▣ News sentiment score is N/A
▣ Twitter sentiment score is 0.49 - Bearish
▣ Reddit sentiment score is 0.42 - Bearish
▣ In-depth CHRUSDT technical analysis on Tradingview TA page
▣ What do you think of this analysis? Share your insights and let's discuss in the comments below. Your like, follow and support would be greatly appreciated!
◲ Disclaimer
Please note that the information and publications provided are for informational purposes only and should not be construed as financial, investment, trading, or any other type of advice or recommendation. We encourage you to conduct your own research and consult with a qualified professional before making any financial decisions. The use of the information provided is solely at your own risk.
▣ Welcome to the home of charting big: TradingView
Benefit from a ton of financial analysis features, instruments and data. Have a look around, and if you do choose to go with an upgraded plan, you'll get up to $30.
Discover it here - affiliate link -
