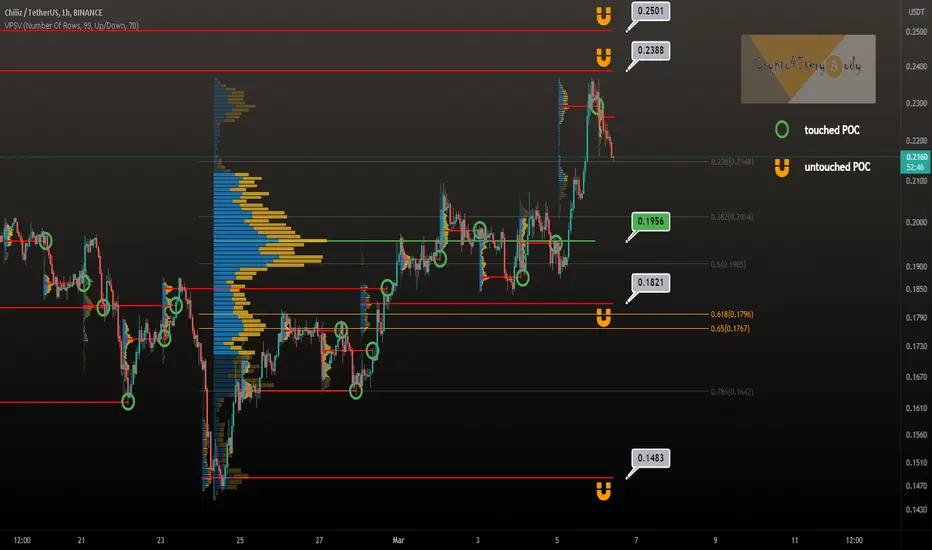
Chiliz CHZ next untouched point of controlChiliz CHZ next untouched point of control...
A correction to $0.1767 (FIB golden pocket) or at least $0.1956 (volume support) would be very healthy and not to bearish IMO.
What do you think? I love Chiliz... who else?
Drop me a nice comment if you'd like me to analyze any other cryptocurrency.
*not financial advice
do your own research before investing
CHZUSD
CHZUSDT H16: 200% gains THE BEST LEVEL TO BUY/HOLD(SL/TP)(NEW)Why get subbed to me on Tradingview?
-TOP author on TradingView
-2000+ ideas published
-15+ years experience in markets
-Professional chart break downs
-Supply/Demand Zones
-TD9 counts / combo review
-Key S/R levels
-No junk on my charts
-Frequent updates
-Covering FX/crypto/US stocks
-before/after analysis
-24/7 uptime so constant updates
🎁Please hit the like button and
🎁Leave a comment to support our team!
CHZUSDT H16: 200% gains THE BEST LEVEL TO BUY/HOLD(SL/TP)(NEW)
IMPORTANT NOTE: speculative setup. do your own
due dill. use STOP LOSS. don't overleverage.
🔸 Summary and potential trade setup
::: CHZUSDT 16H/candle chart review
::: accumulation in progress now
::: price trading in BEAR CHANNEL
::: BULL FLAG setup - more UPSIDE/GAINS
::: setup still valid as of today
::: chart is LOG SCALE
::: get ready to BUY LOW later
::: BUY LOW near 0.12
::: currently re-accumulation in progress
::: sideways/range price action for now
::: alternatively BUY BREAKOUT
::: up to 200% gains possible later
::: short-term pullback/correction
::: is possible / likely
::: however chart looks strong
::: SPECULATIVE SETUP
::: do your own due dill
::: and use proper risk management
::: TP bulls is +200% gains
::: details: see chart
::: FINAL TP is +200%
::: recommended strategy: BUY/HOLD 12cents
::: TP BULLS +200% gains
::: SWING TRADE: BUY/HOLD IT
::: bull run not over yet
::: good luck traders!
::: BUY/HOLD and get paid. period.
🔸 Supply/Demand Zones
::: N/A
::: N/A
🔸 Other noteworthy technicals/fundies
::: TD9 /Combo update: N/A
::: Sentiment mid-term: BULLS
::: Sentiment short-term: PULLBACK/RANGE
RISK DISCLAIMER:
Trading Crypto, Futures , Forex, CFDs and Stocks involves a risk of loss.
Please consider carefully if such trading is appropriate for you.
Past performance is not indicative of future results.
Always limit your leverage and use tight stop loss.


CHZ : SCALPING15 Min. TF
.
.
no professional financial advice please trade at ur acceptable risk. :P
Trade safe and fun
.
Feel free to comment & share ur ideas
-----------
.
Thx @Viktortea :d

Chiliz CHZ Perfect structureChiliz CHZ topped at wave 3 early last year and has spent several months to end wave 4 at the exact 0,382 retracement. CHZ is now starting wave 5 which resides somewhere between 6 and 11

chiliz - chz ..If it reaches the specified areas and gives positive signals,
I think it will be a good opportunity
under observation ..

#Chiliz #CHZ - is this the end of January 2022 move?Chiliz loosing the triangle and volume support.
And from timing point of view this breakout to the downside happens near 2/3 of the pattern length - textbook.
I love Chiliz and am not bearish at the moment - see CHZ on a discount as a long-term HODLer.
But what do you think about that? 😎
Drop me a nice comment if you'd like me to analyze any other cryptocurrency.
*not financial advice
do your own research before investing

CHILIZ AnalysisOn a daily TF, it bounced from the support of $0.24 - $0.255. The next resistance area is $0.295 - $0.30 area, and the major resistance is $0.34 area. The market is recovering, and we may see a $0.30 resistance area test soon. The local support is $0.265 area (Dashed line).


CHZUSD H16: BULLS 50% gains BEST LEVEL TO BUY(SL/TP)(NEW)Why get subbed to me on Tradingview?
-TOP author on TradingView
-2000+ ideas published
-15+ years experience in markets
-Professional chart break downs
-Supply/Demand Zones
-TD9 counts / combo review
-Key S/R levels
-No junk on my charts
-Frequent updates
-Covering FX/crypto/US stocks
-before/after analysis
-24/7 uptime so constant updates
🎁Please hit the like button and
🎁Leave a comment to support our team!
CHZUSD H16: BULLS 50% gains BEST LEVEL TO BUY(SL/TP)(NEW)
IMPORTANT NOTE: speculative setup. do your own
due dill. use STOP LOSS. don't overleverage.
🔸 Summary and potential trade setup
::: CHZUSD 16hours/candle chart review
::: 5 waves sequence BEARS in progress
::: currently WAVE3 in progress
::: BULLS reload low once W3 completes
::: BUY/ACCUMULATE near range lows
::: BOUNCE PLAY for 50% gains
::: up to 50% gains possible later
::: short-term pullback possible
::: bulls wait for Wave3 to complete
::: SPECULATIVE SETUP
::: do your own due dill
::: and use proper risk management
::: TP bulls is +50% gains
::: details: see chart
::: FINAL TP is +50%
::: recommended strategy: BUY/HOLD after correction
::: best entry near range lows
::: TP BULLS +50% gains
::: SWING TRADE: BUY/HOLD IT
::: bull run not over yet
::: good luck traders!
::: BUY/HOLD and get paid. period.
🔸 Supply/Demand Zones
::: N/A
::: N/A
🔸 Other noteworthy technicals/fundies
::: TD9 /Combo update: N/A
::: Sentiment mid-term: BULLS
::: Sentiment short-term: BEARS/DIPS
RISK DISCLAIMER:
Trading Crypto, Futures , Forex, CFDs and Stocks involves a risk of loss.
Please consider carefully if such trading is appropriate for you.
Past performance is not indicative of future results.
Always limit your leverage and use tight stop loss.


UPDATE: CHZ UP 4777% after bull signal - 350% more to come?Please Like or Follow if you enjoyed this content.
UPDATE: The price jumped 4777+% after the bullish Supertrend Ninja signal. The Supertrend Ninja also predicted the big Covid drop of 64% in March 2020. Drops of May 2021, June 2021 and Nov 2021. If this is the bottom, CHZ can go another 350% in the next bull run, till USD Dollar sign on the chart, around 1.20 USDT. Although the Supertrend Ninja hasn't given a bull signal as of yet.
It's only a matter of time. Nothing keeps going down forever. Be patient.
Supports and Resistances are highlighted as grey blocks. Next resistance around 0.37 USDT. If we break down here, next support is around 0.20 USDT. Profits can be taken at each grey block. Supports and resistances are drawn using the indicator 'Yo Show Me Some Support - and Resistances'. Pun intended.
In the chart I am using the Supertrend Ninja indicator, which is a trend-following indicator (Green and red vertical line with arrows).
When the background of the candlestick closes green (vertical line) with an upwards pointing pink arrow. It indicates a possible bullish (up)trend.
With each trade proper risk management is essential. Either by using my script Trailing Stoploss Bottom Activation indicator, visible as grey dots below the candles. Which sends an alert, when current price goes below the previous candle low. Or using my Heikin Ashi Trailing Stoploss Activation, the indicator below with green and red blocks. Or third option, exit when the Supertrend Ninja indicator displays a vertical red line with a downwards pointing black arrow. Remember, the first stop(loss) is always the cheapest stop.
Thank you for reading.
Namasté
Disclaimer: Ideas are for entertainment purposes only. Not financial advice. Your own due diligence is highly advised before entering trades. Past performance is no guarantee of future returns.

CHZ USDTThis is not impossible for CHZ. keep an eye on it! I think it is not bad to take a little risk on it.

CHZ/USDT - Potential 149% SetupHello Traders!
CHZ corrected along with the market and the price returned to the active trading range of $0.2475 - $0.3500
It's possible to look for entry into buying between $0.2800 - $0.3175.
Stop-loss shall be placed under $0.1900
The profit taking targets will be the following price levels
$0,4700
$0,5450
$0,6900
Good luck and watch out for the market
P.S. This is an educational analysis that shall not be considered financial advice

chz / usdt 4 h chartchz / usdt 4 h chart
long idea
you can enter long position after correction
best entry at 0.27

CHZ - My Trading Plan in 3 mins!Hello everyone, if you like the idea, do not forget to support with a like and follow.
Here is the top-down analysis for CHZ, feel free to request any pair/instrument or ask any questions in the comment section below.
Best of luck!


CHZ next possible movesIf current support will not hold then possible "buy" areas are in lower green box. In general will be bullish on pennant breakout upside.

CHZ is about to explode!Hello, everyone!
I found the prefect signal with the Elliott Waves analysis on Chilliz. We can see that the Waves 1, 2, 3 was formed. The Wave 4 is forming now. As we know the Wave 4 usually means the profit taking after Wave 3. As a result Wave 4 develops slowly and usually is formed as A-B-C-D-E triangle correction, which we can see properly on the chart. This wave is next to it’s end, because the full correction cycle was formed and the target zone for Wave 4 (0.5-0.61 Fib) was reached. The target zone for Wave 5 calculates as the distance between Wave 1 start and the Wave 3 end prices plus the Wave 4 end price. This we obtained the $0.78 as the final target to take profit.
Put your stop-loss below the Wave 1 peak ($0.36). This is the nice trade opportunity with the 3:1 risk to reward ratio.
DISCLAMER: Information is provided only for educational purposes. Do your own study before taking any actions or decisions at the real market.

CHZ bounceIn continuation of my previous idea: i have re-bought CHZ at bottom of green box. It's bit risky, because don't know what will be on Monday when CME opens. But lets just watch price action and hope(despite should not be present in trading))).

CHZ PERFECT BREAKOUT AND RETESTNo many words can i say with this chart
This chart too beautiful
Buy on Blue Box : 0.40 - 0.45
Target 1 - 0.52
Target 2 - 0.60
Target 3 - 0.70
Target 4 - 0.80
Target 5 - 0.90
Stop Loss : 0.35
Keep in mind leverage trading can be highly risky, trade with not more than 5% of your funds in leverage trades.
*Not financial advice.
If you want me to share these trades here, hit the like button and share your views in the comment section.

₿ Chiliz 1D ₿ : 01.DEC.2021 (CHZ)This is a Chart review and The possible trend of #CHZ. Everything is Clear on the Chart , but just in case if you had any question , Please Ask ...
CHZ Price Live Data
The live Chiliz price today is $0.440844 USD with a 24-hour trading volume of $374,607,813 USD. We update our CHZ to USD price in real-time. Chiliz is down 3.39% in the last 24 hours. The current CoinMarketCap ranking is #67, with a live market cap of $2,623,793,800 USD. It has a circulating supply of 5,951,749,373 CHZ coins and a max. supply of 8,888,888,888 CHZ coins.
Follow our other analysis & Feel free to ask any questions you have, we are here to help.
⚠️ This Analysis will be updated ...
👤 Arman Shaban : @ArmanShabanTrading
📅 01.DEC.2021
⚠️(DYOR)
❤️ If you apperciate my work , Please like and comment , It Keeps me motivated to do better ❤️
