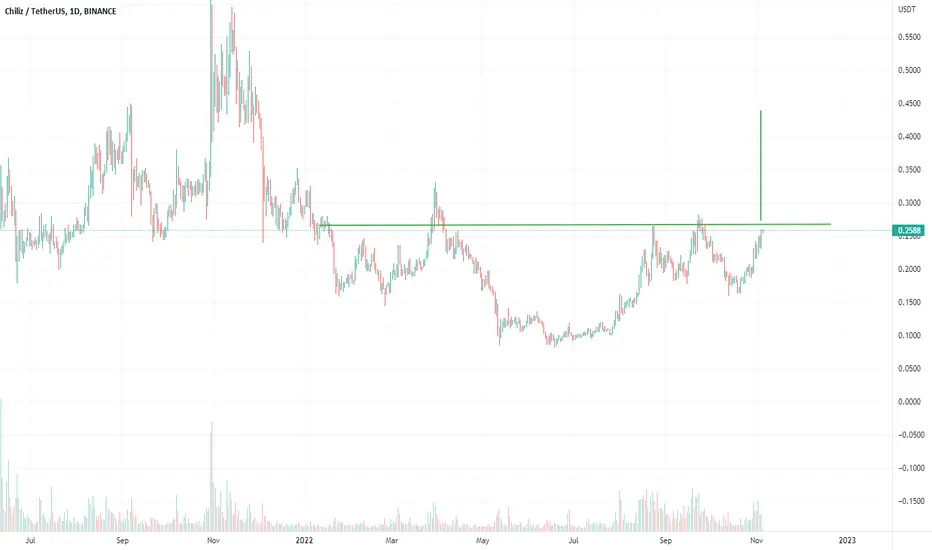
Entry level for CHZ!Here's a quick Look at the CHZ daily chart.
The best entry would be when the price breaks above 0.3$ with a good amount of volume!
-------------------------------------------
The idea is: Buy when the price breaks above 0.3$ and take profits at the levels shown in the chart.
Targets:
1. 0.31$
2. 0.33$
3. 0.35$
-------------------------------------------
What are triangles when it comes to trading?
Key points:
"1. In technical analysis , a triangle is a continuation pattern on a chart that forms a triangle-like shape.
2. Triangles are similar to wedges and pennants and can be either a continuation pattern if validated or a powerful reversal pattern, in the event of failure.
3. three potential triangle variations can develop as price action carves out a holding pattern, namely ascending, descending, and symmetrical triangles."
-------------------------------------------
If you like the content, then make sure to comment and like the post :D
Follow me for daily profitable trading setups
BTC dictates the market. If BTC falls, then Alts will fall as well. Trade safe!
CHZUSD

CHZ/USDT - LONG -- Support me with numbers and follow up on my account for other deals in the future. Thank you for coming to this part.
---------------------------------------------------------
⚡️⚡️ CHZ/USDT ⚡️⚡️
Exchange: ByBit USDT
Trade Type: Breakout (Long)
Leverage: Cross (5.0X)
Entry Orders:
1) 0.24485 - 100.0%
Take-Profit Orders:
1) 0.25850 - 60.317%
2) 0.26915 - 24.855%
3) 0.28580 - 9.826%
Stop-loss Orders:
1) 0.21940 - 100.0%
Trailing Configuration:
Stop: Breakeven -
Trigger: Target (1)

CHZ SHORTThe price corrected after passing the previous peak, but it went lower than the previous bottom. If this rally is a correction of the previous drop, it can be imagined that the price is close to a deeper decline.

Chiliz 1DEverything is clear in the chart, the area of support and sales is ready for the World Cup

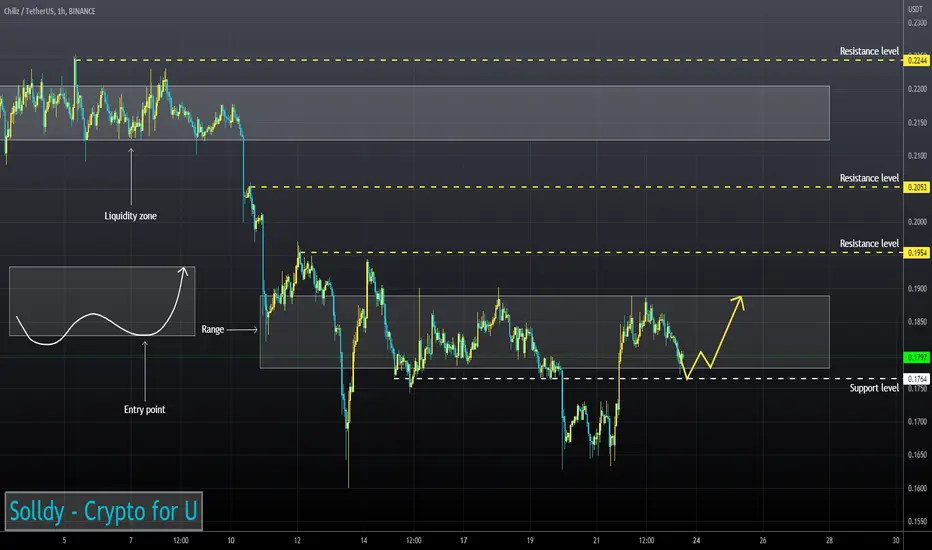
CHZUSD ❕ above the liquidity zoneTrading volumes show interest in price growth.
CHZ successfully tested 50EMA (1H TF)
I expect growth after overcoming the resistance.

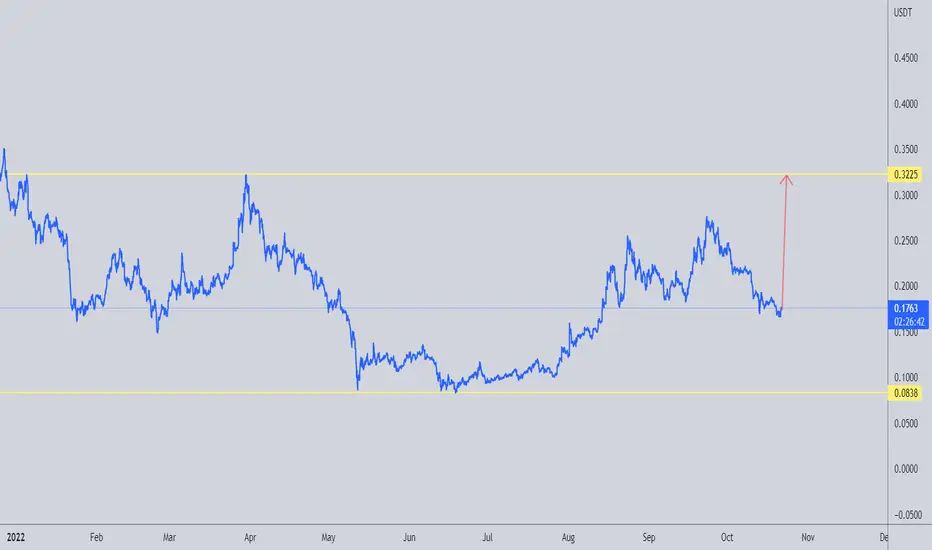
CHZ grew by more than 15% yesterday and 7% today!CHZ grew by more than 15% yesterday and 7% today. After the price entered the corrective wave, we saw a positive reaction to the support levels of the floor of the medium-term bullish channel. After the pullback to the support range, this good rally occurred before the Bitcoin price declined. The resistance range of $0.236 to $0.270 is very important in continuing its mid-term and long-term trend because it is considered an important resistance in the daily time frame. Because if this area is broken, the price can even leave its long-term downward channel. For the short term, until the bottom of the ascending channel is broken and the market conditions remain favorable, we can expect more price growth from this currency.

CHZNot financial advice. The essence of investing & trading is the intelligent and patient preying on the greed, fear, impatience, addiction and ignorance of the majority. It's definitionally Darwinian.

Chiliz (CHZ) is the most dangerous altcoin!Hello, everyone!
This is the bonus analysis for today. I decided to consider the Chiliz because it’s pumping and have a huge interest because of that. I wanna warn you, buying this altcoin could be dangerous, not because of it’s pumping against the market, because of how it is pumping. It has too clear structure that can give me an idea that the target for CHZ is very low.
This is the daily time frame of the CHZUSDT chart. Here we have the confirmed 5 waves structure which have been already ended. I defined it because the price reached it’s target zone and confirmed waves 3, 4 and 5 with the Awesome oscillator divergence and zero line cross under.
Today the price pumped and found resistance exactly at 0.61 Fibonacci retracement. I think the game is over. Wave 2 is finished and next couple of weeks we will see the huge crash in the wave 3. This thought perfectly confirms our setup for the Bitcoin. Crash is imminent, guys. Prepare your bags!
Best regards, Ivan

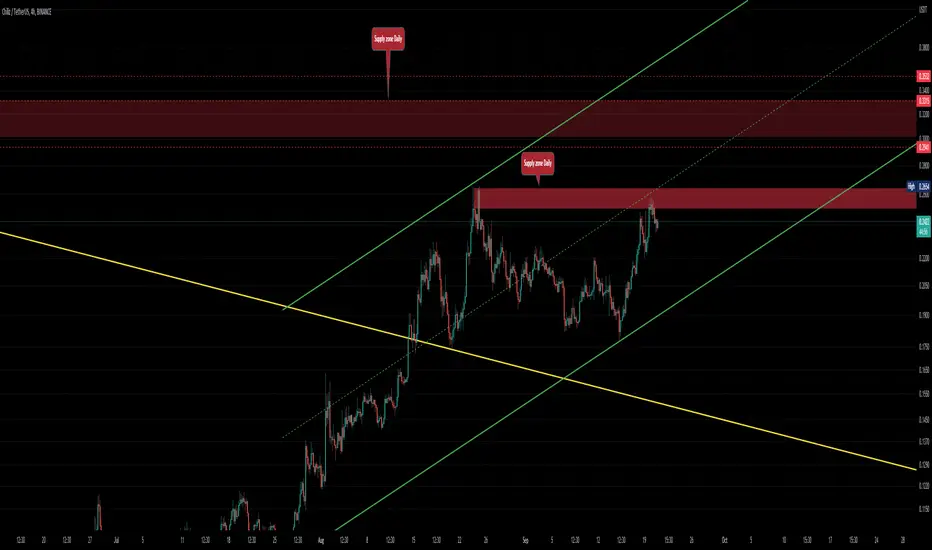
short chz...CHZ neowave behavior shows us that price can sink ant least 50% and we have good supply zoon for that

CHZUSD ❕ pivot pointCHZ and RSI have formed a bullish divergence (4H TF)
The RSI on the 4H TF shows that the buyers are beginning to gain strength.
Price is testing 50EMA as support on the 4H Timeframe.
TD Sequential has formed an up reversal signal (30m TF)
I expect growth if CHZ holds in the current range.
🔥CHZUSDT SHORT TERM UPDATE!!🔥Check out the trade plan for CHZ today based on the technical analysis. Hope this analysis is useful, make sure to hit the thumbs and also follow my tradingview profile for future updates. Thank you!
CHZUSDT Short-term trade plan on 30 mins timeframe inside the channel and support formed.

CHZVery simple ... Very clear
This is my personal opinion. Please do not trade based on my analysis and data.

Descending broadening wedge patternCHZUSD is forming a descending broadening wedge pattern. The RSI shows that CHZUSD is oversold, which would indicate upcoming bullish momentum. The price is also touching the bottom of the Bollinger band, which would also indicate upcoming bullish momentum. Still waiting for the volume to increase even more.

CHZ/USD20% up
we can clear see this support(green box)
take a little SL
and big TP
~~~ 5 ratio will be greatful

CHZ - Cryptocurrency for sports fans.After the false breakout of the upper boundary of the trading range, we observe a structural return of the price inside the channel with a further test of the buyer.
If the buyer fails to hold and push the price out of these price levels, a price decline is expected.
If you liked the idea, please like it. That's the best "Thank you!" for the author 😊
P.S. Always do your own analysis before a trade. Put a stop loss. Fix profits in installments. Withdraw profits in fiat and make yourself and your loved ones happy.

CHZUSD ❕ broke down the liquidity zone50EMA broke down 200 EMA (4H TF)
TD Sequential formed a reversal signal upwards (30m TF)
I expect CHZ to test the mirror resistance level, and after fixing under it will continue to fall.

CHZ forecastFour-hour H&S top:
After the price fell below the neckline, it tested the support price 0.2109 three times and did not fall below it, forming a box with EMA200.
If the price can break through EMA200 and 0.2307, CHZ has a chance to come to 0.2496, which is also the resistance price near 0.2505 (0.618).
-
Daily chart:
If CHZ breaks through 0.2496, there is a chance to challenge the previous high of 0.2826 and a cup handle pattern will appear.
-
The target price after falling below the box:
0.1986
0.1788
-

4H on previous analyze (look levels exactly)its just 4H of my previous analyze , check my previous analysis at below link or related ideas,
CHZusdt 3D Triangle patternBy checking the chart, we can see the triangle pattern, if the price supports the upward trend line, it will be broken, otherwise we expect correction.
Its not Buy or Sell SIGNAL
DYOR
BY : M.TeriZ - @AtonicShark

CHZ ANALYSISCHZ is current broken out of the symmetrical triangle and we can expect a breakdown of 22.78% which takes chz to previous support level at the green box area.Therefore,we might expect new leg after chz test this green box area any long position is risky as we have green box as the next support level for CHZ.

CHZUSD ❕ downtrend lineVolatility has declined, as have trading volumes.
Price is moving in the liquidity zone.
CHZ has broken down 200MA (4H TF)
RSI is in bearish zone (4H, 1H and 30m TFs)
I think the asset may continue to decline if it fixes under the liquidity zone.
