CHZ in daily frame I think we going to visit below 0.07$ area unless we break the trend line and have a correction
Also I think we might get wave 5 might visit 0.24$ again before the dump
peace :)
CHZUSD

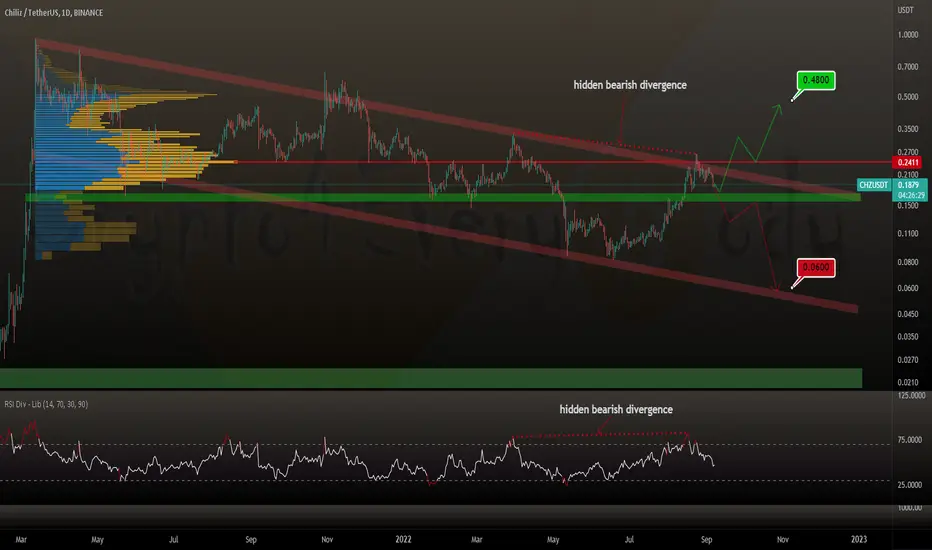
Chiliz CHZ below $0.24 in the huge flag - what next?Chiliz CHZ below $0.24 in the huge flag - what next?
If price gets above this volume profile resistance next target would be $0.48
Maybe more likely a move to the lower flag border at $0.06 - a hidden bearish divergence is concerning
Overall a huge flag with bullish chart outlook on long-term
Comments & FOLLOW appreciated 🤗
*not financial advice
do your own research before investing
Chiliz with a EMA 75 ❌ EMA175 crossChiliz with a EMA 75 ❌ EMA175 cross
Will we see a correction only or the next heavy bull phase 🟢🌶️🟢 dear Crypto Nation ⁉️
Let me know your thoughts on CHZ
Comments & FOLLOW appreciated 🤗
*not financial advice
do your own research before investing

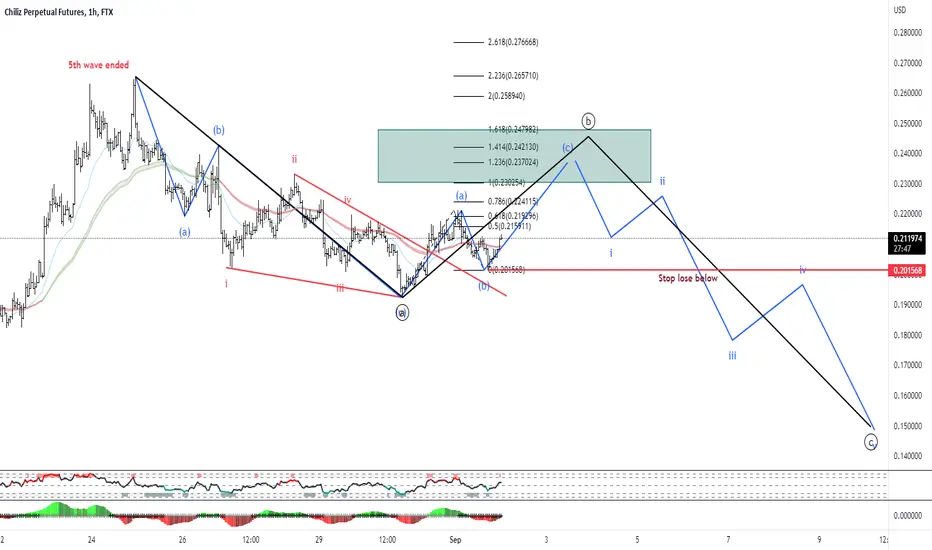
CHZ/USDT Elliott Wave count 1H TFChliliz ended a 5th waves move to upside and now I think it Will go into a correction phase ABC flat pattern. It will be extended we will gonna see.
I entered long on CHZ with targets into the box for an other ABC correction that will be the eave B from flat correction. Good luck!
CHZUSD ❕ broke up the downward channelCHZ broke through the descending channel and formed an rising top.
Price tested the 100MA as support (4H TF).
TD Sequential formed an up reversal signal (1H TF).
I think that CHZ can continue to rise if it fixes above the indicated level.

✅TS ❕ CHZUSD: resistance level✅✅CHZ has moved into a downtrend. Now there is a correction to the resistance level. It is possible to bounce down.✅
🚀 SELL scenario: short to 0.176.🚀
----------------------------------------------------------------------------
Remember, there is no place for luck in trading - only strategy!
Thanks for the likes and comments.

CHZ/USDT :: Short good But Long Better CHZ/USDT :::
Sooner or later all the lines touch .
_ Create a position and enjoy it....

CHZUSD ❕ downtrendCHZ has entrenched in a descending channel.
Now the price is trying to hold under the 100MA (4H TF)
I think the asset may continue to decline if it manages to consolidate under the support.

✅TS ❕ CHZUSD: formed the top✅✅CHZ formed the top, after which the price went down. I expect the fall to continue, perhaps even to the support level.✅
🚀 SELL scenario: short to the support level area.🚀
----------------------------------------------------------------------------
Remember, there is no place for luck in trading - only strategy!
Thanks for the likes and comments.

The diamond on the CHZUSD day chart !CHZ surged more than 200% from 0.081 and it mixed after hit the downtrend from the day chart .
It haven't break down the green uptrend and if CHZ break out the diamond pattern and the strategy as below .
TP1: 0.2646
TP2: 0.3148
TP3: 0.3351
TP4: 0.3568
TP5: 0.3784
TP6: 0.4487
If breakdowm the diamond
the strong support will be 0.1512

CHZ/USDT Elliott Wave countChiliz after ended an impulse to the upside entered into a correction that I think is an WXY.
I entered short here after a rejection into 0.5 fib retracement of abc that forms W wave with targets at those two support levels and stop lose above 5th wave.
I will keep updating this trade so if you like it subscribe for future updates and give a like.
Thank you and good luck.

CHZ targetting .382 fib?!CHZ has been performing exceptionally well! No one can deny that.
But I'm even starting to believe in the wild idea that we may be targeting the .382 fib level as which coincides with the original trend line. I don't want to discount the probability CHZ has to continue with this momentum and surprise yet again by performing exactly in this fashion! but.. hey.
If CHZ follows, this is just my assumption, but that would validate the trend and keep us squeezing within the range until the eventual and inevitable massive rally break out!!
P.S, forgive the repost. the mobile version is wonky at best. i wont be messing around with that again.

TRADE ALERT - CHZ SHORTEntry Target = .2466
Stop Loss = .2613
Final Target = .2026
Risk/Reward = 3/1
Leverage = 1x
Profit Potential = 18%


CHZUSD ❕ correction continuesPrice has formed candles with long upper shadows, which may signal weakness of buyers.
After the long shadows, a Spinning Top was formed, which indicates uncertainty in the market.
On the 4H Timeframe CHZ is in the overbought zone.
I think the asset could go down in search of liquidity if the price holds below support.

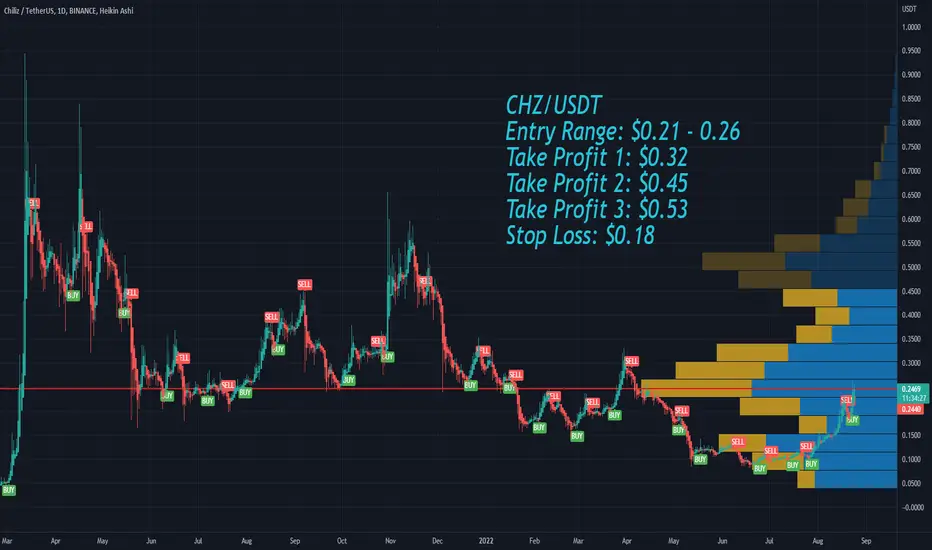
Chiliz CHZ Entry Range, Take Profit and Stop LossCHZ/USDT
Entry Range: $0.21 - 0.26
Take Profit 1: $0.32
Take Profit 2: $0.45
Take Profit 3: $0.53
Stop Loss: $0.18
Chiliz (CHZ) - August 24Hello?
Welcome, traders.
If you "follow", you can always get new information quickly.
Please also click "Like".
Have a good day.
-------------------------------------
(CHZUSDT 1W Chart)
The 0.1858-0.2460 interval is the interval that determines the trend.
Therefore, if it rises above 0.2460, it is expected that it will lead to an upward movement to the next section, 0.4869-0.5471.
However, the key question is whether it can move higher than 0.3665.
(1D chart)
A break above the 0.2695, 0.3034 and 0.3319 points is required to move above 0.3665.
To do that, you need to make sure you can get support in the 0.2402-0.2640 zone or higher.
If not, you should be careful as the pull back pattern could lead to a drop near 0.2079.
The 0.1858-0.2460 section is a trend-determining section, so it is highly likely to lead to further upside if supported in this section.
However, as it is currently higher than 0.2460, if it falls below 0.2079, it is highly likely that it will lead to further declines, so be careful.
------------------------------------------------------------ -------------------------------------------
** All descriptions are for reference only and do not guarantee a profit or loss in investment.
** The MRHAB-T indicator, which is inactive on the chart, contains indicators that indicate support and resistance points.
** Background color of Long/Short-S indicator: RSI oversold and overbought sections
** Background color of CCI-C indicator: When the short-term CCI line is below -100 and above +100, oversold and overbought sections are displayed.
** The OBV indicator was re-created by applying a formula to the DepthHouse Trading indicator, an indicator disclosed by oh92. (Thanks for this.)
(Short-term Stop Loss can be said to be a point where profit and loss can be preserved or additional entry can be made through split trading. It is a short-term investment perspective.)
---------------------------------

CHZ Big rally is loading with World CupAll blockchain ETH, SOL, AVAX, ADA are fighting to be major blockchain.
However CHZ made huge partnership with all football teams.
Now it is time mo build metaverse for each teams for CHZ. All fn tokens getting meaningfull with metaverse.
50 Dollar is coming around November-2022.
Fasten your seat belt and see what is going on ;)

Chiliz back in triangle pattern - next target: BREAK resistanceChiliz back in triangle pattern - next target: BREAK resistance
CHZ avoided the bearish scenario and invalid the textbook breakout of descending triangle
Now we are at a strong resistance from ATH
What do you think dear Crypto Nation?
*not financial advice
do your own research before investing

CHZ/USDT - 20.08.22 Market UpdateHello Traders!
CHZ is moving within the downtrend. The local uptrend started, following the price getting a reaction from the MA100 on the weekly timeframe.
Based on the situation in the market, we can assume another wave of reduction. In this case, medium-term positions will be interesting.
Purchases can be considered in the range of 0.050-0.087$.
The targets will be the price levels of $0.25 and $0.33
Good luck and watch out for the market
P.S. This is an educational analysis that shall not be considered financial advice

✅TS ❕ CHZUSD: bounced down✅✅CHZ bounced down, changing the direction of the main movement. I expect the fall to continue.✅
🚀 SELL scenario: short to 0.1642.🚀
----------------------------------------------------------------------------
Remember, there is no place for luck in trading - only strategy!
Thanks for the likes and comments.

CHZUSD ❕ what will happen after the pump?Volatility has declined near the current top.
Price and RSI have formed a bearish divergence (4H TF)
I expect that the asset may continue downward movement after fixing under the support level.

CHZ/USDT Uptade chartHi, I try to post often so if you could boost and follow it would mean a lot to me.
In the mid term I am preety confident on CHZ but now its time for a quick short. CHZ has a bearish divergence in the 4H chart that shows two support lines. We got an invalidation at 0.20$ and we are ready to restest that support. MACD is about to cross, so in my opinion we will probably go down to 0.18$. After that we will see how the coin will react to that support. Comment what you think.
I am back posting after a long time and streams will resume soon. I had some problems so I couldn't stream yesterday. I am thinking that doing late night streams (UK time) is a good idea since that's the only schedule that works for me. I am trying my best to be active again so you can expect new posts everyday. Thanks!
