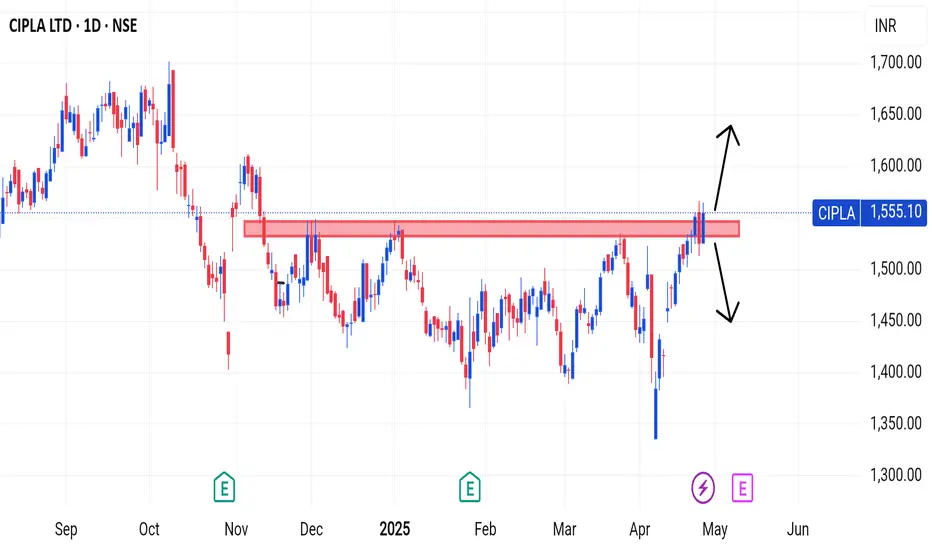
CIPLAA very good breakout has been given above the resistance level. Now uptrends can be expected. Sales are expected to continue if it falls below the resistance level
If you find this helpful and want more FREE forecasts in TradingView, Hit the 'BOOST' button
Drop some feedback in the comments below! (e.g., What did you find most useful?
How can we improve?)
Your support is appreciated!
Now, it's your turn!
Be sure to leave a comment; let us know how you see this opportunity and forecast.
Have a successful week
DISCLAIMER: I am NOT a SEBI registered advisor or a financial adviser. All the views are for educational purpose only
Ciplastudy
Cipla fresh swing buyingWe can see more divergence in volume and more money flux in cipla. Trade with care.

Cipla (Cash) stock Intraday outlook on December 04, 2024The Cipla stock is likely to be bearish on Dec 04, 2024. By not taking the gaps on the either side into account, I foresee a bearish trend during intraday. There is an Intraday Resistance level at 1553 and Intraday Support at 1504. Observe this stock tomorrow. Technical confirmation is a must.
Never trade without Stop-Loss.

CIPLA--Bullish gap@1180??this stock is facing resistance @1280 range...
after turned to be bearish price testing the resistance by creating a bullish channel...
if this channel breaks and retest price fills the bottom bullish gap...

ciplacipla trendline breakout intraday tgt buy between 1095-11 sl 1087 tgt 1110/1115/1122 long tgt for swing traders buy now sl 1085 tgt 1170/1250 within two weeks.
all above information are only for educational purpose only


Cipla - swing tradeThe current Price action structure suggesting that the stock is might be moving towards its recent highs near 980- 1000 levels.
The said Probability will be valid as long as the stock is trading above 958 levels.

CIPLA Looking Good to Buy
All the key levels are mentioned in chart with Stop-loss and Targets
Daily RSI
Disclaimer
I am not sebi registered analyst
My studies are Educational purpose only
Please consult with your Financial advisor before trading or investing

Cipla for solid returns The weekend is a good time to scroll through the charts to find some gems for the coming week and for the coming month.
Cipla is one such stock that came on my radar this week, stock had seen a good move from 738 levels to 966 levels, comprising about 35% return in just 4 -5 weeks.
After seeing a remarkable rally, stock decided to correct, and I as a buyer could take advantage of this correction to grab this stock at attractive levels for participating in the new up leg, that may take stock to 1000 and 1100 levels, and that rally is most likely to come, considering the previous strong price action.
The near-term support is at 855-845 levels, that I am expecting the prices would hold and also bounce from it.
The daily chart also provides good support around 870 and chances are there that stock might reverse from here, hence buying can be done at two trenches.
Trade type: Positional
: Pullback Trade
: Support Buying
If you are trading this, you are trading at your own risk, please do your own research as well.
Share the post, if you find it informative and useful.

Cipla ltdAll key levels are mentioned in chart
which really works as supports as well as resistances
Disclaimer
I am not sebi registered analyst
My studies are Educational purpose only
Please consult with your Financial advisor before trading or investing


CIPLA - Strong trend-line resistance CIPLA is on strong uptrend from past couple of days, however currently at strong trend-line resistance.
Incase if gap-up opening above resistance ans sustains, go for clear long.
Incase if pharma sector is -ve in next trading session, we can consider for shorting opportunity.
Add to watch list

will cipla going to make new high ?as far trend is +ve / volume is good corrective move was expected after ,its now ready to again track

CIPLA LOOKS BEARISH TO MEPharma Giant Cipla is forming a classical Lower Top Lower Bottom Formation
Looks weak to me
Do ur own analysis before taking trades :)

CIPLA Price Near Resistanceprice touching 480 - 485 region and if you take a look at RSI it is very bullish and no bearish divergence till now so after confirmation of breakout we can enter in this trade
