Trading the range on WTI (CL1!)Oil prices are trading quite erratically on the daily chart, making it a much less appealing market to trade on that timeframe. But that doesn't mean we cannot find potential inflection points at the intraday level.
Monday's opening gap has been filled, and earlier losses on Tuesday were fully recouped to print a bullish pinbar on the daily chart which found support just above $70. We're not looking for a huge move, but we see the potential for prices to have another crack at the $73, and the 3-wave retracement towards $71 looks appealing for a swing trade long. Take note of the HVN (high volume node) around $72.64 which could act as a magnet should momentum eventually turn higher.
We're not sure the actual swing low is in yet, so we're looking for higher volumes accompanied by one or more bullish reversal candles on the hourly timeframe or lower, to hint at a swing low. And if it can form above or around the $71 support zone it could provide an adequate reward to risk ratio for a cheeky long.
Crude Oil Futures WTI (CL1!)

WTI Light Sweet Crude Oil, 6/8/23For Thursday, 72.58 can contain buying early next week, below which 68.16 remains a 3 - 5 day target able to contain selling through the balance of next week.
A daily settlement below 68.16 indicates 62.14 over the following 2 - 3 weeks, where the market can bottom out through summer activity.
Upside Thursday, closing above 72.58 indicates 77.39 within 3 - 5 days, able to contain weekly buying pressures when tested and the point to settle above for then indicating 82.18 long-term resistance within 2 - 3 more weeks.

Day Trade Market Condition jun 07, 2023Day Trade Market Condition jun 07, 2023
levels for NQ ES CL BTC
watch the table left side for trade, right side for trend

WTI Light Sweet Crude Oil, 6/7/23For Wednesday, 72.80 can contain buying early next week, below which 67.99 remains 3 - 5 day target able to contain selling over the same time horizon.
A daily settlement below 67.99 indicates 62.14 over the following 2 - 3 weeks, where the market can bottom out through summer activity.
Upside Wednesday, closing above 72.80 indicates 77.21 within 3 - 5 days, able to contain weekly buying pressures when tested and the point to settle above for then indicating 82.18 long-term resistance within 2 - 3 more weeks time.

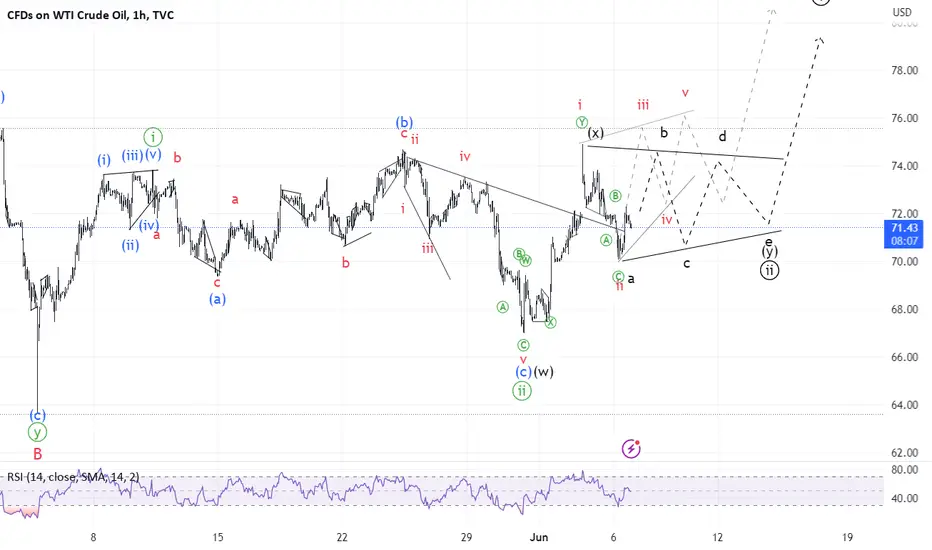
USOIL UpdateIn addition to the base case scenario labelled in colour letters and pale lines, I am introducing a new scenario in which wave [ ii] is not yet completed and is undergoing a more complex yet statistically probable combination of flat (w), double zigzag (x), and triangle (y).
Day Trade Market Condition jun 06, 2023Day Trade Market Condition jun 06, 2023
levels for NQ ES CL BTC
watch the table left side for trade, right side for trend

USOIL Oil Update Yesterday was an early call. The market moves in the form of a simpler yet more effective simple zigzag, which can easily develop into a more intricate wxy later on.
Nonetheless, the market has retraced significantly, and I anticipate that the uptrend will continue soon.

S&P 500, 6/6/23For Tuesday, 4309.25 can contain session strength, 4268.00 in reach and able to contain session weakness.
Closing today below 4268.00 signals 4198.75 - 4212.00 within several days, long-term support able to contain selling through the balance of the year, and above which 4563.25 remains 3 - 5 month objective.
Upside Tuesday, pushing/opening above 4309.25 should yield at least 4327.50, possibly 4355.50 intraday, while closing today above 4309.25 indicates the targeted 4404.25 within 3 - 5 days, able to contain buying through next week and the level to settle above for accelerating the 4563.25 objective to within 3 - 5 weeks.

WTI Light Sweet Crude Oil, 6/6/23For Tuesday, 71.69 can contain session weakness, above which 73.01 in reach today and able to contain session strength.
A daily settlement outside of this zone would indicate directional continuation in the respective direction.
In other words, closing today above 73.01 indicates 77.04 within 3 - 5 days, able to contain weekly buying pressures when tested and the point to settle above for then indicating 82.18 long-term resistance within 2 - 3 more weeks.
Downside Tuesday, closing today below 71.69 indicates 67.16 – 67.73 within several days, a range of support able to contain selling into later next week, and the area to settle below for then indicating 62.14 long-term support over the following 2 - 3 weeks.

USOIL UpdateRight... Clearly, the market is not impressed by His Royal Highness' ability to reign over the oil price. Having said that, I still see an immediate uptrend.
So, either the market will reconsider or something new will occur.
The outlook remains unchanged; I simply had to shift local tops and bottoms.

Day Trade Market Condition jun 05, 2023Day Trade Market Condition jun 05, 2023
levels for NQ ES CL BTC
watch the table left side for trade, right side for trend
notice ES has not broken the major supply mentioned on Friday and attempts until it happens . keep in mind, trend is BULLISH

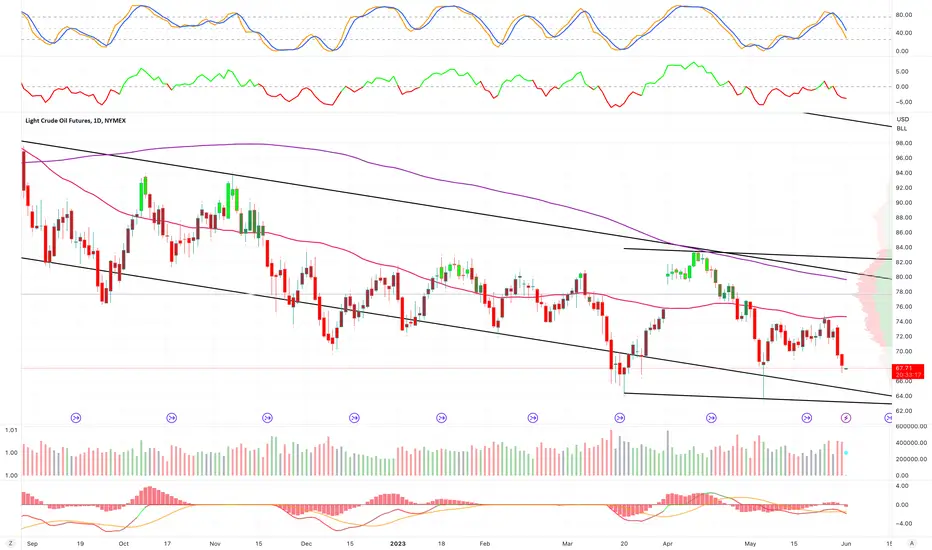
WTI Light Sweet Crude Oil, 6/5/23A two-sided framework continues through summer between 62.14 long-term support, and 82.57 long-term resistance, both regions able to contain seasonal activity.
Downside, a weekly settlement below 62.14 indicates 53.87 within several months, longer term Fibonacci support able to contain selling into later year.
Upside, a weekly settlement above 82.57 indicates 94.67 within several months, able to contain buying on an annual basis.
-
For Monday, 70.68 can contain session weakness, above which 73.23 remains a 2 - 3 day target able to contain buying into later week, once tested the market susceptible to falling back to 67.16 by the end of next week.
Closing above 73.23 indicates 76.85 within 3 - 5 more days, where the market can top out on a weekly basis and the point to settle above for then indicating 82.18 long-term resistance within 2 - 3 more weeks.
Downside Monday, breaking/opening below 70.68 signal 69.69 intraday, while closing today below 70.68 indicates 67.16 within several days, able to contain selling through the balance of the week and the point to settle below for then indicating 62.14 long-term support within 2 - 3 more weeks.

WTI UpdateOkay, the Saudis did cut. I must confess that I underestimated His Royal Highness's ability to surprise. That leaves us with a possible gap on Monday. Given the market pressures and the fact that the previous cut was ineffective in sustaining the price, the gap is unlikely to be as large as in April.
The gap is, most likely, wave 3 of (c) of the first wave up in the leading diagonal. There is still a chance that wave (ii) will close the gap, as shown on the chart.
MBS, you did an excellent job. I am not as long as I could have been.

USOIL Additional Chart I feel compelled to share another possible scenario. If OPEC+ fails to agree on a meaningful cut, we may see increased volatility, which could shape an expanding leading diagonal (red dotted line and pale wave count).
The bigger picture is in the previous post .

FEDFUNDS | Too TightThe point of TradingView (and being a human/trader in general) is to learn from your mistakes. I did make some mistakes. Perhaps this idea by itself is another mistake. But I cannot do any different. I must speak out about what I see.
For the past year I tried to understand the pressures that are pushing prices higher, equities lower.
It is important in analysis to avoid the mass, the "common truth".
We all have expected a future of uncontrollable inflation, extreme prices and The Great Reset. The place where everything is too expensive to buy, and we will have to live with coupons.
While some of these may come, it is important to analyze what isn't coming.
Oil prices have been paired with the dollar (with the petrodollar).
Many expect oil prices to explode even further, while "dollar is losing value" and "hyperinflation is imminent".
Some charts however show a different picture...
WIth the 2M chart warning of downward swing, and with the 3M chart showing divergence, the future of oil may not be as explosive as we may believe.
But that is in relative terms. The strength of money seems fated to increase a lot more. Which in relative terms will constitute oil cost to be viable.
In the main chart, it appears that oil is moving into what appears to be a Wyckoff Distribution.
And oil is not the only one who will have trouble with the high-yield environment.
Until now, the usual equity-bond investment scheme has performed tremendously.
This trend is now changing. With a significant trend violation that occurred last year, it seems that we are entering a new period of investment strategies.
From bonds as a hedge against equity weakness, investors should seek alternatives.
The old way of doing things is broken. Commodities will be playing a significant role in the future of investments.
It is in our power to find the new way of doing things.
Tread lightly, for this is hallowed ground.
-Father Grigori
P.S. A link to the indicator I am using.

Day Trade Market Condition jun 02, 2023Day Trade Market Condition jun 02, 2023
levels for NQ ES CL BTC
watch the table left side for trade, right side for trend
notice ES NQ maybe at extreme at this level, traders caution if market open higher than drop

WTI Light Sweet Crude Oil, 6/2/23For Friday, 70.59 can contain buying through next week, below which 67.16 remains a 3 - 5 day target, 62.14 expected within 3 - 5 weeks.
Downside Friday, 69.53 can contain intraday weakness, below which 67.16 is attainable intraday and able to contain session weakness.
A daily settlement below 67.16 allows 62.14 by the end of next week, where the market can bottom out on a monthly (possibly seasonal) basis.
Upside Friday, closing above 70.59 indicates 73.44 within 2 - 3 days, able to contain buying through next week and the point to settle above for indicating 82.93 long-term resistance within 3 - 5 more weeks.

Day Trade Market Condition jun 01, 2023Day Trade Market Condition jun 01, 2023
levels for NQ ES CL BTC
watch the table left side for trade, right side for trend

S&P 500, 6/1/23For Thursday, the 4203.75 - 4220.00 area can contain buying through the balance of the week, below which selling pressures can build over that time horizon.
Overall, a clear weekly settlement tomorrow below 4220.00 maintains a mere testing of long-term resistance, the market susceptible to significant bearish continuation as we move through the third quarter.
Inversely, a weekly settlement tomorrow above 4220.00 (last week failed to settle above this significant long-term channel top) would indicate longer-term bullish continuation.
Downside Thursday, 4163.50 can contain intraday weakness, while breaking/opening below 4163.50 signals 4127.25, able to contain session weakness.
Closing today below 4127.25 signals 4091.75 tomorrow, able to contain selling through next week.

WTI Light Sweet Crude Oil, 6/1/23For Thursday, 70.49 can contain buying through next week, below which 67.16 remains a 3 - 5 day target, 62.14 expected within 3 - 5 weeks.
Downside Thursday, 67.16 can contain session weakness, while closing below 67.16 allows 62.14 by the end of next week, where the market can bottom out on a monthly (possibly seasonal) basis.
Upside Thursday, closing above 70.49 indicates 73.66 within 3 - 5 days, able to contain buying through next week and the point to settle above for indicating 82.93 long-term resistance within 3 - 5 more weeks.
Day Trade Market Condition may 31, 2023Day Trade Market Condition may 31, 2023
levels for NQ ES CL BTC
watch the table left side for trade, right side for trend
overnight trading net short for nq/es, higher chance to pull back to find additional buyers

CRUDE OIL (WTI) Under Bearish Pressure!🛢
WTI Crude Oil was consolidating for quite a long period of time within a horizontal trading range.
Its support was broken today.
It may push the price much lower.
Taking into consideration that the market is trading in a long - term bearish trend,
I will expect a bearish continuation to 64.0 level.
❤️Please, support my work with like, thank you!❤️

Oil Order Flow - OFA Script Triggers Bearish OutlookHey traders,
One wonders. Is there a case to be made to be short Oil? The OFA is telling us, you bet there is, judging by the realized order flow as depicted by the script.
I won’t defend this point with any subjective opinion.
Instead, I will let you see the Oil chart in this 4h timeframe, with the OFA script attached to it, to show you what’s the current state of affairs.
What do you notice in this chart? 'DIAMONDS' tend to see a failure in amplifying the move in equal or greater magnitude than the preceding cycle.
When that occurs, we want to stay on the lookout as this is by no means a sign that validates aping in, but rather it is an early sign that the tide might be turning.
We then start getting more validation should the structure start shifting by breaking the previously identified low in the OFA script, in this case at $71.00.
If that break materializes with price acceptance beyond, then we know we might be onto something. Well, all the stars are now aligning for further falls in Oil.
Remember the two key main features of the OFA script :
Magnitude: A major clue that will help determine the health of a trend is the type of progress by the dominant side in control of the trend. We need to ask the following question: Are the new legs in the active buy-sell side campaign as identified by the script increasing or decreasing in magnitude?
Velocity: When it comes to the distance the price moves, the magnitude is only ½ the equation. The other ½ has to do with the velocity of the move or the speed. Was the new leg created after a fast and impulsive move? Or did price make a new low or high with the movement being sluggish, compressive and taking too long to form? A good rule of thumb is to count the number of candles it took to achieve a new leg.
DISCLAIMER: This post contains commentary published solely for educational and informational purposes. This post's content (and any content available through links in this post) and its views do not constitute financial advice or an investment or trading recommendation, and they do not account for readers' personal financial circumstances, or their investing or trading objectives, time frame, and risk tolerance. Readers should perform their own due diligence, and consult a qualified financial adviser or other investment / financial professional before entering any trade, investment or other transaction.
