WTI Light Sweet Crude Oil, 5/15/23The 62.14 level can contain selling through June, above which the 83.05 - 84.41 region is likely over that time horizon.
On the way up 73.99 can contain weekly buying pressures, with a daily settlement above 73.99 indicating 83.15 within several weeks (days?), the start of a narrowing range of meaningful resistance up to 84.41 able to contain buying into later summer, and the region to settle above for indicating 94.67 long-term resistance within 2 - 3 months.
Downside, a settlement below 62.14 indicates 53.87 within several weeks, longer term Fibonacci support able to contain selling through summer activity.
-
For Monday, both 73.71 and 69.84 can firmly contain intraday activity, beyond which the next notable level is expected intraday.
Upside, pushing/opening above 73.71 signals 73.99, able to contain weekly buying pressures, and once tested, 68.77 attainable within a full week of activity, possibly allowing 62.14 within 3 - 5 weeks.
On the other hand, a daily settlement above 73.99 indicates 83.01 within 2 - 3 weeks, the start of a range of meaningful long-term resistance up to 84.41 able to contain buying into later summer.
Downside Monday, breaking/opening below 69.84 signals 68.77, able to contain selling into later week, and the level to settle below for then indicating 62.14 within 2 - 3 weeks.
Crude Oil Futures WTI (CL1!)

Day Trade Market Condition may 12, 2023this is may 12, 2023 levels for NQ ES CL BTC
watch the table left side for trade, right side for trend
NQ is Bullish reaching 13500 mentioned on publish idea of May 01 2023 ; hoping a good Rally day ES break the 4190

Crude Oil Futures: Open Interest and Technical AnalysisPreliminary data from CME Group indicates that open interest in crude oil futures markets increased for the fourth consecutive session on Monday, registering a gain of approximately 4.3K contracts. Conversely, trading volume decreased for the third consecutive session, declining by roughly 260.5K contracts.
Technical analysis indicates that the crude oil price has retraced to the 50% Fibonacci level in combination with the previous resistance area, suggesting the possibility of another bearish leg (AB=CD pattern) with a target of approximately HKEX:62 or lower.
Alternatively, the next significant resistance level for the crude oil price could be around $80.00.
Given the rising open interest, the daily uptick in price is likely to continue the recovery in the near term. The key target to watch for is the $80.00 per barrel mark.

WTI Light Sweet Crude Oil, 5/12/23For Friday, both 73.71 and 69.97 can firmly contain intraday activity, beyond which the next notable level is expected intraday.
Upside, pushing/opening above 73.71 signals 74.40, able to contain buying through next week, and once tested, 68.77 attainable within a full week of activity, possibly allowing 62.14 within 3 - 5 weeks.
On the other hand, a settlement today above 74.40 indicates 83.04 within 2 - 3 weeks, the start of a range of meaningful long-term resistance up to 85.16 able to contain buying into later summer.
Downside Friday, breaking/opening below 69.97 signals 68.77, able to contain selling into later next week and the level to settle below for allowing 62.14 by the end of May.

Day Trade Market Condition may 11, 2023this is may 11, 2023 levels for NQ ES CL BTC
watch the table left side for trade, right side for trend
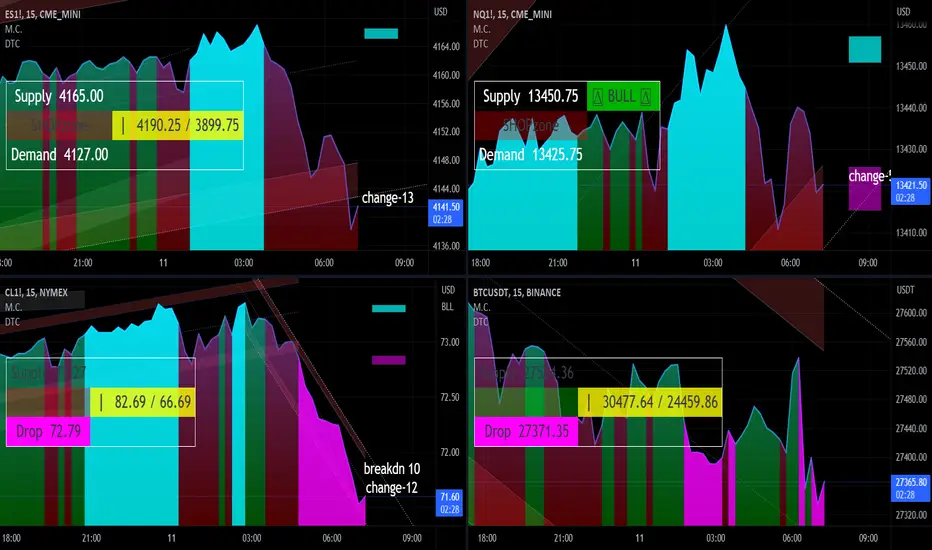
WTI Light Sweet Crude Oil, 5/11/23For Thursday, both 73.71 and 69.97 can firmly contain intraday activity, beyond which the next notable level is expected intraday.
Upside, pushing/opening above 73.71 signals 74.82, able to contain weekly buying pressures and, once tested, 68.77 attainable within a full week of activity, possibly allowing 62.14 within 3 - 5 weeks.
On the other hand, a settlement today above 74.82 indicates 83.06 within 2 - 3 weeks, the start of a range of meaningful long-term resistance up to 85.16 able to contain buying into later summer.
Downside Thursday, breaking/opening below 69.97 signals 68.77, able to contain selling through the balance of the week and the level to settle below for allowing 62.14 by the end of May.

Day Trade Market Condition may 10, 2023this is may 10, 2023 levels for NQ ES CL BTC
watch the table left side for trade, right side for trend
notice the highlighted post on May 01, 2023
www.tradingview.com

WTI breaks out ahead of US inflation dataWe suspect volatility may be on the quiet side with a US inflation report looming, but this provides the opportunity for markets to consolidate and traders plan trades.
Should we see the pace of inflation to continue slowing, it could strengthen oil prices for two basic reasons.
1 - A weaker US dollar, as traders bring forward rate cut bets / solidifies bets of 5.25% peak rate
2 - Reduces the odds of a recession and increases oil demand expectations
The softer inflation is, the stronger the bullish reaction for oil could be expected.
- WTI futures closed above trend resistance following a bull-flag breakout, which was accompanied by positive-delta volume during the rally to recent highs.
- Prices are now consolidating, but we'd welcome a pullback towards $73 to buy dips in anticipation of a breakout above $74.
- Initial target is $76 (near the upper daily ADR band)
- A move to (and beyond) $77 could be on the cards if we're treated to a weaker-than-expected inflation report
- The bias remains bullish above $72.50

WTI Light Sweet Crude Oil, 5/10/23For Wednesday, 69.85 can contain session weakness, above which the targeted 75.23 is attainable intraday and able to contain weekly buying pressures.
A daily settlement above 75.23 indicates 83.08 within several weeks, the start of a range of longer-term resistance up to 85.16 able to contain buying into later summer.
Downside Wednesday, a settlement below 69.85 indicate 66.94 within several days where the market can bottom out through the balance of the week, and above which 75.23 remains a 3 - 5 day objective.
A daily settlement below 66.94 indicates a good weekly high, 62.14 then considered a 3 - 5 day target where the market can bottom out through June, and over that time horizon remains poised for recovery into the 83.15 - 85.16 region.

Day Trade Market Condition may 09, 2023this is may 09, 2023 levels for NQ ES CL BTC
watch the table left side for trade, right side for trend

WTI Light Sweet Crude Oil, 5/9/23For Tuesday, 69.85 can contain session weakness, above which the targeted 75.65 is attainable intraday and able to contain weekly buying pressures.
A daily settlement above 75.65 indicates 83.10 within several weeks, the start of a range of longer-term resistance up to 85.16 able to contain buying into later summer.
Downside Tuesday, breaking/opening 69.85 allows 67.77 intraday, where the market can bottom out into later week and above which 75.65 remains a 3 - 5 day objective.
A settlement today below 67.77 indicates a good weekly high, 62.14 then considered a 3 - 5 day target where the market can bottom out through June, and over that time horizon remains poised for recovery into the 83.15 - 85.16 region.

Day Trade Market Condition may 08, 2023this is may 08, 2023 levels for NQ ES CL BTC
watch the table left side for trade, right side for trend

CRUDE OIL (WTI) Key Levels to Watch This Week 🛢
Here is my fresh structure analysis for WTI Crude Oil for this week.
Resistance 1: 73.88 - 74.3 area
Resistance 2: 76.56 - 77.10 area
Resistance 3: 78.60 - 79.85 area
Resistance 4: 83.2 - 83.5 area
Support 1: 67.90 - 68.05 area
Support 2: 64.4 - 66.9 area
Consider these structures for pullback/breakout trading.
❤️Please, support my work with like, thank you!❤️

Crude Oil Ka-BoingNice long tail on the weekly chart, after a lower low. Technical indicators MACD and VolDiv appear bearish but this is suspiciously like a hidden dragon.
Taken altogether, the first resistance is 76, and once close above 80 is firmed bullish. The lower low suggests more downside, but the length of that tail is telling a very bullish story for the next couple of weeks.
So... expecting a consolidation range fighting between bears and bulls between 70-80; while leaning towards a bullish breakout much later... perhaps (ideally) after higher low.
Do note that in alignment to the earlier post about the USD dropping, it does look like Crude now has a better chance of turning around to reinstate its bullish efforts.

Day Trade Market Condition may 05, 2023this is may 05, 2023 levels for NQ ES CL BTC
watch the table left side for trade, right side for trend

WTI Light Sweet Crude Oil, 5/5/23For Friday, 71.76 can contain buying into June, below which 62.14 remains a 1 - 2 week target.
Downside Friday, 67.12 can contain intraday weakness, while breaking/opening below 67.12 allows 62.14 intraday, where the broader market can bottom out into June activity, and the point to settle below for signaling the next long-term support level at 53.87 within 3 - 5 more weeks.
Upside Friday, a settlement today above 71.76 indicates a good May low, 81.48 long-term resistance then attainable within 3 - 5 weeks where the market can top out into later summer and a significant upside continuation point over the same time horizon.

Day Trade Market Condition may 04, 2023this is may 04, 2023 levels for NQ ES CL BTC
watch the table left side for trade, right side for trend

CRUDE to bounce a bit, if at all, else dive hardBased on Crude's weekly chart, it clearly lost the bullish plot (posted 1st May, see linked post). As of the current Crude futures price action, a few preliminary observations can be recorded...
1. A lower low is recorded, and this aligns with the weekly technical outlook of a more bearish close to the weeks ahead;
2. Yesterday closing at 68.52 broke down all prior marked supports, except for the TDST at 66.12.
Note that a close below and 3 days of closing below 66.12 changes Crude into a bearish primary trend. So, expect a lot of dancing about (or bounces off) this area, until that happens.
3. Today closing is important... IF closing at current levels, then a bounce to 74-76 can be expected, due to the long shadow/tail (green ellipse). Otherwise, a breakdown below the TDST support level turns all bearish.
4. Technically, it appears to favour further downside once market hours open. MACD and VolDiv on the daily are aligned to weekly indication of more downside momentum, having already crossed into bear territory.
Watch the USD... it has a lot to do with the magnitude, although other fundamentals will affect Crude directly. Mindful that tomorrow is the Non-farm Payrolls.

Crude lost the bullish plotIt appears that Crude lost the bullishness.
Initially in March, Crude broke up into the range, and expected bullishness to breakout on the other side, which gave much upside. This was followed by a marubozu and then a gap up. Thing is, it met resistance and failed. Breaking back down and now almost closing the gap.
Once the gap is closed, looking for 66-70 for a period to consolidate. MACD is weakening, VolDiv crossing down very soon.

SHORT | CL1! | Crude OilNYMEX:CL1!
Crude Oil looks bearish
TP1: 75$ Fill the gap
TP2: 60$ Recession Fear and Macro Economy Variables.

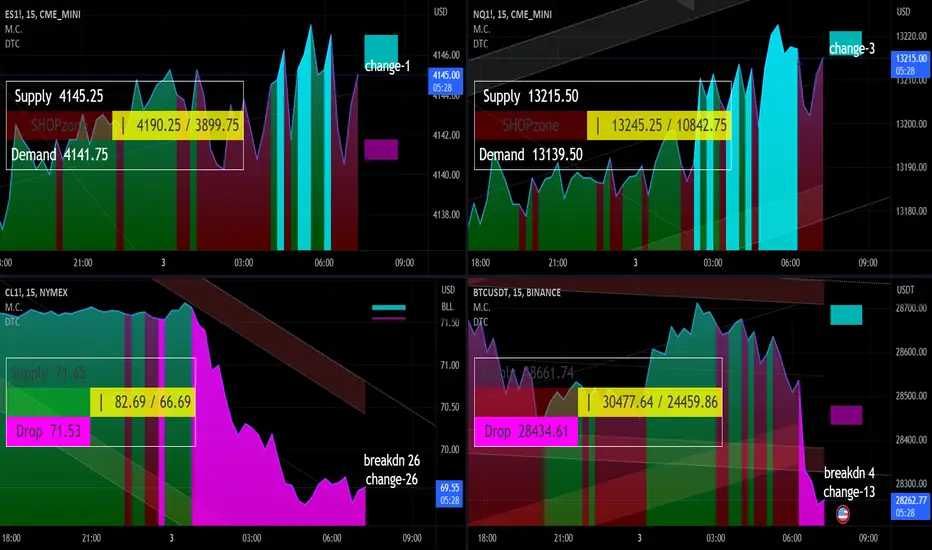
Day Trade Market Condition may 03, 2023 FOMCthis is may 03, 2023 levels for NQ ES CL BTC
watch the table left side for trade, right side for trend
FOMC today
WTI Light Sweet Crude Oil, 5/3/23For Wednesday, 71.76 can contain selling through May, above which 81.48 long-term resistance is attainable by the end of June or sooner. Upside Wednesday, 73.98 can contain intraday strength, beyond which 75.45 is likely intraday and able to contain session strength. Closing today above 75.45 indicates a good weekly low, 81.48 long-term resistance then attainable by the end of next week, where the market can top out into June and a significant upside continuation point into later summer. Downside Wednesday, breaking/opening below 71.76 signals 71.03, able to contain intraday selling yet below which 67.12 is attainable by the closing bell. Overall, a daily settlement below 71.76 would signal 62.14 over the next 3 - 5 weeks.

Day Trade Market Condition may 02, 2023this is may 02, 2023 levels for NQ ES CL BTC
watch the table left side for trade, right side for trend
NQ ES mix markets

WTI OIL Target hit. Now sell the rebound.WTI Oil (USOIL) hit our 72.50 target we set last week (see chart below) and maintains the tight trade within this short-term Channel Down pattern:
At the moment today's aggressive bearish leg can very well make a Lower Low of the Channel Down at 71.10 and then rebound, with the 4H RSI Rectangle giving a valid level on its bottom to be prepared for. Until the price closes above the 4H MA50 (blue trend-line), we will look to sell again near the top of the Channel Down and target the bottom at 68.10, near the 1W MA200 (yellow trend-line).
-------------------------------------------------------------------------------
** Please LIKE 👍, FOLLOW ✅, SHARE 🙌 and COMMENT ✍ if you enjoy this idea! Also share your ideas and charts in the comments section below! **
-------------------------------------------------------------------------------
💸💸💸💸💸💸
👇 👇 👇 👇 👇 👇
