CL so far in 2023 YP-Ys1CL oil so far in 2023, the Yearly pivot point(P) to the Yearly S1 pivot point. Computer algos are in charge!
Crude Oil Futures WTI (CL1!)

Crude Oil (WTI) Key Levels to Watch Next Week 🛢️
Here is my latest structure analysis for WTI Oil.
Resistance 1: 69.9 - 73.3 area
Support 1: 61.7 - 66.0 area
Support 2: 57.3 - 58.5 area
Consider these structures for pullback / breakout trading.
❤️Please, support my work with like, thank you!❤️

Crude oil 7.03.2023Now the situation that fundamentally pressures the price of oil , it is the sale prices of oil from Russia, and this is a trigger for the market, for a further decline.
Now we are moving in a range of 83-69, breaking through the upper level will mean for me, reaching the liquidity zone, collecting stop losses and continuing the move down
Best regards EXCAVO

Day Trade Market Condition mar 17, 2023this is mar 17, 2023 levels for NQ ES CL BTC
watch the table left side for trade, right side for trend
the NQ/ES are not in syn.(nq near high vs es near the low in the high time frame)! at this time ES seems pulling back the NQ advancing, carefully trade.

WTI OIL Excellent long-term buy opportunity.WTI Oil (USOIL) got its 1D RSI oversold below 30.00 as the market made a new Low since December 09. The last two times the 1D RSI was that low was on the medium-term (Lower) Lows of December 09 and September 26. This is a strong buy signal as every time the Low was priced, it did so on a consecutive 1D Double Bottom candle, which just did today.
The Pivot Zone is the first level of Resistance, but since the Dec and Sep rebounds both hit the 1D MA50 on the way up, we will target that again, setting a medium-term target at 74.50.
-------------------------------------------------------------------------------
** Please LIKE 👍, FOLLOW ✅, SHARE 🙌 and COMMENT ✍ if you enjoy this idea! Also share your ideas and charts in the comments section below! **
-------------------------------------------------------------------------------
💸💸💸💸💸💸
👇 👇 👇 👇 👇 👇

WTI Futures: Will Weak Demand Continue As Inflation Ease?Hello Fellow Oil Futures Trader, Here's a Technical outlook on WTI Futures!
Support the channel by giving us thumbs up and sharing your opinions in the comment section below!
Chart Perspective
WTI Futures is breaking out of the neckline of a triangle pattern. Breaking out of this pattern indicates a potential trend continuation from previous bearish bias. The MACD Indicator already made the death cross. The death cross signals a possibility of downside movement to the target area ahead.
Macroeconomic:
1. Rate Hikes across the globe slowed down the economy, weaken commodity demand
2. China manufacturing slowdown
All other explanations are presented on the chart.
The roadmap will be invalid after reaching the target/ resistance area .
"Disclaimer: The outlook is only for educational purposes, not a recommendation to put a long or short position on the WTI Futures"

CRUDE OIL (WTI) Bearish Setup Explained🛢
On a today's live stream, we discussed WTI Oil.
The price formed a tiny double top pattern on 1H time frame,
approaching a wide supply cluster.
Its neckline was broken.
I expect a bearish continuation to 70.9 now.
❤️Please, support my work with like, thank you!❤️

OIL3.14.23 I think oil is at a support level and should go higher. The emphasis on this video Pertains to gaps and failures to retest gaps because if facilitates Scalping, Not just to enter the market but to exit.
This video follows the American Airlines video, And I will try to post a video on the ES which found buyers last night and would have been a good long trade for a scalp.I have to see what it's done since earlier this morning and will post whatever happens A little bit later today.

CRUDE to bounce too!Been a while since crude futures were reviewed, and since the last post, crude categorically dropped... but it maintained a decent range between 70-80/82. The thing about crude now is that it appears to be coiling and is starting to show signs of a break out.
Here is how I see it... the candlestick pattern (especially in the Daily chart, not shown here) is bullish, at least leaning towards bullishness. The MACD is aligning up, and the VolDiv is tapering but not crossed over yet. The MACD is forming that not so subtle anymore bullish divergence. Also noted that the TD Sequential is still in bullish primary trend mode (not shown here).
Now, to qualify a good break out, we need to set some parameters. 82 is the break out resistance level (green line) and this is about half of the range since August 2022. Coincidentally (or not), the 23EMA is at 81, and the weekly price needs to close above 81. And a really good break out (out of the yello box range) above 94 would be seriously bullish, although that might mean the Ukr-Russ conflict might have escalated.
Sidenote that the USD in a choke-hold and depreciating would help Crude rally up more.
Alternatively, a 23EMA failure, MACD cross under can happen as the VolDiv accelerates further into bearish territory. a close below 72 would favour the bear case.
Given the longer term view, it appears Crude is ready for a (surprise) bounce, and is likely to revisit the last low in December 2022, probably May-July 2023. While this is not obvious in the weekly chart, the Monthly chart TD Sequential indicates, so heads up.

WTI CRUDE OIL: Buy inside the Triangle.WTI Crude Oil turned neutral on the 1D time-frame (RSI = 46.669, MACD = -0.040, ADX = 33.066) as it hit the bottom of the 3 month Triangle. This is a confirmed signal to go long (TP = 79.50) targeting the top of the Triangle.
## If you like our free content follow our profile to get more daily ideas. ##
## Comments and likes are greatly appreciated. ##

wti would go to stable price mid Aprilinterest rate hiking will continue in March with FED's decision.
I pesonally belive that FED will raise only 25bp but it will be effective indeed.
Inflation will go down until April so as WTI oil.
My price target to short oil is 60 dollar.
I can see some perfect Head and shoulder pattern also from the chart.

Crude Oil (WTI): Bearish Outlook Explained 🛢️
WTI Crude Oil reached a key daily structure resistance.
The price formed a tiny little double top on that on 1H time frame.
Its neckline has been just broken.
The market will most likely keep retracing.
Goals: 79.9 / 79.6
❤️Please, support my work with like, thank you!❤️

CRUDE OIL (WTI): Bulls Are Dominating
Fundamentals strongly support WTI.
The market keeps growing for the last couple of day.
We believe that it will go much higher.
Be prepared for a bullish rally to 82.0
Please, support our work with like and comment!

Crude Oil (WTI): Key Levels to Watch Next Here 🛢️
Here are the key levels for you to watch next week on WTI Crude Oil.
Resistance 1: 79.8 - 80.6 area
Resistance 2: 81.75 - 83.5 area
Support 1: 72.3 - 73.8 area
Support 2: 70.1 - 71.5 area
Vertical Support 1: major falling trend line
Consider these structure for a pullback/breakout trading next week.
❤️Please, support my work with like, thank you!❤️

WTI Light Sweet Crude Oil, DAILY Market Analysis 3/2/23For Thursday, 76.49 can contain session weakness, above which 80.20 is likely over the next 3 - 5 days, able to contain weekly buying pressures when tested, and the area settle above for yielding a test of longer-term resistance in the 83.87 - 86.14 region within 1 - 2 more weeks.
Downside Thursday, a settlement today below 76.49 indicates 73.44 tomorrow, also able to contain session weakness and the level to settle below for pivoting the market south into next week, the 68.50 - 70.12 long-term support region then expected over the following 3 - 5 days.

OIL SELLWelcome . oil market. in a very negative state. With the price reaching strong support 77.50, and breaking the pattern. double bottom, there is a lot of pressure from sellers to downgrade the market. To 75 levels in the first stage. And level 74 good luck. Note: If you like this analysis, please give your opinion on it. in the comments. I will be glad to share ideas Thank you

CRUDE OIL - Potential Upward MovementCRUDE OIL already hit demand zone several times and will likely go on a reversal. Exit at 2nd supply zone

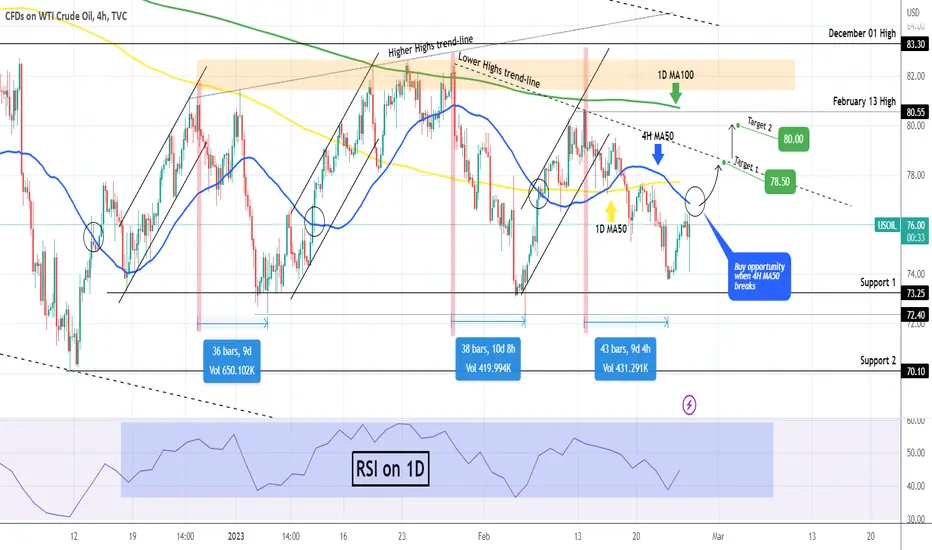
WTI OIL Two break-out buy signals11 days ago we took the best possible sell entry we could have as we shorted the exact top, calling for the best sell opportunity since December:
Right now the price is on a strong rebound, slightly higher than Support 1 (73.25) but with the 1D RSI on a confirmed reversal within its range. If you missed the bottom buy opportunity, wait for a 4H candle closing above the 4H MA50 (blue trend-line) as this was a confirmed buy opportunity on all previous three occasions (circles). First target at 78.50 and if the price closes above the Lower Highs (dashed) trend-line, we will re-buy targeting 80.00.
-------------------------------------------------------------------------------
** Please LIKE 👍, FOLLOW ✅, SHARE 🙌 and COMMENT ✍ if you enjoy this idea! Also share your ideas and charts in the comments section below! **
-------------------------------------------------------------------------------
💸💸💸💸💸💸
👇 👇 👇 👇 👇 👇
Range Trading Light Crude Oil-Crude oil is currently trading in a ranging market environment between 83.34 and 70.08 (larger range). Price is also in a smaller range between 82.66 and 72.46 (smaller range).
-From how I see the markets, the 10AM Feb 23 candle was a retest of a fair value gap before a move higher continues aiming between 79.73 and 81.50 price levels. I would like to see the fair value gap left open and not rebalanced completely.
-Bias: Bullish (within the ranges outlined only)
-Why? Some buyside liquidity will likely be rebalanced with a possible sweep to the upside to test the 83.00 level.
-Targets: 79.73-81.5, possibly up to 82.66 for a sweep.

Oil buyPeace be upon you, there is a high probability of oil rising with the formation of the descending channel. Now he is correcting the golden ratio of Fibonacci 61%. We have two very positive candles in the four-hour time frame

WTI Light Sweet Crude Oil, DAILY Market Analysis 2/16/23For Thursday, 77.04 can contain selling through the balance of the week, above which 83.59 remains a 1 - 2 week target.
Upside Thursday, 81.63 can contain session strength, while closing above 81.63 signals the targeted 83.59 within 2 - 3 days, able to contain weekly buying pressures when test.
The 83.59 formation can be considered the start of a wide zone of longer-term resistance up to 86.22 that may absorb buying through March, once tested the market prone to falling back over that time horizon.
Downside Thursday, closing below 77.04 indicates 75.32 tomorrow, where the market can bottom out into next week.
A daily settlement below 75.32 indicates 69.27 long-term support within a full week of activity.

Crude Oil Futures ( CL1! ), H4 Potential for Bullish RiseTitle: Crude Oil Futures ( CL1! ), H4 Potential for Bullish Rise
Type: Bullish Rise
Resistance: 85.61
Pivot: 80.62
Support: 77.31
Preferred case: Looking at the H4 chart, my overall bias for CL1! is bullish due to the current price being above the Ichimoku cloud, indicating a bullish market. If this bullish momentum continues, expect price to continue heading towards the resistance at 85.61, where the overlap resistance are.
Alternative scenario: Price may head back down to retest the support at 77.31, where the 38.2% Fibonacci line is.
Fundamentals: There are no major news.

CRUDE OIL (WTI) Detailed Technical Outlook 🛢
Video analysis on WTI Crude Oil.
Top-down analysis.
Key levels & price action.
Important things to watch.
❤️Please, support this video with like and comment!❤️
