WTI Light Sweet Crude Oil, DAILY Market Analysis 1/27/23For Friday, both 80.13 and 81.64 can firmly contain intraday trade, beyond which the next notable level is likely intraday.
Downside Friday, breaking/opening below 80.13 signals 78.41, able to contain selling into later next week and the point to settle below for indicating 73.78 by the end of next week, where the market can place a weekly low - possibly into later February.
Upside Friday, pushing/opening above 81.64 allows 83.90 intraday, able to contain buying through next week, and the point to settle above for indicating 86.96 longer-term resistance within 3 - 5 more days.
Crude Oil Futures WTI (CL1!)

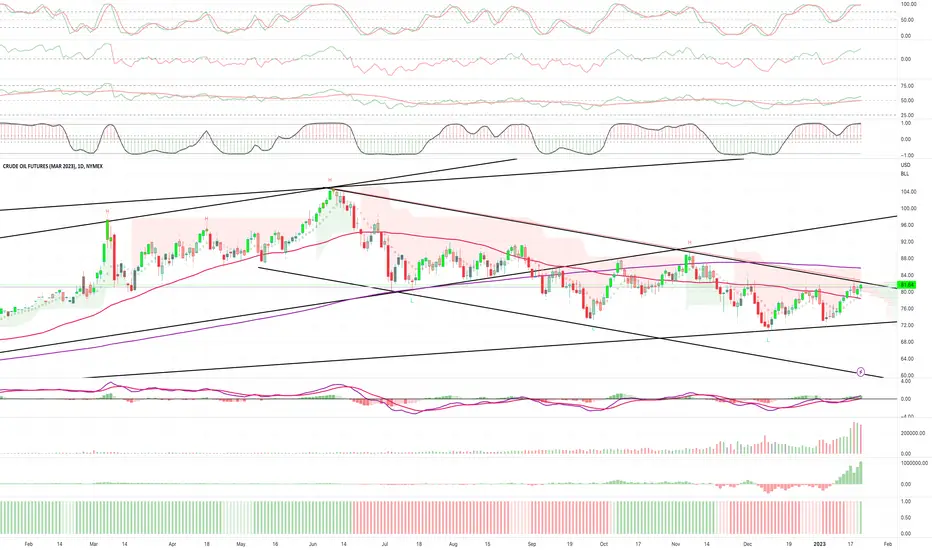
beginning of 2023 will be bullish for oilFrom the previous analysis I analyzed as oil could bottom at 75 dollar.
However it broke my resistant and stayed at 70 dollar point.
Even the oil broke my resistant line. I kept my bullish analysis because it didn't show any major bearish pattern.
I personally confirm that recent bearish move was just a fake one.
I adjusted my bullish target to 90 dollar and I will re-analyze oil again when it reaches to my target.
Double overselling term is showing and sustainable oil demand will push to higher price indeed.

USoil to 70 in 2022Taiwan' s conflict between China is rising in thesedays. people were optimistic about WTI
but now they concern about the major war could begin in pacific ocean near Taiwan.
If China begins the war with Taiwan. The US will sanction on china and the most demanding country of Oil will disappear.
Low demand will lower down the price.
Also the MACD is telling me that WTI has no luck to go higher.
FED could catch inflation but it could create depressing deflation.
Let's see traders! good luck.
Monkeypox is still surrounding us also.

WTI Light Sweet Crude Oil, DAILY Market Analysis 1/26/23For Thursday, both 80.57 and 81.63 can firmly contain intraday trade, beyond which the next notable level is likely intraday.
Downside Thursday, breaking/opening below 80.57 signals 78.42, able to contain selling through the balance of the week and the point to settle below for signaling 73.78 by the end of next week, where the market can place a weekly low - possibly into later February trade.
Upside Thursday, pushing/opening above 81.63 allows 83.77 intraday, able to contain buying through next week, and the point to settle above for indicating 87.02 longer-term resistance within 3 - 5 more days.

Prep for the week - SPX GOLD USOIL and the US DollarAll in the video. Watch for a pullback this week, maybe starting tonight, maybe starting Monday or Tuesday. A little more chop into big tech earnings in early February is likely. Gold looks strong but the Dollar is warning of a reversal soon. Oil is a short still and should have trouble in the 83 area....
Good luck!

OIL1.25.23 OIL: I believe oil Is going to be a profitable short trade. I define the stops and the target comma and I showed you how to create some rage boxes that could be useful. I compared the trend line of oil to that of the ES.

WTI Light Sweet Crude Oil, DAILY Market Analysis 1/25/23For Wednesday, 80.24 can contain selling into later week, above which 83.65 is attainable over the next 2 - 3 days, where the market can top out through next week - once tested it is prone to falling back to 73.68 within several weeks.
Upside Wednesday, a daily settlement above 83.65 signals 86.95 - 87.07 within 3 - 5 more days, longer-term resistance able to contain buying into spring activity.
Downside Wednesday, breaking/opening below 80.24 signal 78.42 intraday, while closing below 80.24 shifts near-term momentum negative, 73.68 then likely by the end of next week, able to contain selling on a weekly basis and if settled below would indicate 67.99 long-term support within another full week of activity.

WTI OIL: Top of Rising Wedge. Trade the rejection or the break.WTI Crude Oil hit the top (HH 1) of the Rising Wedge and got rejected initially but today we see a strong push back to the top. The 1D technicals are bullish (RSI = 61.888, MACD = 1.310, ADX = 33.690) and probably is what's pushing the price back to test the HH 1 again.
Until the time the HH 1 breaks, we are staying neutral, but with more bearish bias. Those will be confirmed if the 4H MA50 breaks, which is the bearish trigger. Then we will sell with TP = 77.00 - 76.00, depending on the 4H MA200 as well. Then as long as the Rising Wedge and HL 1 hold, we will buy again with TP = 82.50 (R1). Break below HL1 will be an additional sell with TP = 72.50 (S2).
The bullish trigger is the R1 whose top is 83.30. Above it we will buy with TP = 87.00 (R2).
Previous analysis:
## If you like our free content follow our profile to get more daily ideas. ##
## Comments and likes are greatly appreciated. ##

WTI Light Sweet Crude Oil, DAILY Market Analysis 1/24/23For Tuesday, 79.92 can contain selling into later week, above which 83.52 is attainable over the next 2 - 3 days, where the market can top out through next week - once tested, the market is prone to falling back to 73.57 within several weeks.
Upside Tuesday, a daily settlement above 83.52 signals 86.95 - 87.12 within 3 - 5 more days, where the market encounters longer-term resistance able to contain buying into spring activity.
Downside Tuesday, closing below 79.92 shifts momentum negative through the balance of the week, 73.57 by the end of next week, likely contain selling on a weekly basis, and if settled below would indicate 67.99 long-term support within another full week of activity

WTI Light Sweet Crude Oil, DAILY Market Analysis 1/23/23In terms of the big picture, a long-term ceiling of resistance is located at 86.95, and floor support at 67.99.
At present, there is no clear indication that either will be tested unless 83.39 is violated upside, and 73.47 violated downside.
Upside, the 86.95 - 87.18 region can contain buying into spring trade, once tested the market susceptible to falling back to 67.99 within several months, where the market can bottom out into summer activity.
A weekly settlement above 87.18 would indicate several months bullish continuation to 103.93, able to contain annual buying pressures as well as a meaningful upside continuation point into later 2023.
-
For Monday, 79.60 can contain selling into later week, above which 83.39 is attainable over the next 2 - 3 days, where the market can top out through next week - once tested market prone to falling back to 73.47 within several weeks.
Upside Monday, a daily settlement above 83.39 signals 86.95 - 87.18 within 3 - 5 more days, where the market encounters longer-term resistance able to contain buying into spring activity.
Downside Monday, closing below 79.60 shifts momentum negative through the balance of the week, 73.47 by the end of next week, likely contain selling on a weekly basis, and if settled below would indicate 67.99 long-term support within another full week of activity
WTI Light Sweet Crude Oil, DAILY Market Analysis 1/20/23For Friday, 79.28 can contain selling through the balance of the week, above which 83.26 is attainable over the next 2 - 3 days, where the market can top out through next week - once tested market prone to falling back to 73.37 within several weeks.
Upside Friday, a daily settlement above 83.26 signals 87.23 - 87.57 within 3 - 5 more days, where the market encounters longer-term resistance able to contain buying into spring activity.
Downside Friday, closing below 79.28 shifts momentum negative into next week, 73.37 then likely within 1 - 2 weeks, where the market can bottom out on a weekly basis and if settled below would indicate 67.56 long-term support within another full week of activity.

What does RSI look like?Don't mind me, I am just messing around...
I did an experiment a while ago, which I now repeat as a standalone idea.
The method is simple, draw some "meaningful" trendlines on RSI which contain 3 touches with RSI.
The 3 points on which RSI touches the trendline, draw a curve on the price chart.
You now have a beautiful chart. Some experienced traders/coders out there could make an indicator that creates channels on RSI, which translates them on the price chart.
With this comparison, we see what RSI is reading, how it is working. We can better understand what RSI trendlines translate to price.
Moral of the chart: Oil price could be bull-flagging.
I am reposting this because this is beautiful, harmonic... organic in a way...
I added an extra line on this one.
Tread lightly, for this is hallowed ground.
-Father Grigori

WTI OIL: Rising on the 4H MA50Crude Oil is rising strongly today on the 4H MA50, recovering from yesterday's rejection on the 1D MA100. Both the 4H and 1D time frames turned bullish technically (RSI = 60.309 & 60.309, MACD = 0.770 & 0.890, ADX = 36.187 & 25.146 respectively) as the price is approaching R1. This is a strong Resistance Zone that has been intact for 2 months. On it is the HH 1 trend-line, which has three Higher Highs already.
The bullish trigger is above 83.40 with TP the R2 at 87.50. The bearish trigger is the 4H MA50 and HL 2 with TP HL 1 and S2.
## If you like our free content follow our profile to get more daily ideas. ##
## Comments and likes are greatly appreciated. ##
## Also DONATIONS through TradingView coins help our cause of increasing the daily ideas put here for free and reach out more traders like you. ##

Short Idea - XOM Exxon Mobile Corporation - Updated 011923Looking at the chart(s) of XOM Exxon Mobile Corporation , are they signaling a short opportunity on the back of lower growth outlook(s) for 23-24'? 🛢⛽️ 📉
Not going to provide much commentary on the macro outlook for U.S. Crude Oil CL1! CL2! CRUDEOIL1! CRUDEOIL2! WTI1! WTI2!, just the charts of XOM:
XOM Weekly Chart: 📊
XOM Daily Chart: 📊
XOM 4-Hour Chart: 📊
XOM Hourly Chart: 📊
XOM 15-Minute Chart: 📊
Here is a more detailed XOM (Short) analysis from @dRends35: 📉
What do you think about an XOM (Short)? 🛢⛽️ 📉
Let me know in the comments below! 👇🏼

Crude Oil - Inverse Head and Shoulder pattern - Break out ? Crude Oil has seen a recent rally from $70 to $81 current resistance level . It has formed a smaller inverse head and shoulder pattern within the parallel channel. Breakout of the resistance level at $81 could have a best case potential target of $93 ( measured inverse head and shoulder target), which also coincides with previous pivot highs resistance levels ( #4).
In between we have other significant resistance levels to break #2 ( Parallel channel in white) and #3 (200 EMA).. Failure to break the current resistance level at $81 could drag the Crude back to next lower target around $65.. Let me know your thoughts in comments.

WTI Light Sweet Crude Oil, DAILY Market Analysis 1/19/23For Thursday, 78.51 can contain selling through the balance of the week, above which 83.08 is attainable over the next 2 - 3 days, where the market can top out through next week - once tested 72.54 attainable within several weeks.
Upside Thursday, a daily settlement above 83.08 signals 87.57 within a full week of activity, where the market encounters longer-term resistance able to contain buying into spring activity.
Downside Thursday, closing below 78.51 shifts momentum negative into next week, 72.54 then likely within 1 - 2 weeks, where the market can bottom out on a weekly basis and if settled below would indicate 67.56 long-term support within another full week of activity.
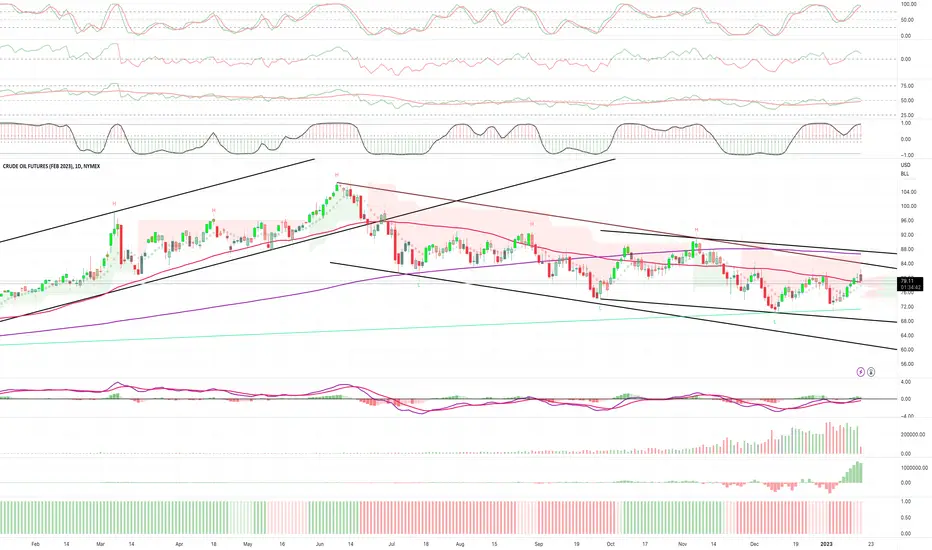
USOIL possible resistance and downtrendSentiment seems to be bullish on WTI with a H&S Inverted pattern but we could have a different view on the price movement actually.
We are now testing multiweek trendline and we could see another downfall as beginning of New Year

WTI Light Sweet Crude Oil, DAILY Market Analysis 1/18/23For Wednesday, 77.92 can contain selling into later week, above which 82.95 is attainable over the next 3 - 5 days, where the market can top out through next week, once tested 72.22 attainable within several weeks.
Upside Wednesday, a daily settlement above 82.95 signals 87.57 within a full week of activity, where the market encounters longer-term resistance able to contain buying into spring activity.
Downside Wednesday, closing below 77.92 shifts short-term momentum negative, 72.22 then likely by the end of next week, where the market can bottom out on a weekly basis and if settled below would indicate 67.56 long-term support within another full week of activity.

Crude Oil (WTI) Your Trading Plan Explained 🛢️
Price action analysis for WTI Crude Oil.
Key levels & detailed trading plan.
Directional bias and thoughts.
❤️Please, support this video with like and comment!❤️

S&P 500 DAILY Analysis 1/17/23For Tuesday, 3972.00 can contain selling into later week, above which the 4068.50 - 4086.00 region is likely over the next several days.
Upside today, 4019.00 can contain intraday buying, beyond which 4068.50 - 4086.00 is attainable intraday, a range of resistance able to contain weekly buying pressures, and a meaningful upside continuation point into February trade.
Downside Tuesday, breaking/opening below 3972.00 signals 3915.50, while closing below 3972.00 signals 3885.00 within several days, possibly retesting 3847.00 by Friday’s close, able to contain selling through next week and a meaningful downside continuation point into February trade.

Smart money bought really cheap Hey everyone,
it looks like smart money bought really cheap in Covid crysis turn and now the prices are really high
Fundamentals are all bad sh1* all here and there now but the chart and TA indicators speaks for itself on this Weekly chart for me.
What I see is rising wedge formation with bearish divergence all over major indicators with very likely double top formation.
I would wait a little bit more for that bear diverged MACD to cross out to enter levearaged short on this oil setup.
This Oil & BTC bubble is so much fun to ride
Money about to moove and sentiment clima about to change very soon very likely
Chachain
KEYWORDS
Oil, CL1!, R:R, money management, risk, reward, technique, style, trading, bitcoin , bitcointrading, profitable trading, profittrading, profit trading, secret, divergence, bull divergence, bear divergence, divergencetrading, divergence trading, trading strategy, how to trade bitcoin , bitcoin trades, bitcoin trading, make profit, take profit, trading strategy, trading technique, successful, successful trader, successful technique, successful strategy, successful secret, how to trade, trend analysis, technical analysis , indicators, rsi , relative strenght index, let it rain, successful life, easy strategy, easy trading, easy technique, make money, crypto investing, investing, crypto, cryptocurrency, cryptocurrencies, mentoring, money, chartart, beyond

WTI Light Sweet Crude Oil, DAILY Market Analysis 1/17/23For Tuesday, 77.68 can contain selling into later week, above which 82.82 is attainable over the next 3 - 5 days, where the market can top out through next week, once tested 71.32 attainable within several weeks.
On the other hand, a daily settlement above 82.82 signals 87.57 within a full week of activity, where the market encounters longer-term resistance able to contain buying into spring activity.
Downside Tuesday, closing below 77.68 shifts short-term momentum negative, 73.47 then attainable within the week, 71.32 by the end of next week, where the market can bottom out on a weekly basis and if settled below would indicate 67.56 long-term support within another full week of activity.

WTI OIL: 1D MA50 failing. Bearish long-term.Oil broke on Friday above the 1D MA50 but sees heavey selling pressure today retracing back below, after the 4H RSI double topped on the 70.000 overbought level. In fact technically the 4H chart is about to turn neutral (RSI = 56.810, MACD = 0.880, ADX = 49.898) and will search for the 4H MA200 - 4H MA50 Zone for the first batch of buyers.
The RSI rejection is along the technical lines of previous long-term bearish moves, in particular draws comparisons with the Double Top of November 7th 2022. This will be confirmed if the Higher Lows (HL) Support breaks. That is our sell signal on which we will target the 70.00 Support.
## If you like our free content follow our profile to get more daily ideas. ##
## Comments and likes are greatly appreciated. ##
## Also DONATIONS through TradingView coins help our cause of increasing the daily ideas put here for free and reach out more traders like you. ##
