Financial Wave. CLOur preferable scenario in CL is the development of the medium-term downward price movement in wave iii, which can lead prices to the first target level of $72.39. If the price rises above $80, this scenario will change.
Crude Oil Futures WTI (CL1!)

Crude Oil (WTI) Time to Recover 🛢️
Hey traders,
I spotted a confirmed bullish breakout of a falling wedge pattern on a daily on WTI Crude Oil.
That indicates that, with a high probability, the market will keep recovering.
I expect a bullish continuation at least to 81.4 resistance.
❤️If you have any questions, please, ask me in the comment section.
Please, support my work with like, thank you!❤️

Opening (Margin): /CL March 16th 37 Short Put... for a 1.60 credit.
Comments: Selling /CL premium on weakness, but giving myself plenty of room to be wrong, targeting the strike that is 50% of current price that has an ROC metric of >10%. 1.60 credit on buying power effect of 9.71. 16.5% ROC as a function of buying power effect; 8.2% at 50% max.

CL1! 1 IDEA HELLO GUYS THIS MY IDEA 💡ABOUT CL1! is nice to see strong volume area....
Where is lot of contract accumulated..
I thing that the buyers from this area will be defend this LONG position..
and when the price come back to this area, strong buyers will be push up the market again..
UP TREND + Resistance from the past + Strong volume area is my mainly reason for this long trade..
IF you like my work please like and follow thanks

MCL bullish patternI'm still short on MCL but it looks like an ending diagonal is taking place for wave 5, IF this is the case i will expect an explosive bullish move to $97 once the pattern has unfolded. I will be patiently waiting, for now i will continue taking short trades

Financial Wave. CLWe continue to stick to our priority scenario in CL and believe that a rise in wave (c) looks the most likely. Price drop below $72.37 jeopardizes this scenario.

Crude Oil (WTI) Bearish Outlook For Next Week 🛢️
Hey traders,
Even though this week was bullish on Crude Oil,
I still remain bearish biased.
I spotted a falling parallel channel on a daily and the price has nicely respected its upper boundary.
I believe oil will drop next week.
Goal - 71.5
❤️If you have any questions, please, ask me in the comment section.
Please, support my work with like, thank you!❤️

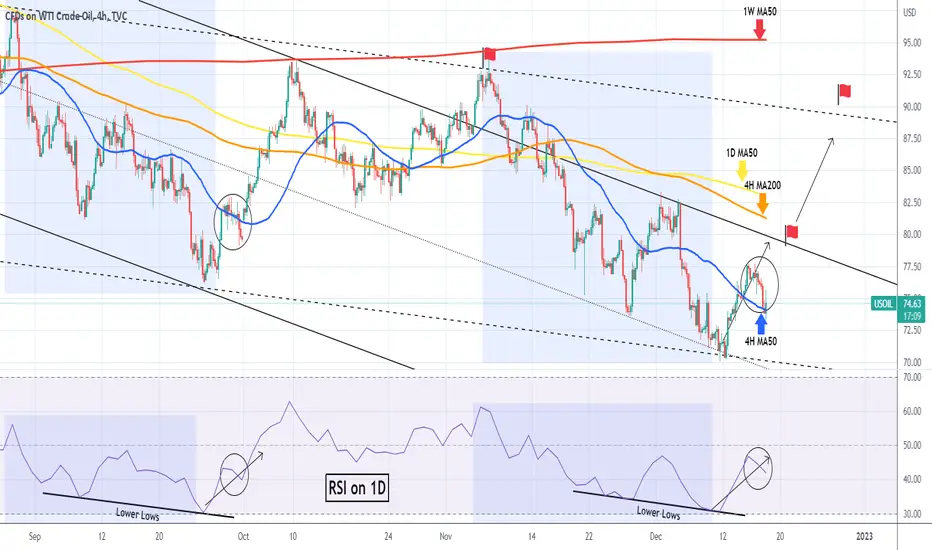
WTI OIL We caught a perfect buy entry, proceed as plannedOn our last WTI Oil (USOIL) analysis 6 days ago we caught the perfect buy entry after spotting the Lower Lows bottom fractal similar to September 26:
That chart was on the 1D time-frame and as you see, we got a perfect rebound that, moving into today's analysis on the 4H time-frame, broke above the 4H MA50 (blue trend-line). We now have a similar pull-back to September 30 and the price is testing the 4H MA50 as Support. If we get the 1D closing above it, we expect this rebound to continue at least 79.50 (which is the former Channel Down top (1st red flag), below the 4H MA200 (orange trend-line). If the price closes above the 1D MA50 (yellow trend-line), be prepared for a potential new Lower High on the diverging Channel Down (dashed lines, 2nd red flag).
-------------------------------------------------------------------------------
** Please LIKE 👍, SUBSCRIBE ✅, SHARE 🙌 and COMMENT ✍ if you enjoy this idea! Also share your ideas and charts in the comments section below! This is best way to keep it relevant, support me, keep the content here free and allow the idea to reach as many people as possible. **
-------------------------------------------------------------------------------
You may also TELL ME 🙋♀️🙋♂️ in the comments section which symbol you want me to analyze next and on which time-frame. The one with the most posts will be published tomorrow! 👏🎁
-------------------------------------------------------------------------------
💸💸💸💸💸💸
👇 👇 👇 👇 👇 👇
Financial Wave. CLOur preferred scenario in CL is confirmed by the price action. We assumed a decrease in CL in the corrective wave (b). The down move looks complete or nearly complete, with wave (c) up to $79.87 most likely. For our scenario, the critical level is $72.37. A price drop below $72.37 will break our markup and change our view.


#1 post - just some educated guess pt 1#disclaimer_mode_on_always
#just some educated guess part 1
#1 post after long hiatus with different league of approach & largely still speculating on theory beyond technical & fundamental approach

CRUDE OIL BULLISH we can a potenial of push to up as i have mention in the chart after break the 15min resitance with good volume we can see little pull back to the red zone but the potential of going to the target is bigger remember this

WTI OIL: Great success on last week's reversalOur short-term 75.82 target got easily hit following the lower than expected U.S. CPI yesterday, as WTI reached (and broke marginally above) the 4H MA50 (now at 75.09). Since it closed a candle above it (4H MA50) that means it turned it into a Support and keeps the trend bullish.
Careful handling is needed as despite 4H turning bullish since yesterday, the 1D remains bearish (RSI = 42.814, MACD = -2.890, ADX = 24.695) and above all the Fed announce the new Rate Decision today. For now, my new target is 79.00. A break above the 4H MA200 (81.97), we can target the 1D MA50 (83.55 and falling), which is the ultimate Resistance.
If the RSI hits its Resistance Zone earlier, book profit and sell again. The long term trend is bearish.
Previous WTI chart:

CRUDE OIL 30 MIN TIMEFRAMES HELLO GUYS THIS MY IDEA 💡ABOUT CL1! is nice to see strong volume area....
Where is lot of contract accumulated..
I thing that the sellers from this area will be defend this SHORT position..
and when the price come back to this area, strong sellers will be push down the market again..
DOWNTREND + SUPPORT from the past + Strong volume area is my mainly reason for this short trade..
IF you like my work please like and follow Thanks

Crude Oil Weekly Volatility Analysis 12-16 Dec 2022 We cCrude Oil Weekly Volatility Analysis 12-16 Dec 2022
We can see that currently the implied volatility for this week is around 6.51%, up from 6.33% from last week according to OVX data
With this in mind, currently from ATR point of view we are located in the 83th percentile,
while according to OVX, we are on 77th percentile.
Based on this, we can expect that the current weekly candles ( from open to close ) are going to between:
Bullish: 4.62% movement
Bearish: 5.6% movement
At the same time, with this data, we can make a top/bot channel which is going to contain inside the movement of this asset,
meaning that there is a 21.3% that our close of the weekly candle of this asset is going to be either above/below the next channel:
TOP: 76.33
BOT: 67.24
Taking into consideration the previous weekly high/low, currently for this candle there is :
30% probability we are going to touch previous high 76.2
67% probability we are going to touch previous low 70.1
Lastly, from the technical analysis point of view, currently from
Weekly timeframe indicates -66% BEARISH trend from the moving averages index
Daily timeframe indicates -80% BEARISH trend from the moving averages index
4H timeframe indicates -53% BEARISH trend from the moving averages index

Crude Oil (WTI): Will The Bearish Rally Continue? 🛢️
WTI Crude Oil is trading in a bearish trend since March.
The price broke and closed below a key daily demand zone last week.
The broken structure: 72.6 - 76.5 area, turned into a resistance now.
I believe that the market may drop lower from that.
Next target will be 62.3 - 66.3 area.
❤️If you have any questions, please, ask me in the comment section.
Please, support my work with like, thank you!❤️

WTI OIL Shouldn't rebound before testing this levelWTI Oil (USOIL) failed emphatically last week to break the 1D MA50 (blue trend-line) as it was rejected just below it and made yesterday and today a new market Low. Based on the RSI sequence as well, the rejection seems similar to September 14 that ended up making a new Low on the Lower Lows Zone (since July 14) on the -0.3 Fibonacci extension.
This extension is currently at 67.55 and we don't expect any meaningful rebound before testing that level. If it does, a rebound back to the 1D MA50 to test again the strength of this multi-month correction is very likely.
Alternatively you can keep an eye on the 1D RSI. Once it gets oversold near 30.00, buy and if it breaks the Lower Highs trend-line, confirm the 1D MA50 target.
-------------------------------------------------------------------------------
You may also TELL ME 🙋♀️🙋♂️ in the comments section which symbol you want me to analyze next and on which time-frame. The one with the most posts will be published tomorrow! 👏🎁
-------------------------------------------------------------------------------
💸💸💸💸💸💸
👇 👇 👇 👇 👇 👇

WTI Light Sweet Crude Oil, DAILY Market Analysis 12/6/22For Tuesday, 83.28 can contain buying into later week, below which 76.50 midterm support is likely again over that time horizon, where the market can place a weekly low, possibly into later December.
Holding above 76.50 allows 91.16 - 92.56 by the end of December, while closing today below 76.50 indicates 65.94 over the same time horizon, the start of a narrowing range of long-term support down to 65.00 able to contain selling through winter activity.
Upside Tuesday , closing above 83.28 indicates 91.16-92.56 within 2-3 weeks, longer-term resistance able to contain buying through winter.

CL Daily Long Idea. Will support holdThe CL daily time frame has pushed bullish off
the monthly support price point 74.40. The market
pushed bullish above the inner trend line and is
showing signs of a potential bullish trend to form.
There is another level of resistance above the
market at price point 88.31 about +810 ticks
above the market. As long as the market stays
above 74.40. It will be a good idea to turn to the
one hour time frame and look for low prices
in the buy zone.

WTI OIL: Bullish as long as 4h MA50 supportsThe price has turned flat as despite today's higher opening, there was a corrective 4H wave. However, as long as the 4H MA50 (78.92) holds and supports, our target remains the 4H MA200 (now at 84.46). Short-term traders may find use in scalping the 1H Bollinger Bands within 81.89 - 79.86, since both 1D and 4H (RSI = 54.999, MACD = 0.570, ADX = 31.841) remain neutral. On the longer term, a break above the 4H MA200, would be a buy break-out call for me, targeting the 1D MA100 (87.67), while a break below the 4H MA50 would be a sell, targeting 77.00.

CRUDE OIL (WTI) Your Detailed Trading Plan 🛢
WTI Crude Oil is approaching a key daily supply area.
The market was nicely rejected from that last week.
Analyzing the intraday perspective, I spotted a head & shoulders pattern on 4H time frame.
79.55 - 80.2 is its neckline.
To short the market with a confirmation, wait for its bearish breakout.
We need a 4H candle close below that to make a breakout valid.
A bearish continuation will be expected then.
Goals: 77.7 / 76.5
If the price respects a neckline and sets a new high then, the setup will be invalid.
❤️If you have any questions, please, ask me in the comment section.
Please, support my work with like, thank you!❤️

Financial Wave. CLCL
Our preferable scenario for CL is to drop the price to $68. The $83-$86 range is key for the CL, the $86 price move cancels our scenario.

CL1! Potential For Bearish ContinuationLooking at the H4 chart, my overall bias for CL1! is bearish due to the current price crossing below the Ichimoku cloud, indicating a bearish market. Looking for a sell entry at 81.30, where the 38.2% Fibonacci line is. Stop loss will be at 84.14, slightly above where the 50% Fibonacci line is. Take profit will be at 76.93, where the 20% Fibonacci line and previous low is.
Please be advised that the information presented on TradingView is provided to Vantage (‘Vantage Global Limited’, ‘we’) by a third-party provider (‘Everest Fortune Group’). Please be reminded that you are solely responsible for the trading decisions on your account. There is a very high degree of risk involved in trading. Any information and/or content is intended entirely for research, educational and informational purposes only and does not constitute investment or consultation advice or investment strategy. The information is not tailored to the investment needs of any specific person and therefore does not involve a consideration of any of the investment objectives, financial situation or needs of any viewer that may receive it. Kindly also note that past performance is not a reliable indicator of future results. Actual results may differ materially from those anticipated in forward-looking or past performance statements. We assume no liability as to the accuracy or completeness of any of the information and/or content provided herein and the Company cannot be held responsible for any omission, mistake nor for any loss or damage including without limitation to any loss of profit which may arise from reliance on any information supplied by Everest Fortune Group.
