WTI Light Sweet Crude Oil, DAILY Market Analysis 10/27/22For Thursday, 84.47 can contain session weakness, 89.87 in reach and able to contain buying through next week, once tested the market susceptible to falling back to 77.94 within 2-3 weeks. On the other hand, closing today above 89.87 indicates the more meaningful 97.29 - 98.96 area within 1-2 more weeks. Downside Thursday, closing below 82.07 signals 82.07 tomorrow, also able to contain session weakness and the level to settle below for indicating 77.94 longer-term support within 2-3 days, where the market can bottom out through November, and above which the 97.29 - 98.96 region is attainable over that time horizon.
Crude Oil Futures WTI (CL1!)
WTI Light Sweet Crude Oil, DAILY Market Analysis 10/26/22For Wednesday, 81.89 can contain session weakness, 85.07 in reach and able to contain session strength. Pushing/opening above 85.07 allows 88.47 intraday, while closing today above 85.07 indicates 90.00 within 2-3 days, where the market can top out through next week, and the level to settle above for yielding the more meaningful 97.57 - 98.96 area within 1-2 more weeks. Downside Wednesday, closing below 81.89 signals 77.94 longer-term support within 2-3 days, able to contain selling through November, and above which the 97.57-98.96 region is attainable over that time horizon.

CRUDE OIL (WTI) What to Look at This Week 🛢
Video analysis on Oil.
In this video you will learn:
Potential scenarios.
Trading recommendations.
Direction bias.
Key levels.
❤️If you have any questions, please, ask me in the comment section.
Please, support my work with like, thank you!❤️

WTI Light Sweet Crude Oil, DAILY Market Analysis 10/25/22For Tuesday, 82.03 can contain session weakness, 85.67 in reach and able to contain session strength. Closing today above 85.67 indicates 90.14 within 2-3 days, where the market can top out through next week and the level to settle above for yielding the more meaningful 97.57 - 98.96 area within 1-2 weeks. Downside Tuesday, closing below 82.03 signals 77.94 longer-term support within 3-5 days, able to contain selling through November, and above which the 97.57-98.96 region is attainable over that time horizon.

my view about cl hello
today is 24 october i share with you my view about cl , oil has been on a bearish trend since June and as you can see now we have broken the bearish channel .

WTI Light Sweet Crude Oil, WEEKLY/DAILY Market Analysis 10/24/22Weekly Analysis:
The 77.94 region can contain selling through November, above which 98.96 is attainable over that time horizon, able to contain buying on a monthly basis and the region to settle above for signaling 2-3 months bullish continuation to 111.95, where the broader market can top out through winter activity. Downside, a weekly settlement below 77.94 will keep the 68.50 region in reach by the end of November or sooner, able to contain broader market selling through the balance of the year.
Daily Analysis:
For Monday, 82.97 can contain selling into later week, above which 90.28 remains a 3-5 day target. Upside today, 86.26 can contain session strength, while closing above 86.26 indicates the targeted 90.28 within 2-3 days, where the market can top out on a weekly basis and the level to settle above for yielding the more meaningful 97.85 - 98.96 area within 1-2 weeks. Downside Monday, closing below 82.97 signals 77.94 longer-term support within 3-5 days, able to contain selling through November, and above which the 97.85-98.96 region is attainable over that time horizon.


CRUDE OIL (WTI) Trading Plan For Next Week 🛢
Hey traders,
WTI Crude Oil has recently reached a key daily structure support.
The market is currently stuck within a horizontal range.
To catch the next trend-following move, watch 81.85 - 83.4 horizontal demand zone.
Wait for its bearish breakout next week - daily candle close below that, then sell aggressively or on a retest.
Targets will be 79.7 / 76.5
Alternatively, a bullish breakout of the underlined resistance may trigger a bullish movement.
Good luck next week!
❤️If you have any questions, please, ask me in the comment section.
Please, support my work with like, thank you!❤️

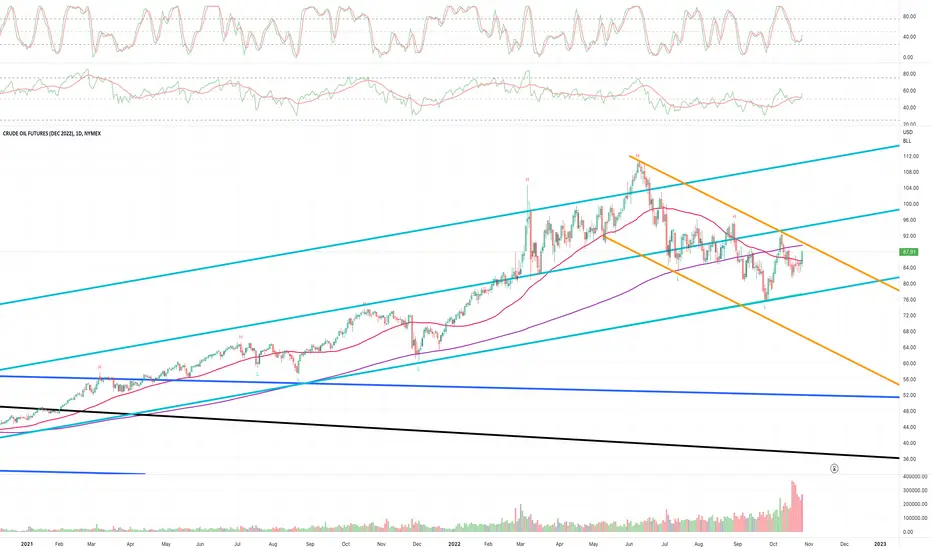
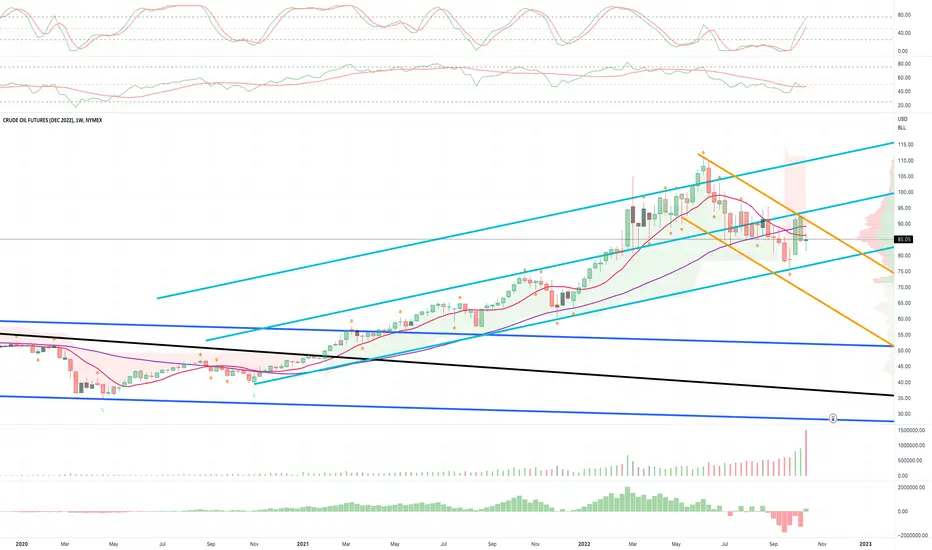
CL1! - Weekly Market Update, 10/24WEEKLY MARKET ANALYSIS - 10/24/22 (CLZ2022)
The TEAL ascending support region currently @ 77.50 for this week can contain selling near term,
above which the descending ORANGE structure above @ 90.00 can contain buying strength near term.
Upside, for this week, we'll be looking for price action to be contained by the TEAL ascending channel above @ 94.00.
A weekly settlement above 94.50 (buy a 1%+ margin) should signal 110.00 to follow.
Downside, 77.50 can contain weekly selling pressures, while a settlement below 77.00 by 1%+
could trigger an accelerated move towards 67.50 followed by 52.50 which is able to contain selling through the balance of the year.
Wheat | Corn | Silver | Oil - Mid TermHere is my idea about commodities:
Wheat= Bearish
Silver= Bullish
Corn= Bullish
CL= Bullish


CRUDE OIL (WTI) Waiting For Breakout🛢
WTI Crude Oil has recently dropped to a key daily structure support.
The market is currently trading within a horizontal range.
To catch the next trend-following move, watch 81.85 - 83.4 horizontal demand zone.
Wait for its bearish breakout - daily candle close below that, then sell aggressively or on a retest.
Targets will be 79.7 / 76.5
Alternatively, a bullish breakout of the underlined resistance may trigger a bullish movement.
❤️If you have any questions, please, ask me in the comment section.
Please, support my work with like, thank you!❤️

WTI Light Sweet Crude Oil, DAILY Market Analysis 10/21/22For Friday, 83.90 can contain selling into early next week, above which 90.42 remains a 3-5 day target, where the market can top out through next week and the level to settle above for yielding the more meaningful 97.85 - 100.26 region within 1-2 weeks. Downside Friday, breaking/opening below 83.90 signals 81.30, while closing today below 83.90 will keep 78.43 longer-term support in reach by the end of next week, able to contain selling through November, and above which the 97.85-100.26 region is attainable by the end of the year or sooner.

Looking for Long Idea on CL The CL daily time frame is near a low price
hitting the long term up trend line. If support
holds. It is expected the market will push bullish
above the short term down trend line entering
into the buy zone. Once or if the market breaks
and closes above the short term down trend line
and enters into the buy zone. I twill be a good idea
to apply up Fibonacci to find the next bullish
Fibonacci price target then turn to the one hour
time frame to look for low prices in the buy
zone. Until then. It is better to be out of the
market wishing to be in than to be in the
market wishing to be out.

CRUDE OIL (WTI) Detailed Technical Outlook 🛢
Multiple time frame analysis on WTI Crude Oil.
Potential scenarios & trading recommendations.
Price action & thoughts.
❤️Please, support this video with like and comment!❤️

CL SELLHI GUYS, there is an 70% chance of a sell on CL, even if the market is bullish ,we're gonna do the opposite and enter in the correction , quick scalp on this one aswell.

WTI Light Sweet Crude Oil, DAILY Market Analysis 10/20/22For Thursday, 84.77 can contain buying through the balance of the week, below a 78.43 long-term support is likely over the next several days. Downside Thursday, 82.07 can contain intraday selling, while breaking/opening below 82.07 allows 78.43 intraday, longer-term support able to contain selling through November, and above which the 97.99-100.26 region is attainable by the end of the year or sooner. Upside Thursday, closing today above 84.77 indicates 90.56 within 3-5 days, able to contain buying through next week and the level to settle above for yielding the more meaningful 97.99 - 100.26 region within 1-2 weeks.

Long opportunity for CL Long opportunity for CL
Entry : 77.85
SL : 76.12
TP1 : 86.58
TP2 : 89.75
TP3 : 93.86
If You Like My Idea Support me With Like :)

WTI Light Sweet Crude Oil, DAILY Market Analysis 10/18/22Please note today begins DEC-22 contract analysis. For Tuesday, 87.79 can contain session strength, 82.39 in reach today and able to contain selling into later week. A settlement today below 82.39 signals a test this week of 78.43 long-term support, where the market can bottom out through November activity and above which the 98.26-100.26 region is attainable by the end of the year or sooner. Upside Tuesday, pushing/opening above 87.79 signals 89.04, while closing today above 87.79 indicates 90.84 tomorrow, able to contain weekly buying pressures and the level to settle above for indicating the more meaningful 98.26-100.26 region within 1-2 weeks.

Can Oil Break Out Again?Oil has continued its corrective pattern as we have fallen from the $90's, back deep into the mid $80's. The corrective impulse took us back to $85.55, which dedicated readers will remember is a strong support level. We have seen green triangles on the KRI to confirm support every time this level has been tested. The Kovach OBV has flattened, suggesting we will need another strong burst of momentum before we are able to press higher. If so, $88.74 is the next immediate target which we will need to break before $90.06, the barrier to the $90's. If we retrace further the next target from below is $84.75.

CRUDE down first before all elseA few simple observations that tell of Crude falling over, despite a previous week of strong bullish price movement from OPEC cuts announcements.
Weekly chart had crude price break above the 55EMA strongly the previous week with a marubozu like candlestick. However, not only did it failed resistance at 94 (dark green line); it broke back down in failure of the weekly 55EMA (white line).
Weekly candlestick formed a Dark Cloud Cover, fully qualified (unlike the SPY. Read about the Dark Cloud Cover candlestick pattern here . This candlestick pattern does not happen often, but is significant as it tells a very logical underlying issue. The gap up is an exhaustion spike, then the downward momentum to more than half of the previous bullish body underscores the overwhelming of the bulls and the victory of the bears. A follow through down candle seals it.
To break the current TD Sequential Setup, the incoming week must close way below 79. Oddly enough, to change the primary trend in the daily chart to a bearish trend, price has to close below 79. Coincidence? Maybe, but 79 IS the critical support now.
The daily chart (right) has its own failures too. We see a clear breakdown failure of the daily 55EMA, coincidentally about a similar level as the weekly 55EMA (white line). With a retest failure just this week, it ended with a nice large red candle that engulfed the previous day's test of the 55EMA. Here, technical indicators all show more downside to come.
In like with all of these, the expected surge of the USD (recently posted and linked below) over the next few weeks; it appears that crude is about to tank to 70-75. Previously projected a downside target of 70, might have to readjust closer to 75, as conditions continue to develop and evolve.
Crude appears bearish (again) in the short term.

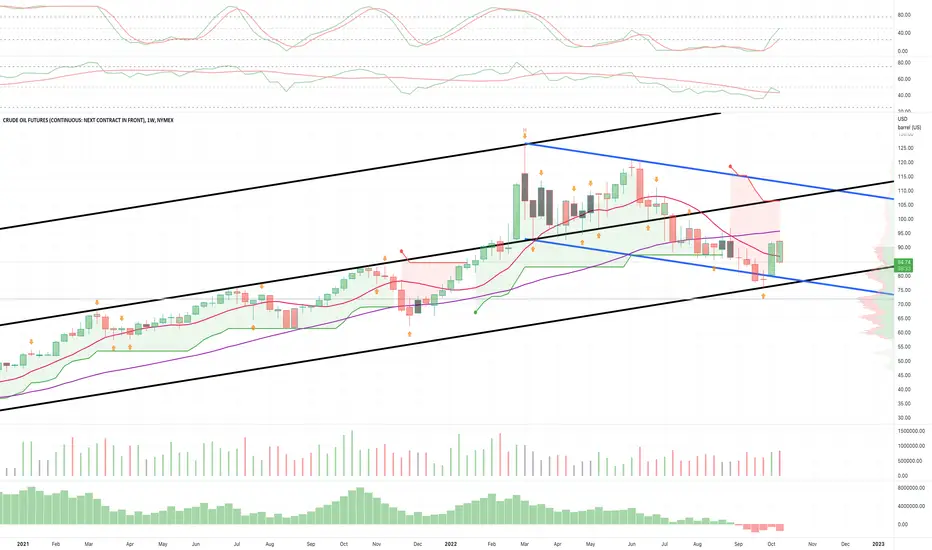
CL1! - Weekly Market Update, 10/17Crude Oil futures have failed at their attempt at overcoming the 200 day SMA. The remains a difficult market to swing trade. However the day trading has been great!
BUY PETROL CLHello ladies and gentlemen,
according to my chart analysis of the PETROL, there is a high probability of a decline toward the $117.00 level in the next few weeks!
