TP REACHED ON USOILEarlier today I posted to buy on USOIL and now the market have reached out TP.
Follow for more daily trades!
Crude Oil Futures WTI (CL1!)


TP REACHED ON CL/US OIL/CRUDE OILYesterday I posted to sell on CL/CRUDE OIL/US OIL and today the market have reached our TP.
For further questions don't hesitate to ask!
Follow for more analysis!

Crude oil saved by the 200-day MA (for now)A combination of factors saw crude oil snap its 5-day winning streak on Tuesday. China's equity markets plunged at double-digit levels when traders realised no new stimulus from China was to be unveiled after golden weak. US production forecasts were lowered by the EIA and concerns over the Middle East receded somewhat.
An elongated bearish engulfing / outside day formed after its daily high met resistance at the September 2023 trendline. Yet the 200-day MA came to the rescue. For now at least.
Given the 4-hour bullish hammer at the 200-day MA and weekly R1 pivot, alongside a heavily oversold RSI (2) on that timeframe, I suspect a cheeky bounce could be in order. Bulls could cautiously seek dips for a move to $75 or $76.
Yet the magnitude of Tuesday's selloff suggests bears may be lurking at higher prices to re-enter upon any such bounce. Bears could wait to fade into such levels in anticipation of a return to the $70, near a high-volume node (HVN) and 61.8% Fibonacci level.
MS

SELL USOIL/CRUDEOILOur entru today on Crude Oil is a short one, you can sell with TP and SL as set on the chart.
For more questions, don't hesitate to ask!
Follow for more.

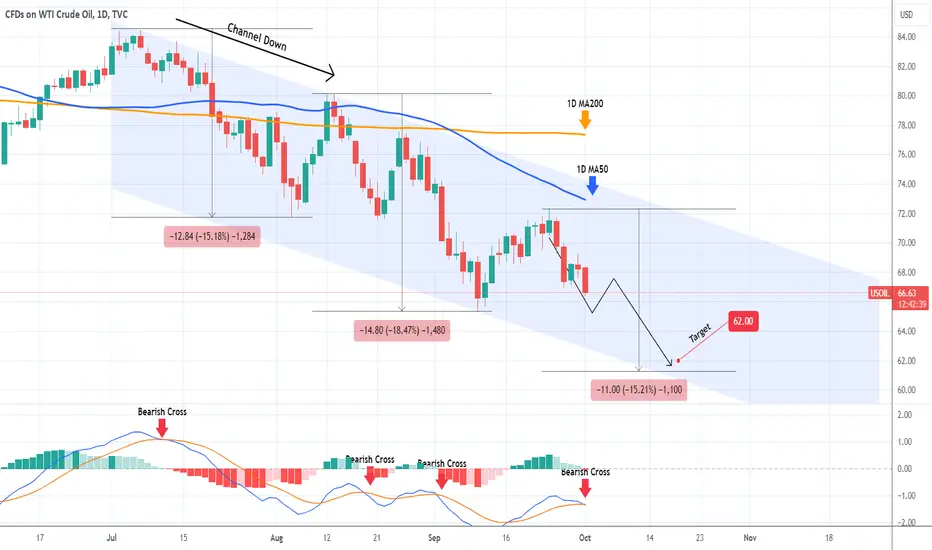
WTI OIL Channel Down prevailed. Lower Low expected.WTI Oil (USOIL) eventually failed to recover the 1D MA50 (blue trend-line), which has been the Resistance since August 13, and reversed the short-term rebound. The 3-month Channel Down appears to have prevailed and technically is now looking for its third Lower Low.
The previous two declined by -18.47% and -15.18% respectively, so roughly we same % drop. As the 1D MACD formed a Bearish Cross today, we can claim that we have the necessary confirmation for a Bearish Leg that at best, we are half-way on it.
Assuming the minimum drop of -15.18%, we expect to see at least $62.00 before this Leg prices the Lower Low.
-------------------------------------------------------------------------------
** Please LIKE 👍, FOLLOW ✅, SHARE 🙌 and COMMENT ✍ if you enjoy this idea! Also share your ideas and charts in the comments section below! This is best way to keep it relevant, support us, keep the content here free and allow the idea to reach as many people as possible. **
-------------------------------------------------------------------------------
💸💸💸💸💸💸
👇 👇 👇 👇 👇 👇
CRUDE OIL (WTI): Intraday Bearish Confirmation
Update for WTI Crude Oil.
Earlier, I share a very bearish setup on a daily.
Analyzing the intraday time frames today, I spotted
a strong bearish confirmation on an hourly.
Retesting a recently broken horizontal resistance,
the price dropped and violated a support line of a rising wedge pattern.
It is an important sign of strength of the sellers.
With a high probability, the price will drop at least to 67.15 level.
❤️Please, support my work with like, thank you!❤️

Crude Oil upside Target 71.70Crude oil is presenting a promising buying opportunity as it approaches a crucial support level at $66. This level has demonstrated significant resilience, making it an ideal point for traders looking to enter the market. Our target for this trade is set at $71.70, which aligns with key resistance levels that could be tested as the market moves upward.
In addition, our proprietary indicator has signaled a buying opportunity on the daily chart, further validating our bullish stance. The geopolitical tensions in the Middle East add another layer of urgency, as such instability often drives oil prices higher due to supply concerns.
As we navigate through these market dynamics, now is an opportune time to consider adding crude oil to your portfolio. Keep an eye on price action around the $66 support, and be prepared for potential upward momentum towards our target of $71.70.
Buying at Current Label
Stoploss - 66
First Target 70
Second Target 71
Third Target 71.70

Crude Oil (CL1!): Waiting for the perfect entry after declineWe have continued to see crude oil prices fall lower and lower since we first analyzed it five months ago. The recent price decline is largely attributed to a worsening demand outlook. According to Commerzbank, the post-pandemic normalisation of demand growth in China has sharply deteriorated. Between April and July, oil demand was even lower than the previous year, and data released last weekend offers little hope for improvement in Chinese crude oil processing for August.
Additionally, the International Energy Agency (IEA) has revised its forecast for global oil demand down to 900,000 barrels per day, with China accounting for just 20% of that growth. What was once a driver of demand is now seen as a drag on the market. The IEA projects that oil demand in China will rise by 260,000 barrels per day by 2025.
With the continued struggles of global oil demand on one side and Middle East tensions on the other, it makes sense to set a limit order on crude oil as we closely watch how well NYMEX:CL1! respects the key levels on the chart. We're still targeting the $63.23-$57 range for a potential buy-in as we continue to monitor the market for an ideal entry point.

CRUDE OIL (WTI): Potential to Drop Lower
WTI Crude Oil broke and closed below a key daily horizontal support.
The broken structure and a falling trend line compose a contracting
supply zone now.
With a high probability, the price will drop from that zone all the way down
to 66.3 level - the closest historic support.
❤️Please, support my work with like, thank you!❤️

Brent crude oil looks into the abyss: first $36 then $27 Brent oil is in the giant range of $16 and $150
The price is in the decline within the red large leg 2 down.
It consists of 2 white smaller legs.
Leg ii is in the progress after a small consolidation (blue).
The first downward target is at the bottom of red large leg 1 at $36
The next target is located at the equal distance of red large leg 1 in second leg at $27
Saudi Arabia gave up oil target of $100 to increase output.
Cooling Chinese economy is also a bearish factor.

WTI CRUDE OIL has bottomed. Buy.WTI Crude Oil has rebounded initially on Support A, a level that is holding since March 20th 2023.
At the same time the 1day RSI double bottomed the same way it did in December 2023 and May 2023.
This is a clear buy signal that is targeting the 1day MA200 and the Falling Resistance at 78.00.
Follow us, like the idea and leave a comment below!!

WTI OIL Still bullish, targeting the 1D MA200.WTI Oil (USOIL) eventually gave us the 2 green day streak we wanted in order to turn bullish, as per our suggestion 2 weeks ago (September 10, see chart below):
Event though it marginally broke below April's Channel Down, the buying pressure it has build is similar to all 3 major Bullish Legs since June 2023. Notice how the 1D RSI forms the same Bullish Divergence (Channel Up).
However due to the lower bottom than the one we expected, we have to change our Target to 76.00, which represents a +16.60% rise from the bottom, similar to the smaller Bullish Leg of the three that started on the June 04 2024 Low.
-------------------------------------------------------------------------------
** Please LIKE 👍, FOLLOW ✅, SHARE 🙌 and COMMENT ✍ if you enjoy this idea! Also share your ideas and charts in the comments section below! This is best way to keep it relevant, support us, keep the content here free and allow the idea to reach as many people as possible. **
-------------------------------------------------------------------------------
💸💸💸💸💸💸
👇 👇 👇 👇 👇 👇

CRUDE OIL (WTI): Detailed Support and Resistance Analysis
Here is my latest structure analysis and important key levels
to pay close attention to on WTI Crude Oil.
Vertical Structures
Vertical Resistance 1: Falling Trend Line
Horizontal Structures
Resistance 1: 71.46 - 71.90 area
Resistance 2: 73.80 - 74.30 area
Resistance 3: 76.00 - 77.60 area
Resistance 4: 79.60 - 80.16 area
Support 1: 63.80 - 65.70 area
Consider these structures for pullback/breakout trading.
❤️Please, support my work with like, thank you!❤️

WTI CRUDE OIL: Best buy opportunity in more than a year.WTI Crude Oil is almost oversold on its 1D technical outlook (RSI = 36.459, MACD = -2.670, ADX = 29.899) and coupled with the the price breaching inside the S1 Zone, the market is giving the best long term buy opportunity in more than 1 year. The S1 Zone is in place since March 15th 2023. Additionally, the 1D RSI has made a Double Bottom (DB), which has a 100% success record out of 3 times since March 2023. Every rebound to the LH trendline (pattern is a long Descending Triangle) approached the 0.786 Fibonacci level. Our TP = 78.00.
## If you like our free content follow our profile to get more daily ideas. ##
## Comments and likes are greatly appreciated. ##

WTI OIL giving a buy signal under this condition.Last week we saw how WTI Oil (USOIL) turned bearish long-term following the 1W Death Cross and the breaking below the 16-month Higher Lows trend-line. Even on the 1D time-frame we got a Death Cross formation with the price seemingly reaching the bottom (Lower Lows trend-line) of a newly formed Channel Down.
As a result we may have a short-term buy signal but only if today's 1D candle closes in green, which together with yesterday will make it a series of green days. As you can see on the chart, every time the 1D RSI posted a Bullish Divergence (rising while Oil was falling), it posted successive 1D green candles to confirm a rebound.
So the key now is to form again a streak (even 2) of green days. If not, the buy potential is invalidated. If successful though, we will target 78.00 (top of the Channel Down, +16.55% rise as the previous Bullish Leg).
-------------------------------------------------------------------------------
** Please LIKE 👍, FOLLOW ✅, SHARE 🙌 and COMMENT ✍ if you enjoy this idea! Also share your ideas and charts in the comments section below! This is best way to keep it relevant, support us, keep the content here free and allow the idea to reach as many people as possible. **
-------------------------------------------------------------------------------
💸💸💸💸💸💸
👇 👇 👇 👇 👇 👇

Bears wade into crude oil futures: CL1!An influx of short bets against WTI crude oil futures is behind the recent leg lower for oil prices. But having already fallen nearly 14% over eight days, bears may want to tread carefully with a fresh catalyst. Matt Simpson takes a look at the weekly, daily and 4-hour chart alongside large speculative positioning.

WTI OIL formed 1st 1W Death Cross in 4.5 years!The last long-term signal (July 09, see chart below) on WTI Oil (USOIL) was a rejection (sell) at the top of the former Triangle (Lower Highs trend-line):
The price not only broke below both the 1W MA50 (blue trend-line) and the 1W MA200 (orange trend-line) but also the bottom of the Triangle. The result this week is the formation of a 1W Death Cross, the first one since the COVID crash back in March 2020!
Naturally this is a strong bearish signal, which will be confirmed if the price breaks below the Higher Lows trend-line. If it does we may see a fatal market collapse, as this is a cyclical signal (observe the Sine Waves). In May 2009, it was invalid as the Housing Crisis preceded it, in November 2014 it was halfway through the sell-off of the Oil Crisis and Chinese economic slowdown and in March 2020 it came earlier relative to the previous two but still after the price broke below the Higher Lows trend-line.
As a result, this trend-line is of the utmost importance currently and only if broken (and close a 1M candle below it) can we consider a similar collapse. If it does, we expect at least $45.00, on the way to the Symmetrical Support Zone test.
-------------------------------------------------------------------------------
** Please LIKE 👍, FOLLOW ✅, SHARE 🙌 and COMMENT ✍ if you enjoy this idea! Also share your ideas and charts in the comments section below! This is best way to keep it relevant, support us, keep the content here free and allow the idea to reach as many people as possible. **
-------------------------------------------------------------------------------
💸💸💸💸💸💸
👇 👇 👇 👇 👇 👇

WTI OIL This is why it's going to $95.00 if the 1M MA50 helps.WTI Crude Oil (USOIL) has been practically neutral within a Triangle pattern since September 2023, trading under the Resistance pressure of the Lower Highs but at the same time supported by a Higher Lows trend-line. The latter has been placed just below the 1M MA50 (blue trend-line), which is the key to Oil's price action in the coming months.
As you can see, even when the price breaks below it, Oil manages to close the 1M candle (month) above the 1M MA50. In fact the last time it closed a month below it was more than 3.5 years ago (January 2021)!
As a result, if we manage to close August above it again, we expect a strong rebound for Oil. In fact, a similar Triangle pattern was spotted back in 2011 - 2013. As you can see, after several breakings but also closings above the 1M MA50, it eventually initiated a rally that hit the Resistance 2 level.
The 1M RSI sequences among the two fractals are similar as well, so we find no reason why Oil won't stage a similar rally as long as the 1M MA50 keeps holding. Our long-term Target is $95.00.
-------------------------------------------------------------------------------
** Please LIKE 👍, FOLLOW ✅, SHARE 🙌 and COMMENT ✍ if you enjoy this idea! Also share your ideas and charts in the comments section below! This is best way to keep it relevant, support us, keep the content here free and allow the idea to reach as many people as possible. **
-------------------------------------------------------------------------------
💸💸💸💸💸💸
👇 👇 👇 👇 👇 👇

WTI OIL Short-term pullback possible but doesnt change the trendLast week (August 06, see chart below), we made a strong bullish case on WTI Crude Oil (USOIL) and why on the 1M time-frame, the long-term target is $110.00, a symmetric approach on the 10-year Super Cycles:
Today we shift back to the shorter term 1D time-frame, as the price went from $73.00 to $80.00 within a week, and we are looking for potential pull-backs. Short-term corrections on medium-term Channel Ups have been common in the past 1.5 year and are displayed by the red ellipse patterns.
Yesterday's rejection took place on the 1D MA100 (green trend-line), which is something that also took place on January 29 2024. Assuming that a new Channel Up will emerge, we expect it to reach at least the 1.5 Fibonacci extension at $91.50, similar to the April 05 2024 High.
There are numerous Resistance levels involved this time however, with the strongest being the Lower Highs trend-line that started after the September 28 2023 High. As a result caution is advised once the price approaches that level.
-------------------------------------------------------------------------------
** Please LIKE 👍, FOLLOW ✅, SHARE 🙌 and COMMENT ✍ if you enjoy this idea! Also share your ideas and charts in the comments section below! This is best way to keep it relevant, support us, keep the content here free and allow the idea to reach as many people as possible. **
-------------------------------------------------------------------------------
💸💸💸💸💸💸
👇 👇 👇 👇 👇 👇

WTI: Knock, knock…WTI recently rejected the lower edge of the turquoise Target Zone between $79.67 and $85.86. We expect a further advance into this range before the high of turquoise wave B can be established. The price should then turn around and sell off with the last leg of the green wave (2) into our same-colored Target Zone between $49.85 and $27.93.

CRUDE OIL (WTI): Time For Pullback
WTI Oil may pull back from a recently broken
daily structure resistance that turned into a support now.
As a confirmation, I see a double bottom pattern on an hourly time frame.
I think that the price can bounce to 79.25 level.
❤️Please, support my work with like, thank you!❤️

Thursday Blow - Crude OilSo we have been short term bullish since we took the Weekly SSL and seen a nice trade higher.
I can imagine that we continue this today to take out some internal liquidity.
These are the short term targets as long as we respect the 15min FVG
GLGT
