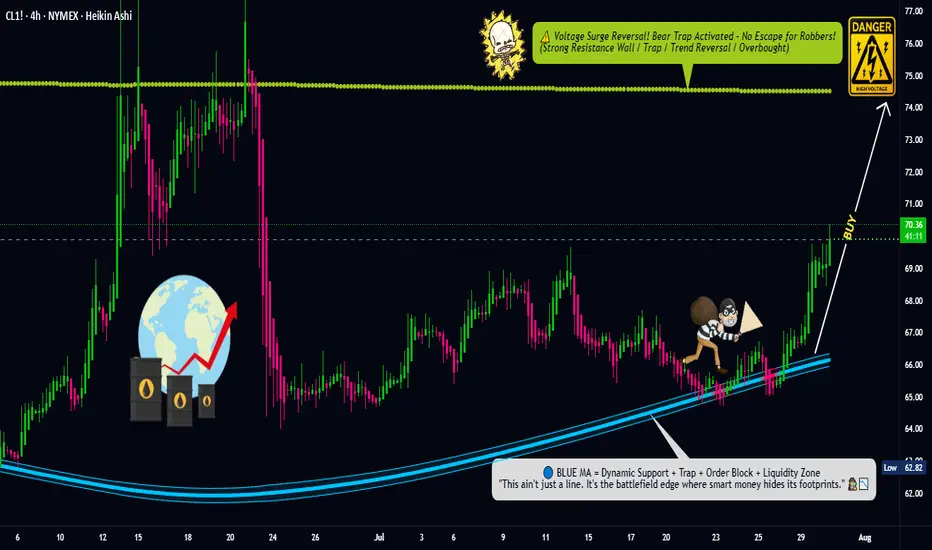
Oil Trap Activated – Limit Orders Set for the Big Score💥🛢️Crude Oil Vault Breach Plan – DCA Heist Begins!🧨💰
🚨Asset: CL1!
📈Bias: BULLISH RAID MODE ON
🎯Target: $74.50
🛡️Stop Loss: $67.50
🔑Entry: ANY LEVEL – Thief stacking limit orders like layers of gold bars 💼⚖️ (DCA Mode Activated)
🕵️♂️Thief Trader is not chasing, we're ambushing 🧠 — scaling in smart with multiple limit traps. The crew never FOMOs, we trap the market 🎯.
💣This is a layered loot plan, not for weak hands. Watch how we load up quietly while market sleeps 😴, then hit hard when the vault cracks open 🔐.
Support this heist by smashing that ❤️LIKE button
💬 Comment your plans below & join the real thief squad
🤝 Together we rob the market — LEGALLY & LOGICALLY
#ThiefTrader #OilHeist #CL1 #BullishTrap #DCA #CrudeOilStrategy #SmartMoneyPlay #MarketRobbery #TeamLoot #NoRetailPanic
Cl1!long
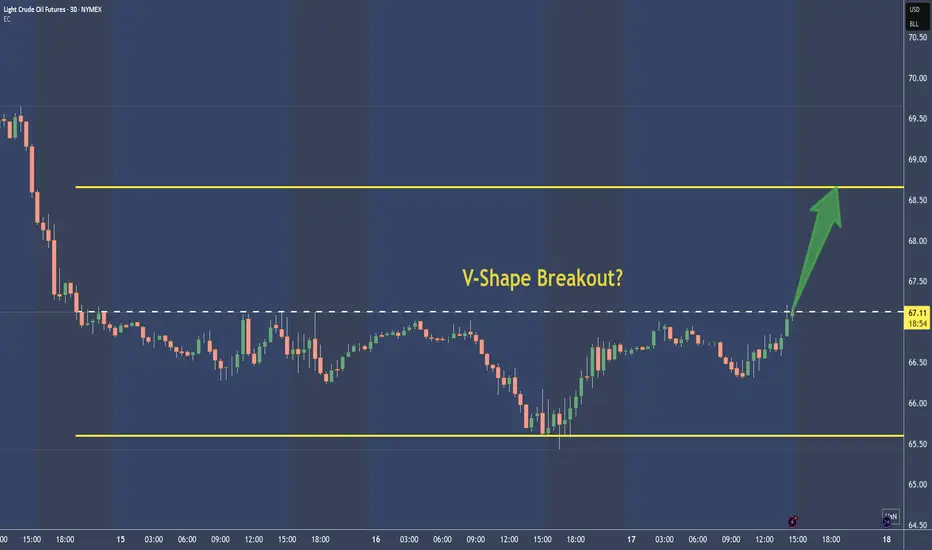
Crude Oil - CL shows a superb V-Shape Long-TradeNot much to say here.
To me it's just a BUY, with the target around the upper yellow line. Stop depends on movement. I add and remove Contracts, until there is a nice ternd or momentum established.
Trade is toast below the V.
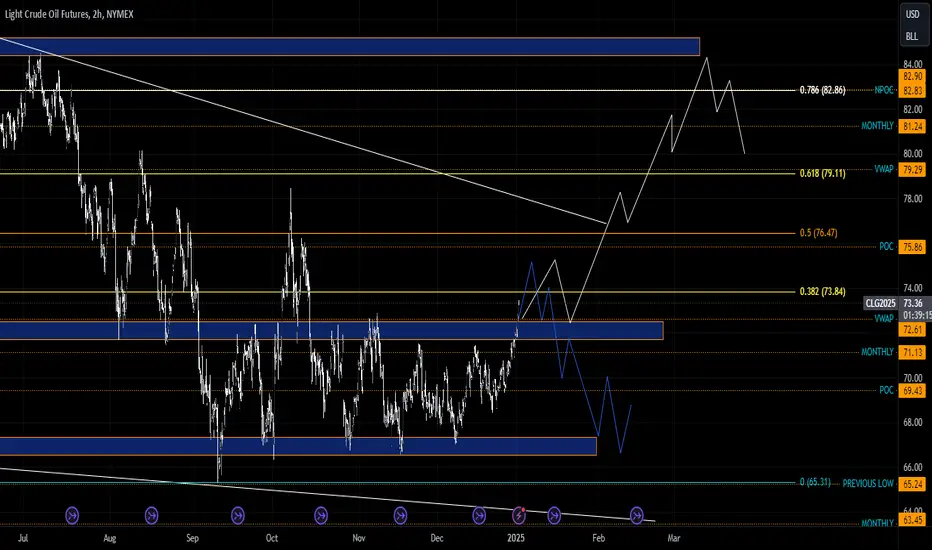
Crude Oil Going Higher - TA and fundamentals aligneThe 0-5 count is not over yet.
Sudo 4 and 5 are still lurking.
It's good to see how the Medianline-Set cought the Highs of the swings. Likewise we can see the subborn rejection at the Center-Line at P3.
I will not trade CL to the short side, until it's clear that P4 is engraved in this Chart. Until then, I maybe shoot for some intraday or dayli trades in Crude.
Economy Facts that support a rise, up to P4:
Crude oil refineries typically switch to producing more gasoline (fuel for cars) in the spring, particularly around March to April in the United States and other northern hemisphere countries.
Seasonal demand: Warmer months mean more driving and vacation travel, increasing gasoline demand.
Regulatory change: Refineries begin producing summer-grade gasoline, which has lower volatility and is required by environmental regulations (especially in the U.S. under EPA rules).
The switch to summer-grade gasoline must be completed by June 1st for retail and May 1st for terminals and pipelines in the U.S.
In Summary:
- Switch begins: March–April
- Completed by: May (terminals), June (retail)
- This seasonal shift is often called the "refinery maintenance season" or "spring blend switch."

I've Cracked the BULLISH Code in Crude Oil Using COTCrude oil is setup for longs based on fundamental conditions underlying the market place.

CL Short Termin Potential LongHey Crudsters, it's time to prep for a long.
Price reached the Center-Line and has a good chance for a push to the north.
Watchout and be prepped.

CL1! Scenario 2.1.2025 The price has currently broken through one of the main resistances and we have oil at 73 and then I have two scenarios: either the price does not break through the support at 72.5 and goes up, but I would like to see an sfp below the low, if we were to consider a short, I would like an sfp above the high, then there would be a potential entry.
Scenario on light crude oil cl1! 13.12.24If we can maintain the main monthly level, which is also support for the price of 71.66-72.44, then it is likely that the market will come for levels around 65, but if the market were to break through this level, then there is a possible scenario that the price could go higher and I would take the first tp somewhere around 75, but there are other big levels above that and the price could even reach 80.

WTI looks set to bounce above $80Oil prices have retraced just under 8% from the MTD (month-to-date) high. And it looks like the market is trying to stabilise around a support cluster, just above the $80 handle. The cluster includes the 50-day MA, high-volume node and prior consolidation zone.
A small doji also firmed around these levels to suggest a swing high has formed, or very near.
A bounce to $84 could be on the cards as part of a technical retracement against its prior move lower. Bulls could enter live around current levels with a stop beneath $80, or seek dips towards it in anticipation of an eventual move higher to increase the potential reward to risk ratio.

CL once a week update Jan 29thSharing CL update from TTR.
Will be updating CL once a week or so.
CL is trending above its 5EMA on a daily level; first support sits at 76.10, and the main support is at 74.55±
The main target is above 82.50
Bullish trend was just started imo

Crude oil looks set to bounce ahead of OPECWith oil prices having fallen around -25% from the September high, a correction higher may be due.
And as prices failed to hold beneath $70, Wednesday's bullish hammer (which is also a higher low) has caught out eye). The hammer was coupled with above-average volume to suggest demand around $75, and the initial break below $70 was seen on strong negative delta (more sellers than buyers) which means the subsequent move higher likely forced them to cover and reconsider their direction.
A move towards $75 could help improve the reward to risk ration for an anticipate move to $80, a break above which brings $82 into focus just beneath the January and April highs.

Swing trade long for WTIWe saw the pullback into the support area we were waiting for, around the 200-dar EMA on the 4hour chart and weekly pivot point. A bullish engulfing candle also formed at the end of the session, and whilst prices have gapped lower at the open, we're now looking to enter long and target the resistance zone around $90.

WTI 's rally could just be getting startedThe more we look at market positioning on WTI, the more we suspect that oil may be dominating headlines as we head into 2024.
In recent weeks we can see that large speculators and asset managers have been increasing long exposure and reducing shorts, which is the ideal scenario for a bullish trend. Yet net-long exposure for both sets of traders remains low by historical standards, and therefore shows no immediate threat of the move higher being extended. If anything, it could look underbought considering OPEC's desire to support prices.
And when you consider oil is rising despite the stronger US dollar, you get to appreciate how strong the rally could get if the dollar's rally were to falter. Either way, with a rising US dollar and oil prices, 2024 could get messy and perhaps risk assets will get their reckoning once more.

Crude going for bullish run check EMA going to push price to 95 in coming days.
50 crossing 200 very bullish
good risk management setup can bring best returns

CL1!: Long Signal with Entry/SL/TP
CL1!
- Classic bullish pattern
- Our team expects retracement
SUGGESTED TRADE:
Swing Trade
Long CL1!
Entry - 81.58
Stop - 79.84
Take - 84.18
Our Risk - 1%
Start protection of your profits from lower levels.
❤️ Please, support our work with like & comment! ❤️


Trading the range on WTI (CL1!)Oil prices are trading quite erratically on the daily chart, making it a much less appealing market to trade on that timeframe. But that doesn't mean we cannot find potential inflection points at the intraday level.
Monday's opening gap has been filled, and earlier losses on Tuesday were fully recouped to print a bullish pinbar on the daily chart which found support just above $70. We're not looking for a huge move, but we see the potential for prices to have another crack at the $73, and the 3-wave retracement towards $71 looks appealing for a swing trade long. Take note of the HVN (high volume node) around $72.64 which could act as a magnet should momentum eventually turn higher.
We're not sure the actual swing low is in yet, so we're looking for higher volumes accompanied by one or more bullish reversal candles on the hourly timeframe or lower, to hint at a swing low. And if it can form above or around the $71 support zone it could provide an adequate reward to risk ratio for a cheeky long.

CL1! Will Go Up From Support! Long!
Please, check our technical outlook for CL1!.
Time Frame: 8h
Current Trend: Bullish
Sentiment: Oversold (based on 7-period RSI)
Forecast: Bullish
The market is on a crucial zone of demand 72.77.
Taking into consideration the structure & trend analysis, I believe that the market will reach 76.39 level soon.
P.S
Please, note that an oversold/overbought condition can last for a long time, and therefore being oversold/overbought doesn't mean a price rally will come soon, or at all.
Like and subscribe and comment my ideas if you enjoy them!

WTI breaks out ahead of US inflation dataWe suspect volatility may be on the quiet side with a US inflation report looming, but this provides the opportunity for markets to consolidate and traders plan trades.
Should we see the pace of inflation to continue slowing, it could strengthen oil prices for two basic reasons.
1 - A weaker US dollar, as traders bring forward rate cut bets / solidifies bets of 5.25% peak rate
2 - Reduces the odds of a recession and increases oil demand expectations
The softer inflation is, the stronger the bullish reaction for oil could be expected.
- WTI futures closed above trend resistance following a bull-flag breakout, which was accompanied by positive-delta volume during the rally to recent highs.
- Prices are now consolidating, but we'd welcome a pullback towards $73 to buy dips in anticipation of a breakout above $74.
- Initial target is $76 (near the upper daily ADR band)
- A move to (and beyond) $77 could be on the cards if we're treated to a weaker-than-expected inflation report
- The bias remains bullish above $72.50

WTI breaks out of consolidation, $90 up next?WTI broke out of consolidation and closed above its 200-day EMA and resistance zone. The OBV (on balance indicator) confirmed the breakout with a move to a new cycle high, and volumes (whilst below average) are turning higher to show buyers stepping back in.
Furthermore, we saw a gap ahead of the consolidation above HKEX:79 , although using classic definitions it doesn't quite fit into 'breakaway' or 'runaway' gap category. Regardless, we've seen a 30% rally from the March low with a gap along the way, OPEC+ cut oil production, and the trend points higher.
With that said, the 200-day MA is capping as resistance, so bulls may want to wait for a break (or daily close) above the level. But overall, the risks appear skewed to the upside.
- The bias remains bullish above 79 and an initial move to 90, then the 93.60 highs
- Wednesday's low could be used for tighter risk management

Crude Oil- News-driven. Financial Wave.Oil rose sharply after news of production cuts. While "news-driven" price reactions are often volatile, we are inclined to continue rising for Crude Oil. Our priority scenario is to continue rising from the low of 64 into the 86 range. Support is around 78.85-77.10.

CRUDE OIL - Potential Upward MovementCRUDE OIL already hit demand zone several times and will likely go on a reversal. Exit at 2nd supply zone

Range Trading Light Crude Oil-Crude oil is currently trading in a ranging market environment between 83.34 and 70.08 (larger range). Price is also in a smaller range between 82.66 and 72.46 (smaller range).
-From how I see the markets, the 10AM Feb 23 candle was a retest of a fair value gap before a move higher continues aiming between 79.73 and 81.50 price levels. I would like to see the fair value gap left open and not rebalanced completely.
-Bias: Bullish (within the ranges outlined only)
-Why? Some buyside liquidity will likely be rebalanced with a possible sweep to the upside to test the 83.00 level.
-Targets: 79.73-81.5, possibly up to 82.66 for a sweep.

Oil buyPeace be upon you, there is a high probability of oil rising with the formation of the descending channel. Now he is correcting the golden ratio of Fibonacci 61%. We have two very positive candles in the four-hour time frame
