cl1! long nowThis market is witnessing an unusual movement and the possibility of a rise is very high
My advice is to buy
Cl1!long

LIGHT CRUDE OIL FUTURES longNYMEX:CL1!
This market is witnessing an unusual movement and the possibility of a rise is very high
My advice is to buy

LIGHT CRUDE OIL FUTURES longThis market is witnessing an unusual movement and the possibility of a rise is very high
My advice is to buy

CL1! Time To buyafter the creation of the reversal figure '' inverse head and shoulders '' and the confirmation of the breakout of vwap and neckline we can take the buy position after the opening of the market

CL1! Time To buyafterk the creation of inverse head and shoulders and the breakout of the neckline we can take buy position


CL1! Time To buyafter the downtrend we will see an uptrend after we had a double bottom we wait for the breakout of the nickline and we can take the buy position

CL1! Time To buyafter new news and according to my analysis the CL1 market will remain in an uptrend and we will see it up to 198.80

CL1! Time To buywe can take the buy position after the confirmation of the breakout of a strong resistance

CL1! time to buy after the end of the downtrend we will see an uptrend after having an impulse from a large candle

CL1! Time To buyafter having a big breakout with a big candle at the level of the range we can take the sell position

''CL1'' we can take a buy positionafter the breakout with force of this powerful resistance we can take a buy position

Cl Towards a increase of 21% with high probabilityHello ladies and gentlemen, according to my graphical analysis of The Crude oil futures , there is a high probability of an increase towards over 119$ in the next few weeks.

Buy signal in 15min on CL !With the current geopolitical situation, oil has taken off.
During the day, I have outlined the potential levels to watch out for.
I will go in to buy if it breaks the 110.35 level with a TP of 112.10.
You have the other levels to make decisions too.

CL broke the oblique resistance - Bullish trend CL broke the oblique resistance and made the retest of trend and PP, we see the accumulation on the volume profile in the area of 89.43 and 89.67. The 90.89-91.01 area is the resistance area (rather polarity area) for CL to continue the bullish wave it needs to break it to go long with intraday and swing targets. The retest again of the support area or oblique is still an excellent opportunity to go long.
Translated with www.DeepL.com (free version)

CL1! Oil has returned to the level it left in Novembre 2014.Hello world!
According to my technicale analysis, Oil has returned back to the level it left in November 2014, which is a very strong trading range.
We can also observe that oil is reaching the top of the Uptrend channel, which means that we may see a small correction in the next few days/weeks. It can go down to the red line (which is a strong market support) in the worst cases during the current global economic situation.
Why get subbed to me on Tradingview?
* Professional chart break downs
* Supply/Demand Zones
* TD9 counts / combo review
* Key S/R levels
* No junk on my charts
* Frequent updates
* Before/after analysis
* 24/7 uptime so constant updates
🎁Please hit the like button and
🎁Leave a comment for support !
RISK DISCLAIMER:
Trading Crypto, Futures , Forex, CFDs and Stocks involves a risk of loss.
Please consider carefully if such trading is appropriate for you.
Past performance is not indicative of future results,tight stop loss.
Comment: We didn't break the "Support 1", but we had a very big rejection at that level with a big volume, which signifies a trend reversal.
However, it could be a fake rejection. As long as we are within the trading range, any decision can be risky.


Crude oil short term 29/12There are 4 signals that make you buy the oil for trading in short term:
1- Price near to MA 50 which acts as support.
2- The uptrend line shows considerable support for the price.
3- The decline lookalike a correction pattern based on Elliott wave theory making the opportunity to buy for another a rising leg.
4- The price is close to 38% fibo retracements.
%- At 15 min chart the correction wave (WXY) is about to complete at 75.12
Best price to buy from $75.2 - $75, Stoploss 74.55, the target is 77, Risk/reward ratio is 1:4
Good luck


Oil Way to SkyOn the way to Sky, clearly the current and future scenario is affecting and distorting the supply and demand for oil, less is produced, but more is required, it is desired to replace but there is still no plan B in the morning.

US OIl Inverse Head & Shoulders CL1!Inverse Head & Shoulders chart
target 84.20
Breaking through the neckline and entering support.

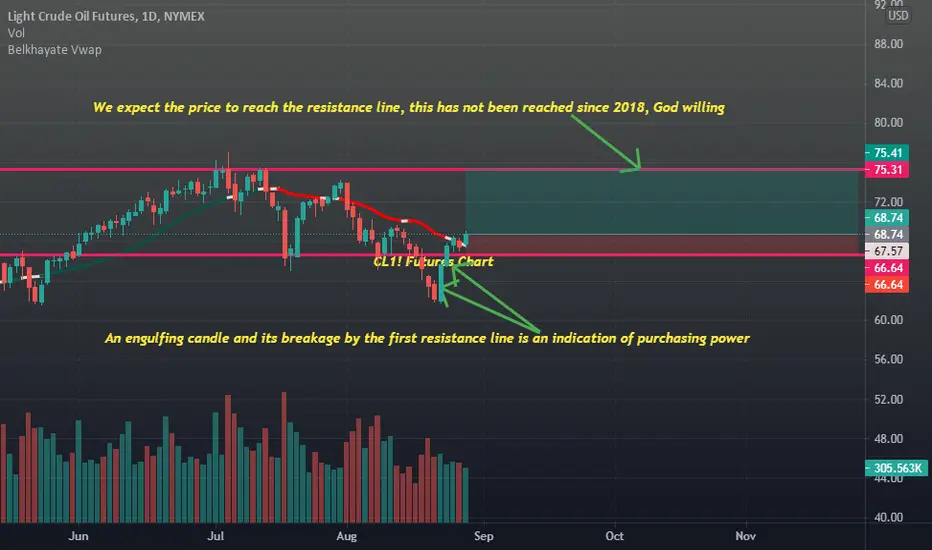
We expect the price to reach the resistance line, this has not bAn engulfing candle and its breakage by the first resistance line is an indication of purchasing power