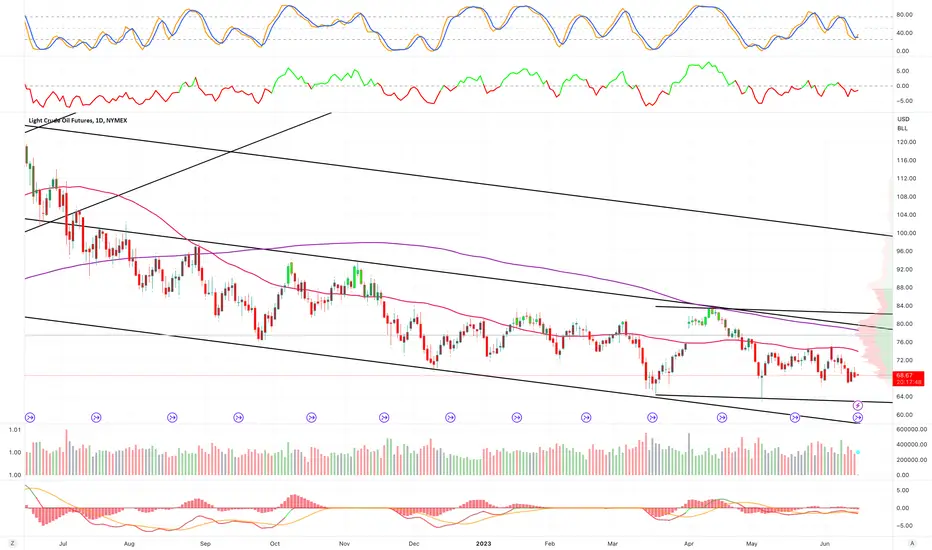
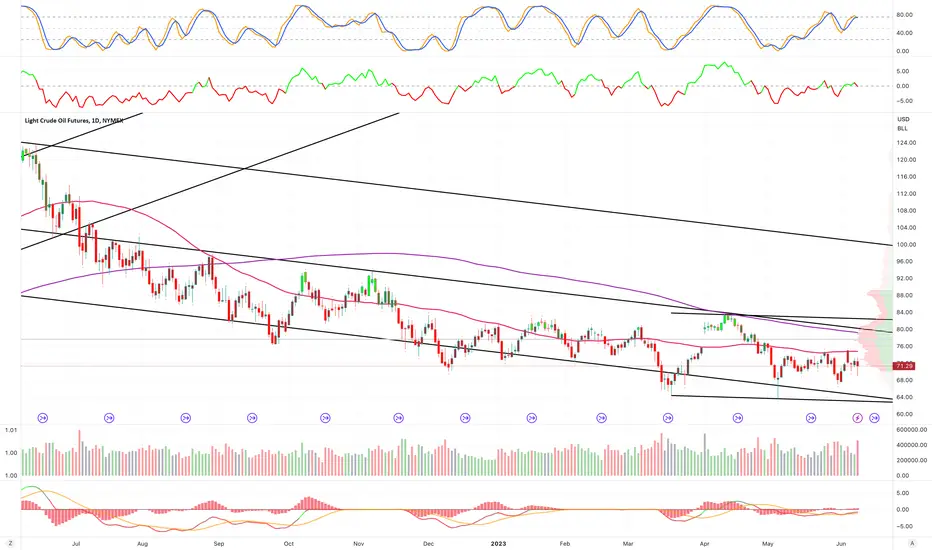
Crude Short oil make another bearish attemptThe price of crude oil is currently under bearish pressure below $70.00. No lower low printed on the daily chart yet in the previous bearish attempt. However, observing the candle close, there are more bearish candlesticks with strong momentum. It can be said that the sentiment is bearish and the bear traders have the upper hand. For now, traders should watch price developments by observing new higher high or lower low.
Today’s critical level to watch:
Support: $70.00, $65.00
Resistance: $77.13, $80.00, $85.00
WTI crude futures extended losses to nearly 5% to below $67 per barrel on Monday, the lowest in over five weeks, as concerns about weakening demand in top consumer China and rising Russian crude supply outweighed Saudi Arabia's plans to slash output. Russian oil exports to China and India rose to record levels in May even after the implementation of the European Union’s embargo and the Group of Seven’s price cap mechanism that started in early December. On the other hand, Saudi Arabia, the world's largest oil exporter, announced earlier this month its intention to reduce output by 1 million barrels per day to 9 million bpd in July, the lowest level in years amid an effort to bolster crude prices. Meanwhile, investors are cautious ahead of a busy week ahead with the US inflation rate and interest rate decisions from the Federal Reserve, the ECB and the BoJ.
WTI crude oil is trending lower inside a newly-formed falling channel on its hourly time frame. Price just broke through the mid-channel area of interest and is setting its sights on support around $68 per barrel.
Commodities like crude oil are currently being weighed down by dollar strength, as traders appear to be pricing in another Fed interest rate hike during the FOMC statement this week.
Prior to that, the US CPI is up for release, and a strong headline figure might be enough to ramp up hopes for a 0.25% increase in borrowing costs. Recall that the May NFP reading also beat estimates again, so the US central bank has some room to tighten.
Meanwhile, crude oil could also take cues from the API and EIA inventory numbers, as another draw in stockpiles might mean upside for the commodity. A build, on the other hand, might suggest that purchases are slow or that supply remains elevated.
Still, keep in mind that the OPEC+ announced voluntary output cuts, which could translate to lower global supply levels.
However, technical indicators are suggesting that a bounce is due soon. For one, the 100 SMA is above the 200 SMA to show that bullish pressure is present and that support is more likely to hold than to break. Then again, crude oil is trading below both indicators, so these could hold as dynamic resistance levels on rallies.
Stochastic has been reflecting oversold conditions for quite some time, so turning higher would mean a return in bullish pressure. The oscillator has plenty of room to climb before reaching the overbought zone, so buyers could stay in control for a while.
RSI has also been lingering around the oversold area for a while, so a return in upside momentum might be due soon.
US Inflation Rate Seen Falling to 4.1%
The annual inflation rate in the US likely fell to 4.1% in May 2023, the lowest since March 2021, from 4.9% in April and 5% in March, mainly due to lower energy prices. On a monthly basis, the CPI is projected to increase by 0.2%, easing from a 0.4% rise in April. Meanwhile, core inflation is expected to decrease to 5.3% from 5.5%, with the monthly rate projected to remain at 0.4%, the same as in April. The upcoming data precedes the Federal Reserve's interest rate decision on Wednesday and is expected to strengthen the case for a pause in its tightening cycle.
The annual inflation rate in the US likely fell to 4.1% in May 2023, the lowest since March 2021, from 4.9% in April and 5% in March, mainly due to lower energy prices. On a monthly basis, the CPI is projected to increase by 0.2%, easing from a 0.4% rise in April. Meanwhile, core inflation is expected to decrease to 5.3% from 5.5%, with the monthly rate projected to remain at 0.4%, the same as in April. The upcoming data precedes the Federal Reserve's interest rate decision on Wednesday
and is expected to strengthen the case for a pause in its tightening cycle.
European Natural Gas Down after Last Week's Rally
Natural gas futures in Europe fell more than 6% below €30 per megawatt-hour, on some profit-taking after last week's 35% rally as investors weigh lower supplies against ample gas storage levels and weaker demand. Gas shipments from the US are becoming scarcer as the supply is funneled to Asia, where prices are more competitive in the summer months due to stronger demand for cooling. Meanwhile, Norway's Equinor has postponed the restart of its Hammerfest LNG plant to June 14 due to technical difficulties. Additionally, the Turkstream gas pipeline, which transports gas from Russia through the Black Sea to Turkey, has been closed for maintenance work. Currently, Europe's gas storage is 70.4% full, and the European Union aims to achieve a storage inventory target of 90% by November 1.
Brent crude futures fell below $74 per barrel on Monday, as concerns about weakening demand in top consumer China and rising Russian crude supply outweighed Saudi Arabia's plans to slash output. Russian oil exports to China and India rose to record levels in May even after the implementation of the European Union’s embargo and the Group of Seven’s price cap mechanism that started in early December. On the other hand, Saudi Arabia, the world's largest oil exporter, announced earlier this month its intention to reduce output by 1 million barrels per day to 9 million bpd in July, the lowest level in years amid an effort to bolster crude prices. Meanwhile, investors are cautious ahead of a busy week ahead with the US inflation rate and interest rate decisions from the Federal Reserve, the ECB and the BoJ.
Cl1

WTI Light Sweet Crude Oil, 6/16/23For Friday, 68.29 can contain selling into later next week, above which 76.70 is attainable over the next 2 - 3 weeks.
Upside Friday, pushing/opening above 71.30 allows 74.77, likely to contain session strength, and the point to settle above for yielding 76.70 within several more days, able to contain weekly buying pressures when tested.
Downside Friday, breaking/opening below 68.29 allow 67.16, also able to contain selling into later next week and the point to settle below for clearly indicating 62.14 as a 1 - 2 week target able to contain broader market selling into later summer

Day Trade Market Condition jun 15, 2023Day Trade Market Condition jun 15, 2023
levels for NQ ES CL BTC
watch the table left side for trade, right side for trend

WTI Light Sweet Crude Oil, 6/15/23For Thursday, 69.12 can contain buying through the balance of the week, possibly resulting in 62.14 over the next several weeks.
On that score, a settlement today below 67.16 would affirm 62.14 as a 1 - 2 week target able to contain broader market selling into later summer.
Upside Thursday, pushing/opening above 69.12 allows 71.51, while closing today above 69.12 allows 76.59 over the next 2 - 3 weeks, able to contain weekly buying pressures when tested and the region to settle above for signaling 81.85 long-term resistance within several more weeks.
Day Trade Market Condition jun 14, 2023 FOMCDay Trade Market Condition jun 14, 2023
levels for NQ ES CL BTC
watch the table left side for trade, right side for trend
NQ/ES trapping long (i could be wrong), in case nq/es trade under 15074/4412 showing DROP possible target NQ 14800 / ES 4360
FOMC 2PM est

WTI Light Sweet Crude Oil, 6/14/23For Wednesday, 69.95 can contain buying through the balance of the week, possibly resulting and 62.14 over the next several weeks.
On that score, a settlement today below 67.16 what a firm 62.14 as a 1 - 2 week target able to contain broader market selling into later summer.
Upside Wednesday, pushing/opening above 69.95 allows 71.73, while closing today above 69.95 allows 76.48 over the next 2 - 3 weeks, able to contain weekly buying pressures when tested and the region to settle above for signaling 81.85 long-term resistance within several more weeks.

#OIL #OOTT UpdateI think I just decoded the oil chart. I have been contemplating a rise to $90+ because I expected ABC flat where I now see WXY combination of zigzag, zigzag and triangle. The chart now perfectly aligns with Brent where wave [ B] did make lowest low presumably shaping a symmetrical triangle whereas WTI is working on a running triangle.
That means that we have only strong push left upwards from current low which should come either as a straight impulse or an expanding diagonal which will be extremely annoying.

Day Trade Market Condition jun 13, 2023Day Trade Market Condition jun 13, 2023
levels for NQ ES CL BTC
watch the table left side for trade, right side for trend

Crude Oil (WTI): Time to Buy!!! 🛢️
Crude Oil reached a key daily structure support.
Approaching that, the price formed an ascending triangle formation on 1H time frame.
Its neckline has just been broken.
I expect a pullback.
Goals: 68.6 / 69.4
❤️Please, support my work with like, thank you!❤️

WTI Light Sweet Crude Oil, 6/13/23For Tuesday, 68.70 can contain buying into later week, below which 62.14 remains a 2 - 3 week target.
Downside, 65.17 able to contain daily selling pressures, while closing below 65.17 indicates 62.14 within 3 - 5 days where the market can bottom out through summer activity.
Upside Tuesday, closing back above 68.70 allows 71.94 within 3 - 5 days, able to contain buying through the balance of the week.
A settlement above 71.94 indicates 77.56 within 3 - 5 days, able to contain weekly buying pressures when tested and the point to settle above for then indicating 81.44 long-term resistance within 2 - 3 more weeks.

Day Trade Market Condition jun 12, 2023Day Trade Market Condition jun 12, 2023
levels for NQ ES CL BTC
watch the table left side for trade, right side for trend
update to september contract for nq/es

#OIL #OOTT UpdateI probably sound desperate as I keep drawing lines into the sky. However, I am still convinced that we are in a first correction of a bull move that will run until the end of summer or something. The count has got simple and more aggressive now without stops until 80+. Ok, now you can call me a dreamer.

#Gasoil UpdateSimilar to WTI, I expect gasoil prices to take off almost immediately and through the roof.

WTI Light Sweet Crude Oil, 6/12/23A two-sided framework continues through summer between 62.14 long-term support, and 82.45 long-term resistance, both regions able to contain seasonal activity.
Downside, a weekly settlement below 62.14 indicates 53.87 within several months, longer term Fibonacci support able to contain selling into later year.
Upside, a weekly settlement above 82.45 indicates 94.67 within several months, able to contain buying on an annual basis.
-
For Monday, 72.16 can contain buying into later week, below which 68.52 remains a 3 - 5 day target able to contain selling over the same time horizon.
A daily settlement below 68.52 indicates 62.14 over the next 2 - 3 weeks, where the market can bottom out through summer activity.
Upside Monday, closing above 72.16 indicates 77.56 within 3 - 5 days, able to contain weekly buying pressures when tested and the point to settle above for then indicating 81.44 long-term resistance within 2 - 3 more weeks.

#Gasoil Update Gasoil Elliott Wave story is less controversial than Crude Oil story . The price rests on Moving Averages support and Gasoil crack appears to be on an upward trend too. This suggests that refinery margins are likely to improve.
In practice, this means that Gasoil prices are likely to grow faster than Oil prices, perhaps due to unsatisfied demand for diesel fuel.
What I also dislike a bit here is that wave (ii) seems a bit too complicated, being a combination of flat w, simple zigzag x and another simple zigzag y. I was taught that although possible such combinations are rare and shall be used only labeling in retrospective when no other alternatives fit. Now it is part of the ongoing trade and if I am proven wrong I will have to stricten my rules about this combination.

#Oil #OOTT UpdateWow oil has been very tough lately. Many times I jumped the gun with long calls. I am actually bearish into the end of 2023. The reason I am so stubborn to pick the local bottom is that my charts just do not make sense without this last big jump to 90-100 range that I expect any time soon.
The chart is a complete meat grinder. The price is actually trading under moving averages on many timeframes and sending me bearish technical signals. There are bearish candles and engulfings all over the chart. It is only the Elliott Wave count that keeps me bullish since I cannot see an alternative that could continue the downtrend.
However, I am running out of bullish counts as well. The leading diagonal is very risky bet without having it fully formed. However, besides Elliott Wave count there are emerging signs in support of bullish case. See the falling trendline that the price broke through and now retesting from above in a good bye kiss? Gasoil chart looks more pointed upwards trading above moving averages. And gasoil crack has made a bottom and is recovering (will post as an update to this chart).

#USOIL #OOTT UpdateI had to delete the previous chart as the price quickly knocked out my previous idea )). Nevertherless, I think wave [ x] just finished (A)(B)(C) flat and the price is ready for rallying again.

USOIL UpdateAll right, seems like the oil is tightly following the scenario with a leading diagonal. So far, I see no alternative options at this moment other than wave can complicated further and make another dip. Once low is in the trendline 0- shall not be violated by (B) low in the next (A)(B)(C) zigzag.

Day Trade Market Condition jun 09, 2023Day Trade Market Condition jun 09, 2023
levels for NQ ES CL BTC
watch the table left side for trade, right side for trend

WTI Light Sweet Crude Oil, 6/9/23For Friday, 72.37 can contain buying later next week, below which 68.34 remains a 3 - 5 day target able to contain selling over the same time horizon.
A daily settlement below 68.34 indicates 62.14 over the next 2 - 3 weeks, where the market can bottom out through summer activity.
Upside Friday, closing above 72.37 indicates 77.56 within 3 - 5 days, able to contain weekly buying pressures when tested and the point to settle above for then indicating 82.18 long-term resistance within 2 - 3 weeks.
GASOIL UpdateWith today's vicious dip, Gasoil invalidated many alternative scenarios, and I am inclined to see a bullish trend accelerating.

Day Trade Market Condition jun 08, 2023Day Trade Market Condition jun 08, 2023
levels for NQ ES CL BTC
watch the table left side for trade, right side for trend

#OIL UpdateWith this flash crash, presumably caused by US-Iran news about a possible swap of nuclear program for oil sanctions , we're back to the scenario where wave [ 2] is already complete and we're in a leading diagonal formation. The nefarious option of an expanding diagonal remains, but it is less likely.
