Day Trade Market Condition apr 03, 2023this is apr 03, 2023 levels for NQ ES CL BTC
watch the table left side for trade, right side for trend
Cl1

Just a Bounce?Clearly the support has held and a bounce is occurring due to news on oil production cuts over the weekend.
Now we just have to see if price action results in a CHANGE OF BEHAVIOUR to usher in a potential long-term price reversal. As it stands, the downtrend remains in tact.

MONTHLY CHART CRUDE OIL ELLIOT WAVE ANALYSISMy take on crude oil monthly wave structure.
Working on the idea of classic motive pattern to the upside to complete wave I of (V).
What do you think?

Day Trade Market Condition mar 31, 2023this is mar 31, 2023 levels for NQ ES CL BTC
watch the table left side for trade, right side for trend

Day Trade Market Condition mar 30, 2023this is mar 30, 2023 levels for NQ ES CL BTC
watch the table left side for trade, right side for trend

WTI CRUDE OIL: One High left before new selling pressure.The WTI Crude Oil is being currently rejected on the 4H MA200 but with 4H technicals naturally bullish still (RSI = 61.154, MACD = 1.320, ADX = 61.771). This is due to the strong 9 day rally since the price made a bottom on the LL trendline of the Channel Down of December.
The 4H RSI also got rejected on the 70.000 overbought level and 5 times out of 6 within this Channel Down, this was an indication that we are either at the top or the last High before the top (LH trendline of the Channel Down). The last three tops were priced on the 1D MA100. We give slightly higher probabilities of this happening again. Sell this and TP = 67.00 (S1).
Prior idea:
## If you like our free content follow our profile to get more daily ideas. ##
## Comments and likes are greatly appreciated. ##

Day Trade Market Condition mar 29, 2023this is mar 29, 2023 levels for NQ ES CL BTC
watch the table left side for trade, right side for trend

Crude Oil H1 Correction Completing, To Fade Above 74.00In this update we review the recent price action in #crudeoil futures contract and identify the next high probability trading opportunity and price objectives to target

USO (CRUDE) Bullish Bounce... something is up!Previously, it was observed and expected that Crude was to bounce. Instead, Crude made a dive down and out of the boxed range. For a moment, took a second take on the analysis and decided that it might have been a bit before its time, since the longer term pointed to two trends; crude to go up and USD to go down.
So, a chance came when USO triggered twice in the 15min chart ( system alerts set based on 15min intraday chart as a personal standard ).
It was a calculated risk and probability count.
USO/Crude had oversold, bounced off a couple of times, and broke our of a short term trend line. The Daily chart had a range breakdown, followed by long tails for the previous three days. It appeared to have a good probability of recovering.
A position was taken (USO 50 delta Call).
From there, we can observe the volatility (and hence you prefer to be in earlier and smaller position) and the development of the trade in the daily chart shows the opening of gap ups and closing of gap downs.
Furthermore, USO / Crude broke back into the range. And for such failures that recover and break back into range (orange and/or yellow box), there is a high probability of breaking out the other end. And yet other observations have the Fibonacci retracement bounce off the 50% to project a near term target of about 65.68 (150%).
All these are encouraged by the previous day's candlestick as Monday's candle gapped up and closed a previous gap down, and ended the day very near to intraday high. Daily technical indicators (MACD and VolDiv) have crossed over and are starting a bullish alignment.(Noted that the breakdown out of the range did have a VolDiv bullish divergence that was very obvious, an early suggesting that it was going to bounce and recover.
Going forward, USO is starting to be overbought, and a possible pullback to head up further to near term target is expected. Could be more bullish or otherwise more bearish. but am expecting the range support to hold better this time.

Day Trade Market Condition mar 28, 2023this is mar 28, 2023 levels for NQ ES CL BTC
watch the table left side for trade, right side for trend


Day Trade Market Condition mar 27, 2023this is mar 27, 2023 levels for NQ ES CL BTC
watch the table left side for trade, right side for trend

Oil harmonic BATOIL needs a close above $82.70 to activate target at $93, slight possibility for a retest entry at $77.

Day Trade Market Condition mar 24, 2023this is mar 24, 2023 levels for NQ ES CL BTC
watch the table left side for trade, right side for trend

A potential long scenario for CL/ USOCL took out the 66.1 low, got a nice reaction and made a market structure change on the Daily.
If the Weekly can close back above the previous year low at 70$, I think its got potential for some nice upside.

Day Trade Market Condition mar 23, 2023this is mar 23, 2023 levels for NQ ES CL BTC
watch the table left side for trade, right side for trend

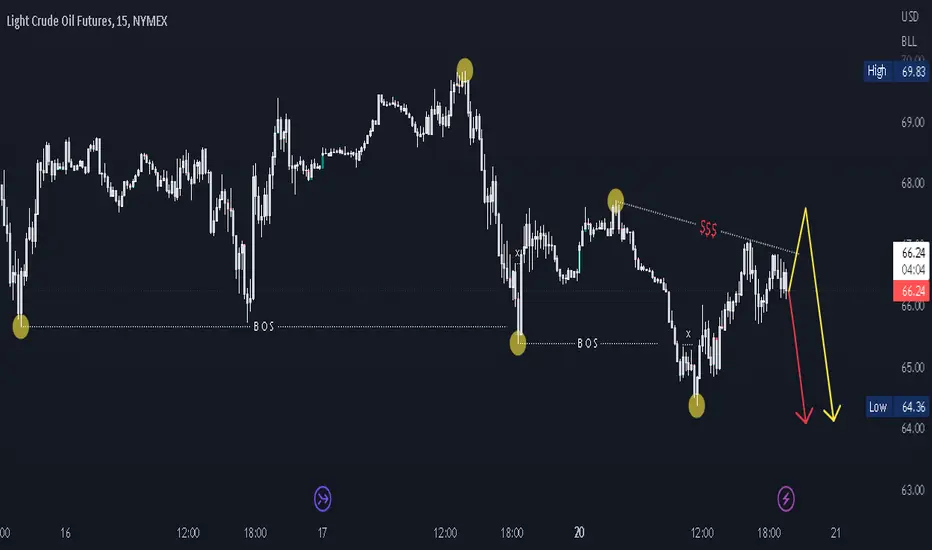
CL1 CRUDE OILHey traders, here is the analysi.
If you guys like my analysis please hit like👍 and follow.
Thanks.
DISCLAIMER- This is not financial advice.
SMART MONEY CONCEPT.
identify Liquidity Or Become Liquidity.

Day Trade Market Condition mar 22, 2023this is mar 22, 2023 levels for NQ ES CL BTC
watch the table left side for trade, right side for trend
FOMC, have a great trading day

CL1 SELLWelcome . The oil market is in a negative state. After breaking the bullish flag. We are just waiting for a retest of the downtrend. To further go down to level 76
Note: If you like this analysis, please give your opinion on it. in the comments. I will be happy to share ideas. Like and click to get free content. Thank you

Day Trade Market Condition mar 21, 2023this is mar 21, 2023 levels for NQ ES CL BTC
watch the table left side for trade, right side for trend

WTI OIL Inverse Head and Shoulders cementing the bottom.WTI Oil (USOIL) is forming an Inverse Head and Shoulders (IH&S) pattern on the 4H time-frame, which is a technical bottom and bullish reversal formation. The 4H RSI is on a Higher Lows trend-line, indicating an uptrend and already above the 50.00 neutral mark. One last pull-back to the 65.70 Symmetrical Support is possible, before a strong rally targeting the 1D MA50 (blue trend-line). Our target is 74.50.
This is an update to our last week analysis:
-------------------------------------------------------------------------------
** Please LIKE 👍, FOLLOW ✅, SHARE 🙌 and COMMENT ✍ if you enjoy this idea! Also share your ideas and charts in the comments section below! **
-------------------------------------------------------------------------------
💸💸💸💸💸💸
👇 👇 👇 👇 👇 👇

Crude Oil The Set Up For A $60 TestIn this update we review the recent price action in the Crude Oil futures contract and identify the next high probability trading opportunity #crudeoil

CL1 CRUDE OILHey traders, here is the analysi. If you guys like my analysis please hit like👍 and follow. Thanks. DISCLAIMER- This is not financial advice. SMART MONEY CONCEPT