Natural Gas | Oil | Dollar | Silver | Gold Price ForecastNatural Gas | Oil | Dollar | Silver | Gold Price Forecast
NYMEX:NG1! CAPITALCOM:NATURALGAS COMEX:GC1! COMEX:SI1!
Cl1

WTI OIL Buy and sell levels within its Channel Down.WTI Oil (USOIL) has been trading within a Channel Down pattern on the 1D time-frame. The price is now rising having priced its most recent technical Lower Low. Every Lower High rejection happened either on or above the 1D MA200 (orange trend-line).
With the current rebound looking similar to September - October 2024, we expect a 0.786 Fib and 1D MA200 test at $68.50 (buy) and then reversal to a minimum -17.30% decline to $57.00 (sell).
-------------------------------------------------------------------------------
** Please LIKE 👍, FOLLOW ✅, SHARE 🙌 and COMMENT ✍ if you enjoy this idea! Also share your ideas and charts in the comments section below! This is best way to keep it relevant, support us, keep the content here free and allow the idea to reach as many people as possible. **
-------------------------------------------------------------------------------
Disclosure: I am part of Trade Nation's Influencer program and receive a monthly fee for using their TradingView charts in my analysis.
💸💸💸💸💸💸
👇 👇 👇 👇 👇 👇

NQ Outlook for CPI week. CME_MINI:NQ1!
Expecting massive meltdown on Indexes. But need more data to confirm. Neutral at this point. Waiting for more prints.
Gun to my head, I want all out meltdown right from Monday after tagging Monthly FVG C.E

WTI CRUDE OIL: Short term rebound on RSI Bullish DivergenceWTI Crude Oil is bearish on its 1D technical outlook (RSI = 38.958, MACD = -2.110, ADX = 28.985) as it remains on a multi-month Low. The 1D RSI however displays a HL Bullish Divergence and this can cause a short term price rebound. The Resistance is the Pivot Zone and short term the LH trendline is what maintains the downtrend. Consequently, we are now bullish, TP = 64.90.
## If you like our free content follow our profile to get more daily ideas. ##
## Comments and likes are greatly appreciated. ##

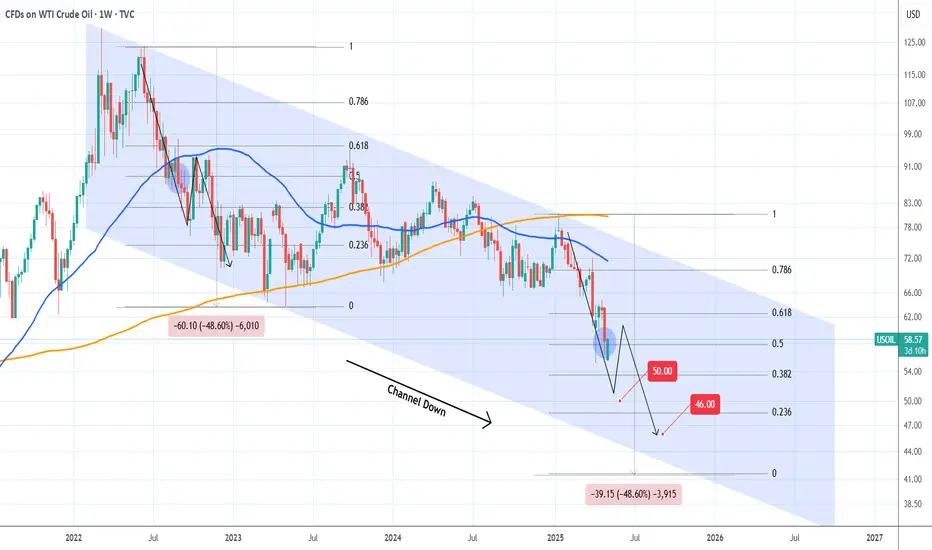
WTI OIL May be closer to $50 and below than a recovery.WTI Oil (USOIL) is having a strong green 1W candle but remains on a strong selling sequence since the January 13 2025 rejection on its 1W MA200 (orange trend-line). So far this is technically the Bearish Leg of the Channel Down that started after the March 07 2022 market top.
The Bearish Leg that was initiated then, declined by -48.60% so if the current one repeats this we are looking at prices close to $41 by the end of the year or beginning of 2026. Technically, as long as the 1W MA50 (blue trend-line) holds, the immediate Targets within a 3-month horizon are $50 and $46.
-------------------------------------------------------------------------------
** Please LIKE 👍, FOLLOW ✅, SHARE 🙌 and COMMENT ✍ if you enjoy this idea! Also share your ideas and charts in the comments section below! This is best way to keep it relevant, support us, keep the content here free and allow the idea to reach as many people as possible. **
-------------------------------------------------------------------------------
💸💸💸💸💸💸
👇 👇 👇 👇 👇 👇
WTI Crude oil Holds Support Despite OPEC Production IncreaseWTI crude was on the ropes Monday morning following another surprise production increase from OPEC+. Yet despite the weak start to the week, oil prices held above the April low despite the bearish headlines.
Given we've already seen a -15% decline over the prior eight days and a bullish divergence has formed, I suspect some bullish mean reversion is due. Bulls could seek a move to the $60 area, near the April VPOC. Note that the December 2023 low might also provide some resistance along the way.
Matt Simpson, Market Analyst at City Index and Forex.com

WTI OIL Bearish Cross confirming more selling ahead.WTI Oil (USOIL) has been trading within a Channel Down pattern since the December 06 2024 Low. The last Bearish Leg started on a 1D MA200 (orange trend-line) rejection and was confirmed with a 1D MACD Bearish Cross 3 days after.
At the moment we have had a 1D MA50 (blue trend-line) rejection and today we will complete a new 1D MACD Bearish Cross. As a result, we almost have a new sell confirmation. Once completed, sell and target $53.50 (-19% from the point of the rejection).
-------------------------------------------------------------------------------
** Please LIKE 👍, FOLLOW ✅, SHARE 🙌 and COMMENT ✍ if you enjoy this idea! Also share your ideas and charts in the comments section below! This is best way to keep it relevant, support us, keep the content here free and allow the idea to reach as many people as possible. **
-------------------------------------------------------------------------------
Disclosure: I am part of Trade Nation's Influencer program and receive a monthly fee for using their TradingView charts in my analysis.
💸💸💸💸💸💸
👇 👇 👇 👇 👇 👇

WTI CRUDE OIL: Buy signal at the bottom of the Channel Up.WTI Crude Oil turned bearish on its 1D technical outlook (RSI = 42.387, MACD = -1.000, ADX = 27.186) as it crossed under the 4H MA50. Still, it hit and is so far contained at the bottom of the Channel Up, which makes it a strong short term buy opportunity. Aim for the 4H MA200 (TP = 65.00).
## If you like our free content follow our profile to get more daily ideas. ##
## Comments and likes are greatly appreciated. ##

Potential Decline of Brent Oil Price to $50 in the Near Future.Brief Overview of Events and News Explaining the Potential Decline of Brent Oil Price to $50 in the Near Future.
➖ Increased OPEC+ Production:
On April 3, 2025, eight OPEC+ countries unexpectedly decided to accelerate production increases, adding 411,000 barrels per day starting in May. This decision triggered a price drop, with Brent falling 6.42% to $70.14 per barrel at the time.
Analysts like Amrita Sen from Energy Aspects noted that this move pressures “lagging” countries to meet quotas, but the market interpreted it as an oversupply signal.
Source: OilPrice.com, "OPEC+ to Raise Oil Production by More Than Expected in May," April 3, 2025 (oilprice.com)
➖ Decreased Demand Due to Economic Challenges:
On April 14, 2025, OPEC revised its 2025 oil demand growth forecast downward by 150,000 barrels per day to 1.3 million barrels per day, citing trade tensions and weak economic indicators. JPMorgan also raised the likelihood of a global recession to 60%.
Source: OilPrice.com, "OPEC Lowers 2025 Oil Demand Forecast on Trade Tensions," April 14, 2025 (oilprice.com)
➖ Trade Tariffs and Global Instability:
On April 3, 2025, U.S. President Donald Trump announced new tariffs on trading partners, heightening recession fears. Fitch Ratings described this as the highest level of U.S. import tariffs since 1910. Brent dropped 4% immediately following the announcement.
Source: OilPrice.com, "OPEC+ to Raise Oil Production by More Than Expected in May," April 3, 2025 (oilprice.com)
➖ Geopolitical De-escalation:
On April 25, 2025, reports emerged of progress in U.S.-Russia talks on Ukraine, as well as Iran’s openness to nuclear negotiations. This reduces geopolitical risks and increases the likelihood of higher oil supply on the market.
Source: OilPrice.com, "Oil Set For Weekly Loss on OPEC+ Supply Rumors," April 25, 2025 (oilprice.com)
Technical Analysis Section:
The monthly chart shows similarities between the 1999–2002 and 2020–2025 periods: an initial impulse, followed by a correction, and then a 6-year upward trend.
Nearest entry point targets at the 161.8% Fibonacci level:
• $52,46
• $49,06
• $46,50
Growth Potential
Medium-term:
• $138,00
Long-term:
• $500,00
Once the price of oil UKOIL reaches $52.46, a review for the entry point will be prepared.
Charts:
•
•

Weekly Market Forecast: Buy Stocks! Sell Oil! Buy Gold!In this video, we will analyze the S&P 500, NASDAQ, DOW JONES, Oil, Gold and Silver futures, for the week of April 28 - May 2nd.
Markets are looking tradeable again.
The indices look bullish, creating +FVGs as they move higher.
Oil has corrected a bearish impulse, so it could be poised to move lower from the Daily and Weekly -FVG.
Gold took a breather last week and could move higher from the Weekly +FVG it just created.
Let's go!
Enjoy!
May profits be upon you.
Leave any questions or comments in the comment section.
I appreciate any feedback from my viewers!
Like and/or subscribe if you want more accurate analysis.
Thank you so much!
Disclaimer:
I do not provide personal investment advice and I am not a qualified licensed investment advisor.
All information found here, including any ideas, opinions, views, predictions, forecasts, commentaries, suggestions, expressed or implied herein, are for informational, entertainment or educational purposes only and should not be construed as personal investment advice. While the information provided is believed to be accurate, it may include errors or inaccuracies.
I will not and cannot be held liable for any actions you take as a result of anything you read here.
Conduct your own due diligence, or consult a licensed financial advisor or broker before making any and all investment decisions. Any investments, trades, speculations, or decisions made on the basis of any information found on this channel, expressed or implied herein, are committed at your own risk, financial or otherwise.

Buy idea on Crude Oil (CL1!)Based on :
- US10Y Leading long spike
- Commercials and Non Commercials at Extremes
- Open Interest at Extremes
- Cycles and quantitative data
- Undervalued conditions
-Demand zone

WTI OIL Oversold rebound at the bottom of 7-month Channel Down.WTI Oil (USOIL) hit last week the bottom (Lower Lows trend-line) of the 7-month Channel Down while its 1D RSI turned oversold (<30.00), the lowest it's been since March 2020 and the COVID crash.
Naturally, the price rebounded but still hasn't even tested the 1D MA50 (blue trend-line), which indicates that it remains a strong medium-term buy opportunity. With the previous Lower Low almost reaching the 0.786 Fibonacci retracement level, we expect to see at least $72.50 in the medium-term.
-------------------------------------------------------------------------------
** Please LIKE 👍, FOLLOW ✅, SHARE 🙌 and COMMENT ✍ if you enjoy this idea! Also share your ideas and charts in the comments section below! This is best way to keep it relevant, support us, keep the content here free and allow the idea to reach as many people as possible. **
-------------------------------------------------------------------------------
Disclosure: I am part of Trade Nation's Influencer program and receive a monthly fee for using their TradingView charts in my analysis.
💸💸💸💸💸💸
👇 👇 👇 👇 👇 👇

Crude Oil Is Making Hard Work of Gains into ResistanceCride oil may have recovered back above $60, but it is making hard work of it. And with resistance looming and large specs increasing short bets, perhaps a pullback due. But does that mean a break below $60 is imminent?
Matt Simpson, Market Analyst at Forex.com and City Index

Weekly Market Forecast WTI CRUDE OIL: Bearish! Wait For SellsThis forecast is for the week of April 21 - 25th.
Oil has made a classic bearish impulse down, then a corrective retracement. The natural expectation is another impulse down. The fact that price pulled back into a W -FVG allows for this bearish expectation.
Wait for a bearish break of market structure to confirm a valid sell setup... and trade accordingly. No confirmation, not trade!
Check the comments section below for updates regarding this analysis throughout the week.
Enjoy!
May profits be upon you.
Leave any questions or comments in the comment section.
I appreciate any feedback from my viewers!
Like and/or subscribe if you want more accurate analysis.
Thank you so much!
Disclaimer:
I do not provide personal investment advice and I am not a qualified licensed investment advisor.
All information found here, including any ideas, opinions, views, predictions, forecasts, commentaries, suggestions, expressed or implied herein, are for informational, entertainment or educational purposes only and should not be construed as personal investment advice. While the information provided is believed to be accurate, it may include errors or inaccuracies.
I will not and cannot be held liable for any actions you take as a result of anything you read here.
Conduct your own due diligence, or consult a licensed financial advisor or broker before making any and all investment decisions. Any investments, trades, speculations, or decisions made on the basis of any information found on this channel, expressed or implied herein, are committed at your own risk, financial or otherwise.

CRUDE OIL... Time to BUYPreviously posted and heads up...
Did not quite work immediately because of POTUS and the Trade War II/
Did a cliff dropper and now it looks about ripe for the rally, confirmation when it is above the resistances shown.
Heads up!

WTI Oil Inverse Head & Shoulders looking for a 4H MA50 break-outWTI Oil (USOIL) has formed an Inverse Head and Shoulders (IH&S) pattern, which is a technical bottom formation that signals the trend change to bullish.
So far the move is limited by the 4H MA50 (blue trend-line) which has 2 rejections already and is keeping the bullish break-out from happening.
If the market closes a candle above the 4H MA50, we will have a bullish confirmation signal. Our Target will be the 1.618 Fibonacci extension at $69.00 and not higher, because the long-term trend is limited by the wider Lower Highs trend-line of January.
-------------------------------------------------------------------------------
** Please LIKE 👍, FOLLOW ✅, SHARE 🙌 and COMMENT ✍ if you enjoy this idea! Also share your ideas and charts in the comments section below! This is best way to keep it relevant, support us, keep the content here free and allow the idea to reach as many people as possible. **
-------------------------------------------------------------------------------
Disclosure: I am part of Trade Nation's Influencer program and receive a monthly fee for using their TradingView charts in my analysis.
💸💸💸💸💸💸
👇 👇 👇 👇 👇 👇

WTI CRUDE OIL: Channel Down bottomed. Buy opportunity.WTI Crude Oil is heavily bearish on its 1D technical outlook (RSI = 38.039, MACD = -2.310, ADX = 38.046) as it is trading inside a Channel Down for more than 1 year. Last week's low has made a technical LL at the bottom of the pattern and the current consolidation indicates that this may be an attempt to initiate the new bullish wave. The 1D RSI recovered from being oversold previously and this potentially hints to a rebound over the 1D MA200. The last bullish wave crossed above the 0.618 Fibonacci marginally. Trade: long, TP = 71.00.
## If you like our free content follow our profile to get more daily ideas. ##
## Comments and likes are greatly appreciated. ##

I've Cracked the BULLISH Code in Crude Oil Using COTCrude oil is setup for longs based on fundamental conditions underlying the market place.

The quinquennial Bear Trap Update Crude Oil Futures Update on the video I posted 5 days prior , giving a heads up about the Quinquennial pivots at 55 USD .
Congrats if you took this trade as it was a big one ! Support my work with a like and any comments I welcome beneath the video .

WTI OIL Buy opportunity or more meltdown coming?WTI Oil (USOIL) has been trading within a long-term Channel Down since the September 25 2023 High and the recent Trade War sell-off helped the price drop towards the pattern's bottom (Lower Lows trend-line) much quicker.
Technically this has been a 1W MA50 (blue trend-line) rejection, previously a Lower High rejection on the 1W MA200 (orange trend-line). Notice how the 1W RSI has also been trading within a Channel Down of its own, with the indicator near its bottom as well.
Being more than -31% down (more than the -29% of the first Bearish Leg), we can technically claim that this is a solid level for a medium-term buy again. The previous Bullish Leg marginally exceeded the 0.618 Fibonacci retracement level before the Lower High. As a result, our new Target is $70.00.
-------------------------------------------------------------------------------
** Please LIKE 👍, FOLLOW ✅, SHARE 🙌 and COMMENT ✍ if you enjoy this idea! Also share your ideas and charts in the comments section below! This is best way to keep it relevant, support us, keep the content here free and allow the idea to reach as many people as possible. **
-------------------------------------------------------------------------------
Disclosure: I am part of Trade Nation's Influencer program and receive a monthly fee for using their TradingView charts in my analysis.
💸💸💸💸💸💸
👇 👇 👇 👇 👇 👇

CRUDE OIL (WTI): Important Support Clusters to Watch
On a today's live stream, we discussed potentially significant
historic supports on WTI Crude Oil to watch.
Support 1: 57.0 - 59.0 area
Support 2: 52.5 - 54.6 area
Support 3: 48.8 - 50.4 area
Support 4: 40.6 - 43.7 area
The price is currently testing a lower boundary of Support 1.
It perfectly matches with a completion point of a harmonic ABCD pattern.
It looks like we may see some pullback soon.
❤️Please, support my work with like, thank you!❤️

Oil Futures Moving into Bear Market?Oil futures recently broke down from a long-term wedge, following a failed breakout at the start of the year, and a recent death cross of its 50/200 weekly EMAs and MAs.
It looks to flip long-term bearish here unless we see a rapid recovery of the wedge, the EMAS/MAs and a subsequent breakout.
It could lose half its value or even 2/3rds if it hits TP 1 and then TP 2 over the next weeks and months to come.

WTI CRUDE OIL: Potential bottom and massive rebound to 71.00.WTI Crude Oil got oversold on its 1D technical outlook (RSI = 31.096, MACD = -1.620, ADX = 38.232) but is recovering its 1W candle now as it hit the bottom (LL) of the 1 year Channel Down. If the 1W candle makes a green closing, we will consider this a bottom, as the 1W RSI is also on its LL trendline) and go for a long aimed as the previous one at the 0.618 Fibonacci (TP = 71.00).
## If you like our free content follow our profile to get more daily ideas. ##
## Comments and likes are greatly appreciated. ##
