WTI Light Sweet Crude Oil, DAILY Market Analysis 2/10/23For Friday, 78.11 can contain buying into the next week, below which 73.58 is attainable over the next 3 - 5 days.
Downside Friday, 76.32 can contain intraday weakness, while breaking/opening below 76.32 signal 74.91, where the market can place a daily low.
A settlement below 74.91 indicate 73.58 on Monday, able to contain selling through next week.
Upside Friday, pushing/opening above 78.11 allows 81.53 intraday, while closing above 78.11 indicates 83.42 by the end of next week, the start of a wide zone of longer-term resistance up to 86.43 able to contain buying into spring trade.
Cl1
$CL1 #CL1 coming downYesterday Cl made its move back to the 61% fib level i was looking for it to hit my zone around $80 but its didnt have the juice to get there so now we going back down

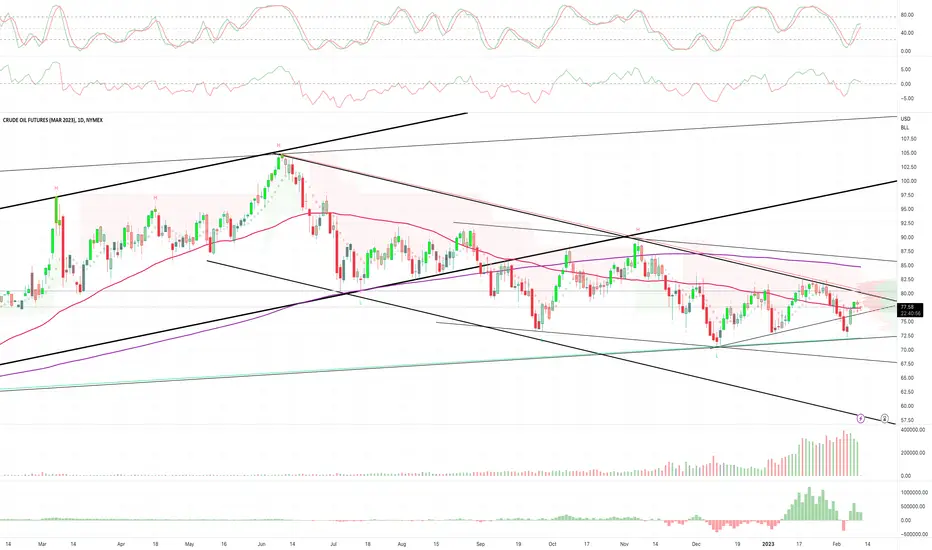
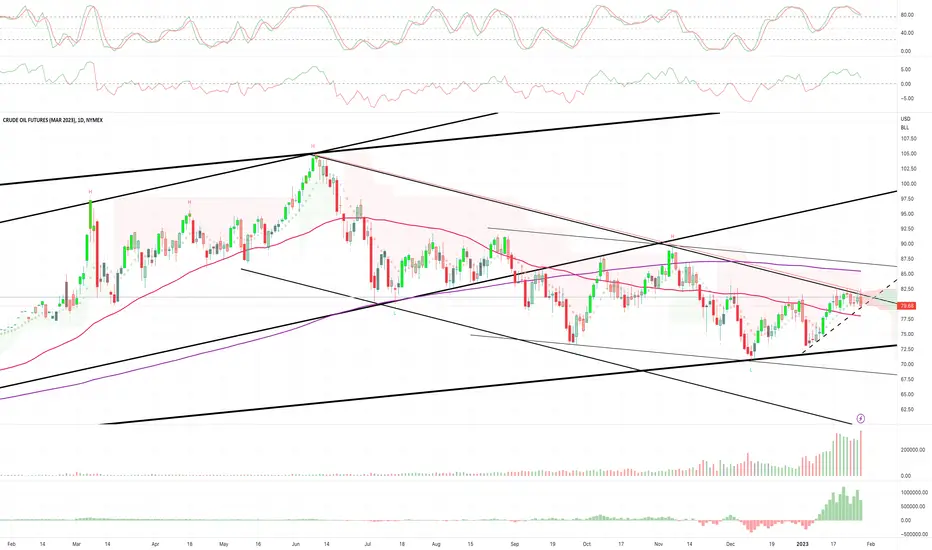
CRUDE OIL (WTI) Key Levels to Watch 🛢
Here is my latest structure analysis for WTI Crude Oil.
Support 1: 72.3 - 73.2 area
Support 2: 70.0 - 71.4 area
Resistance 1: 81.7 - 85.2 wide supply area
Consider these structure for pullback / breakout trading.
❤️Please, support my work with like, thank you!❤️

WTI Light Sweet Crude Oil, DAILY Market Analysis 2/9/23For Thursday, 78.38 can contain buying through the balance of the week, below which 74.12 is attainable over the next 3 - 5 days.
Downside Thursday, 76.30 can contain intraday weakness, while breaking/opening below 76.30 allow 74.12 - 74.81 intraday, able to contain selling through next week, and above which 83.37 is attainable over the next 2 - 3 weeks.
Upside Thursday, pushing/opening above 78.38 allows 81.53 intraday, while closing above 78.38 indicates 83.37 by the end of next week, the start of a wide zone of longer-term resistance up to 86.48 able to contain buying into spring trade.
WTI OIL: This uptrend has more fuel.As WTI Oil hit technical neutrality on the 1D time-frame (RSI = 51.471, MACD = -0.510, ADX = 37.488), it reached Pivot1 (P1) and the 4H MA200 to pause and consolidate. As with the previous two rallies, we expect this to have some more fuel left and we are aiming at the 1D MA100 (TP = 80.50) that rejected the last uptrend 3 times.
After that, our sell trigger is a break below P1, and we will aim at the top of S1 (TP = 73.50). We are not waiting for the extension to R1 but rather will wait for the HH to break (bullish trigger) and aim below R2 (TP = 87.00).
P.S. Perfect execution of our last Oil signal:
## If you like our free content follow our profile to get more daily ideas. ##
## Comments and likes are greatly appreciated. ##

CL1 on its way up $CL1! is rocking today right now its sitting at the 61.80% fib level on the 4hr chart im looking for a push up to retest my zone karound $80.00

WTI Light Sweet Crude Oil, DAILY Market Analysis 2/8/23For Wednesday, 74.70 can contain selling through next week, possibly through February trade, above which 83.33 longer-term resistance is attainable over the next 3 - 5 weeks.
Upside Wednesday, 77.46 can contain intraday strength, beyond which 78.64 is likely intraday and able to contain buying through the balance of the week, once tested the market susceptible to falling back to 74.70 within 3 - 5 days.
On the other hand, a settlement today above 78.64 should yield 83.33 within 1 - 2 weeks, the start of a wide zone of longer-term resistance up to 86.54 able to contain buying into spring trade.

WTI Light Sweet Crude Oil, DAILY Market Analysis 2/7/23For Tuesday, 74.60 can contain buying through next week, possibly through February trade, below which 68.84 long-term support remains a 1 – 2 week objective, able to contain selling through spring.
Downside Tuesday, 71.43 can contain session weakness, while closing today below 71.43 indicates the targeted 68.84 within several days, where the broader market can bottom out through spring.
Upside Tuesday, pushing/opening above 74.60 signals 75.19, able to contain session strength and an upward pivot point into later week, with a settlement above 75.19 signaling 78.91 within 3 - 5 days, where the market can top out into next week. A daily settlement above 78.91 indicates 83.55 longer-term resistance within 1 - 2 weeks.

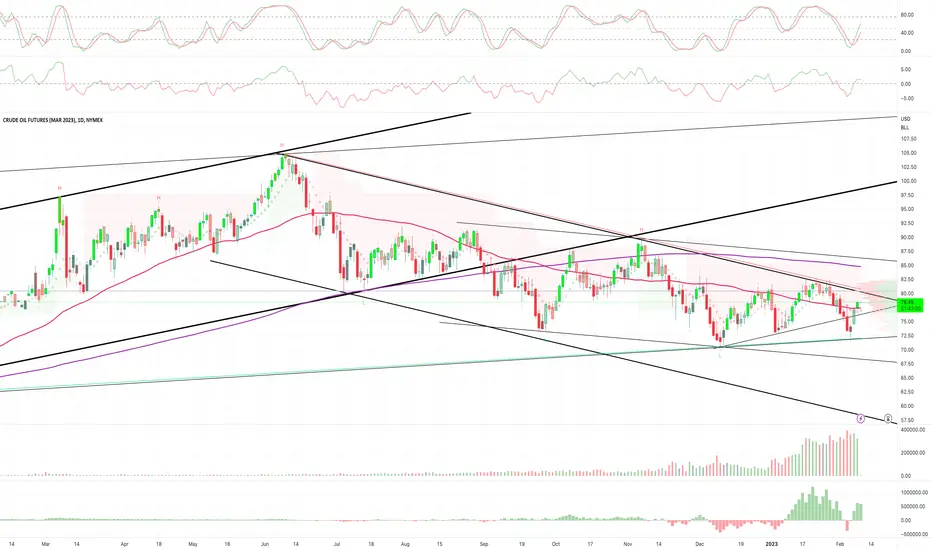
Long USOIL/Crude OilTVC:USOIL , NYMEX:CL1!
Long US Oil with possible target around 81.8 and stop loss 74.8. Risk:Reward 3.62.
Currently forming a lower high and at the bottom of the ascending Triangle. Bounced of the demand zone.

WTI Light Sweet Crude Oil, DAILY Market Analysis 2/3/23For Friday, 74.39 can contain selling through next week, possibly through February trade, once tested the narrowing 84.37 - 86.70 region attainable within 3 - 5 weeks.
Upside Friday, 77.06 can contain session strength, while closing above 77.06 indicate 79.87 within several days, where the market can top out through the balance of next week.
A daily settlement above 79.86 signals 84.37 within 3 - 5 days, the start of a narrowing zone of longer-term resistance up to 86.70 able to contain buying into spring.
Downside Friday, closing below 74.39 indicates 68.42 within 1 - 2 weeks, long-term support able to contain selling through spring.
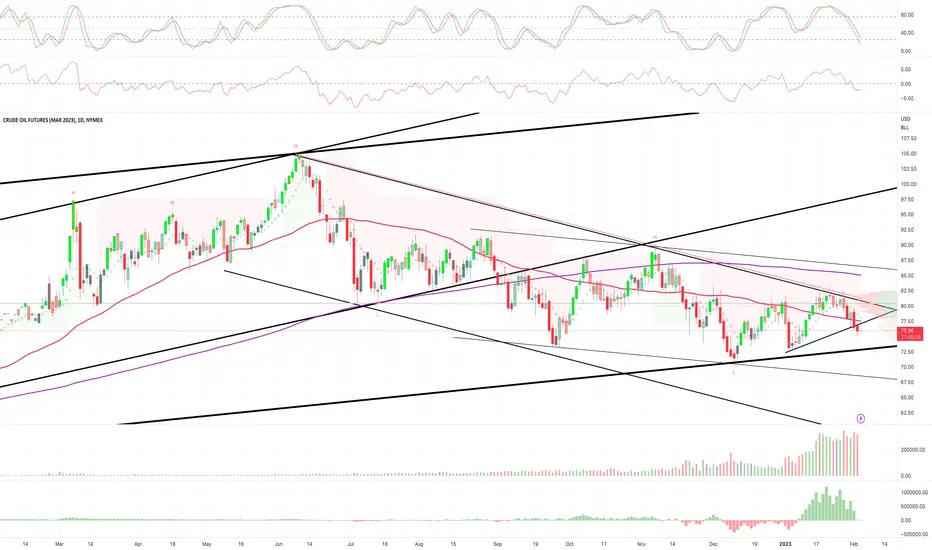
WTI Supply&Demand Swing Trade SetupWe saw price come up near the supply zone multiple times this week but fail to close above or even inside of it.
Most of my analysis is already on the charts. Do note that there is a minor demand zone around the 76.50 level, not drawn on the charts, where we may see a bounce. This could be a TP1 for some traders and I would likely move my stop near this level if price continues downward after the bounce.
This setup will likely take a week+ to play out; if it does.

Sell CL1 Crude OiL Now With high probability !Sell CL1 Crude OiL Now With high probability
The price in Crude Oil Will visite Other KEy Levels .
Tp1 is The first Take profit than You can Do Breakeven.

WTI Light Sweet Crude Oil, DAILY Market Analysis 2/2/23For Thursday, both 79.21 and 76.38 can firmly contain intraday activity, beyond which the next notable level is attainable intraday.
Downside Thursday, breaking/opening below 76.38 signals 74.29, able to contain selling through next week, once tested 84.37 attainable within several weeks.
A daily settlement below 74.29 would indicate 68.42 over the next 1 - 2 weeks, long-term support able to contain selling through spring.
Upside Thursday, pushing/opening above 79.21 allows 81.53, able to contain daily buying pressures.
Closing today above 81.53 signals 84.37 within several days, where the market can top out through next week and the beginning of a narrowing zone of longer-term resistance up to 86.75 able to contain buying into spring trade.

WTI Light Sweet Crude Oil, DAILY Market Analysis 2/1/23For Wednesday, 78.39 can contain selling through the balance of the week, above which 84.24 is attainable by the end of next week.
Upside Wednesday, 80.26 can contain intraday strength, beyond which 81.77 is likely intraday and able to contain session strength.
Closing today above 81.77 signals 84.24 within several days, able to contain buying through next week and the start of a narrowing zone of long-term resistance up to 86.80 that can absorb buying into spring trade.
Downside Wednesday, breaking/opening below 78.39 allows 76.61, while closing today below 78.39 should yield 74.19 by the end of next week, able to contain weekly selling pressures and the point to settle below for indicating 68.42 long-term support within several more weeks.

USOIL 1st FEBRUARY 2023USOIL is expected to be sideways within the ascending triangle area. The price has a possibility to reach the resistance area of the 8th touch. Breakout or rebound scenarios can occur at the touch point of the trendline, but if the price turns out to be a breakout from the support/resistance area. a big trend will likely occur. The existence of horizontal support and resistance is difficult to observe, but it is quite valid with the help of the stochastic 5 3 3 indicator where the area often rebounds.

Crude Watching For Bids At The $75.00 TestIn this update we review the recent price action in the Crude Oil futures contract and identify the next high probability trading location and price objectives to target

WTI Light Sweet Crude Oil, DAILY Market Analysis 1/31/23For Tuesday, 78.40 can contain buying through the balance of the week, below which 74.08 is likely by the end of next week, where the market can bottom out into March expiration, and from there trade higher into that timeframe.
Downside Tuesday, a daily settlement below 74.08 indicates 68.42 within several more weeks, long-term weekly chart support able to contain broader market selling through spring trade.
Upside Tuesday, pushing/opening above 78.40 allows 80.26 intraday, while closing today above 78.40 indicates a good low for the week, 82.25 then attainable within several days, 84.16 perhaps by the end of next week, able to contain weekly buying pressures when tested.

Be prepared for a hawkish-than-expected Fed this week?Happy New Year of Rabbit! We will have a busy week. In addition to companies keep reporting result (Four of the FANNG companies will report earnings this week), other major events include a decisive Fed meeting, ECB meeting, BOE meeting, US employment data and OPEC+ meeting.
Everyone’s focus will be on Fed meeting. Market fully expects a 25bp rise this week, and Fed might bow to market pressure and adapt a slower hiking pace. Having said that, the risk is Fed might signal there will be more interest rate hikes before the rate reach above 5%, rather than Fed Watch pricing in a pause at 4.75%.
There is no doubt inflation is slowing down and the decelerating pace is pretty impressive, but there is still a big gap from the 2% target. Although there was some layoff news, they mainly concentrated on the sectors/companies that expanded rapidly during pandemic and now they are just downsizing to pre-covid level. From the initial jobless claims number, we can see the labour market stayed strong that might keep service inflation elevated. On Friday’s employment report, market expects hourly earnings will grow 4.3% yoy in January and unemployment rate inch up to 3.6%, that might force Fed to hike rate more than expected.
The reopen of China economy might also pose risk to higher inflation. Cyclical commodity price such as copper and crude oil moved higher, offsetting the demand destruction concern resulted from a potential global recession. NYMEX WTI Crude Oil Futures broke the downtrend, a further breakthrough above USD82.64 might confirm a formation of uptrend, and could test USD93.64(Q4 double top high) and then USD96.97 (50% retracement). Any further expansionary fiscal policy targeting property or infrastructure sector in China, could also push the commodities price higher and thus the inflation.
The supply chain diversification will structurally push up inflation. As the world factory, supply chain in China is very mature and cost effective, any shift of production line to other countries likely associated with higher cost. Idle capacity in China, together with new investment on supply chain in different countries, will permanently push the production cost higher. Globalization helped contain inflation, and the reverse will drive it up. There is risk the inflation will hover around 4% and refuse to go down further, that might put Fed in a difficult situation and diminishing any hope there will be an interest cut this year.
ECB and BOE are expected to hike rate by 50bp this week. This might prevent Fed from being too dovish. OPEC+ will have meeting this week and no policy change is expected. However, we need to monitor the risk of escalation of geopolitical tension in Ukraine, and how Russia responds to the price cap on refined products imposed by EU and G7 from Feb 5.
Be prepared for some market volatility, and a hawkish-than-expected Fed this week. Happy Trading.
Disclaimers
Above information are for illustration only and there is no guarantee on the accuracy of the information. They should not be treated as investment recommendations or advices.
CME Real-time Market Data help identify trade set-ups and express my market views. If you have futures in your trading portfolio, check out on CME Group data plans in TradingView that suit your trading needs www.tradingview.com

WTI Light Sweet Crude Oil, DAILY Market Analysis 1/30/23In terms of the big picture, a long-term ceiling of resistance is located at 86.34, and floor support at 68.42.
At present, there is no clear indication that either will be tested unless 84.03 is violated upside, and 73.99 violated downside.
The 86.34 - 86.91 region can contain buying into spring trade, once tested the market susceptible to falling back to 68.42 within several months, where the market can bottom out into summer activity.
While a settlement above 86.91 would indicate several months bullish continuation to 103.32, able to contain annual buying pressures as well as a meaningful upside continuation point into later 2023.
-
For Monday, 78.40 can contain selling into later week, above which 84.03 is attainable within 3 - 5 days.
Upside Monday, 82.61 can contain intraday strength, beyond which 84.03 is attainable intraday, able to contain weekly buying pressures and the point to settle above for yielding 86.91 longer-term resistance within 3 - 5 more days.
Downside Monday, breaking/opening below 78.40 allows 76.61 intraday, while closing today below 78.40 signals 73.99 by the end of next week, able to contain weekly selling pressures when tested and the point to settle below for yielding 68.42 long-term support over the following 3 - 5 days.
WTI Crude Oil / CL1 - Accumulation Before Global ConflictA lot of fundamentals say that oil should be going up. A lot of Twitteratti and furus say that oil should be going up. Yet, it's not. Oil hasn't been bullish since literally June .
The only reason sentiment is still confusedly bullish like this is because WTI isn't (yet) trading like bonds.
People say that OPEC+ cutting production was some kind of battle with Washington and that the Biden Administration are doing some green energy nonsense saboteuring the country by selling off the Strategic Petroleum Reserve (SPR), because Joe Biden is senile.
That's not what's happening. Are you high? The United States is going to endanger its energy reserves while it's in a war with Russia? Don't be fooled by appearances. You need to start exercising critical thinking.
In my view, what has transpired is pretty simple:
1. The Biden Administration said they would refill the SPR at $80
2. When WTI fell to $76, instead of refilling it, they sold more of the SPR
3. They keep selling more of the SPR on this bounce at $80 and 90
4. The average price the SPR was filled at, the last time I looked, was $60
So why did OPEC+ cut production? Because they're smart money and they realized the United States is short on oil.
The U.S. and its vassals (including Canada) are by far the largest producers of oil in the world. It's their market, especially while Russia is out of the picture, and whoever makes the market sets the price.
So OPEC+ understands that oil is going down and cuts production accordingly. When the Biden Administration refills the SPR, that's the bottom, WTI will bounce hard, and OPEC will increase production again.
This is a lot of words to tell you that oil is going to make new lows, not new highs. This call that I made at the beginning of September is still definitely in play.
WTI Crude / CL - An Intervention: Saving Blind Bulls
There are some really important factors to look at in the longer timeframe charts. Consider that we're almost all the way through October and yet WTI, while it's in a bearish market shift, has not made a monthly low:
This is even more obvious on the Weekly, where a gap is revealed:
This ~$80 January gap range has now been traded extensively but has not produced the requisite re-continuation of a bull run needed, which means that lower prices are on the way.
The reason is, $120 was not the top. A big number like $180 or $220 is incoming, probably in 2023, but before then comes manipulation and accumulation, frankly speaking, probably in the $50 range.
Whether bulls want to hear that or not or want to believe that or not, that's how it goes. Not very many people believed Natural Gas was going to go from $10 to $4.9 either, but it did.
Natural Gas / NG - It's Officially a Bear. Now, Hold My Beer
The big wild card right now is actually not the conflict between the Russian Federation and NATO/Washington via Ukraine as a proxy. Even less is it whether the Federal Reserve keeps clowning around with interest rates.
Xi Jinping was just crowned leader of the notorious Chinese Communist Party for an unprecedented third term and has consolidated the Politburo with only his own people. But more concerningly, the man who should be fulfilling his historic role to collapse the CCP from within a la Gorbachev instead was quoted by ABC as having made communism and the deteriorating CCP "absolutely central to China's development and future."
This amounts to an abject disaster in Xi Jinping's life, a disaster for the Chinese people, and a disaster for the human race. If man won't do something about the problem of the Chinese Communist Party and its campaign of organ harvesting Falun Gong, then Heaven will.
The CCP may or may not attack Taiwan. That's a major wildcard in this call. Personally, I don't think the Party has enough stability while being sacked by Wuhan Pneumonia and hit by economic problems to really dare do it.
Yet, the more imminent a possible attack on Taiwan is, or the more imminent a major escalation with Russia is, the more violently the US oil market makers will dump WTI/Brent to where they want it to be so they can accumulate and refill the SPR.
How you want to trade it and what you want to do is up to you. But I believe we see a number like $89 on WTI this week and I intend to go long on bear ETFs with a target under $50 imminent by January.
Oil is something that is going to make a violent and impressive new high, but those cowboys are not going to let early money and dumb money come along for the ride particularly easily.
Be careful. Humanity has officially entered the most dangerous moment, and at a period where we're already in the proverbial "Triple Overtime."
What you believe can happen and what is actually happening, in reality, are often two different things.

Crude Oil (WTI): It Will Keep Falling! Here is Why: 🛢️
Crude Oil broke and closed below a support line of a rising wedge pattern on 4H.
Taking into consideration that the market has recently reached a solid supply area,
probabilities are high that the market will keep falling.
Goals: 78.3 / 77.4
❤️Please, support my work with like, thank you!❤️

Crude Oil (WTI): Detailed Technical Outlook 🛢️
Multiple time frame analysis on WTI Crude Oil.
Price action & key levels.
Trading recommendations & potential scenarios.
❤️Please, support this video with like and comment!❤️
