CRUDE Oil down trending again... Crude weekly points to more downside. Breaking below 76, would be bad news and 67 would be the downside target at the end of the year.
Technical indicator, MACD crossed down in bearish territory, and the VolDiv indicator turned red as it heads to the zeroline. Very dangerous when it does this...
Expect more downside to the last low at 76. Critical support level there.
Cl1

CRUDE OIL FUTURESAnalyse CRUDE OIL FUTURES.
The price in strong area.
I expect to downtrend more.
My target 76.64$.
For more details contact me.
don´t forget like and support.I will be gratful👨💻.

CRUDE OIL (WTI) Detailed Trading Plan🛢
Watch & learn my detailed trading plan on WTI Crude Oil.
Multiple time frame analysis,
stop placement and entry selection explained.
❤️If you have any questions, please, ask me in the comment section.
Please, support my work with like, thank you!❤️

WTI Light Sweet Crude Oil, DAILY Market Analysis 11/17/22For Thursday, 89.25 can contain session strength, below which 82.84 is attainable over the next several days, where the market can bottom out into next week.
A settlement today below 82.84 signals 78.36 within several days, the start of a range of meaningful support down to 76.48 able to contain selling through the balance of the year.
Upside Thursday, closing above 89.25 signals 95.06 - 95.21 within several days, where the market can top out through the balance of the year, once tested the market prone to falling back to 76.48-78.36 within 3-5 weeks.

BLUE LINE - Last Support For Crude OilIs this it? Headed into the end of 2023 - are we going to see Crude Oil fall below $76 ppb as COVID & economic concerns trap the global economy into a contraction phase?
My research suggests Crude Oil will attempt to find support near $63 to $65 before attempting to bottom. From current levels, this suggests a -$30 ppb downward price trend is likely.
Two things are likely driving this trend:
Lack of global demand
Inflation/Price concerns
Has the current Flag/Pennant reached the APEX and is price attempting to break downward?
Time will tell...
Follow my research.

CL Daily up TrendThe CL daily time frame broke the short term
down trend line and has entered into the buy
zone. The market has an up Fibonacci with an
extension price point 104.39 about +1,909 ticks
above the market. As long as the market stays
in the buy zone above the short term down trend
line. It will be a good idea to turn to the one
hour time frame and to look for low prices in the
buy zone.

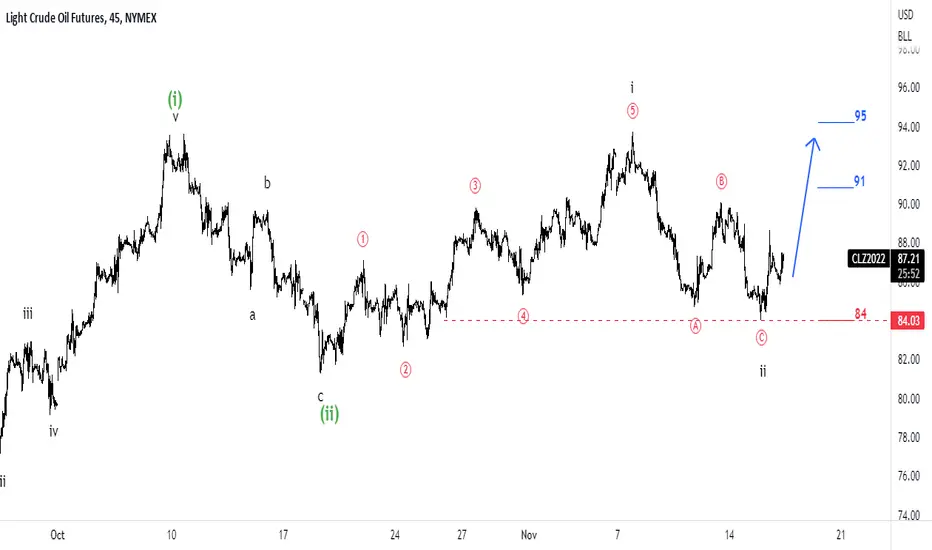
Financial Wave. CLAs long as the price of CL is above $84, the possibility of growth to $91 remains, this is a preferable scenario in this case.
WTI Light Sweet Crude Oil, DAILY Market Analysis 11/16/22For Wednesday, 89.46 can contain session strength, below which 82.77 is attainable over the next several days, where the market can bottom out into next week.
A settlement today below 82.77 signals 78.29 within several days, the start of a range of meaningful support down to 76.48 able to contain selling through the balance of the year.
Upside Wednesday, closing above 89.46 signals 95.06 - 95.35 within several days, where the market can top out through the balance of the year, once tested the market prone to falling back to 76.48-78.29 within 3-5 weeks.
On the other hand, a settlement above 95.35 indicates 103.38 within several weeks, the broader market in reach of 110.10 over the next several months.

WTI OIL: Trapped between the 1W MA50 and MA100The WTI Crude Oil has been giving the best set-up to swing traders as it has been ranging within the 1W MA50 (blue) and 1W MA100 (green) since August 31st. Great low risk high return opportunities exist within for as long as it lasts.
On the longer term, the September 26th bounce on the 1W MA100 was on the rising Support (Higher Lows) that has been in effect since March 2021. In fact even the 1W RSIhit and rebounded on its declining (Lower Lows) Support, with the previous two times (December 6th 2021 and August 23rd 2021) matching Oil's last two bottoms. The MACD needs to complete its bullish cross to confirm a new sustainable rise though, which will most likely be if Oil breaks above the 1W MA50. That would target the dashed rising Resistance (Higher Highs) that was the technical Resistance before the Ukraine/ Russia war distorted the price action.
On a different occasion, if the price breaks below the March 2021 rising Support, Oil could target the 1W MA200 (orange) for the first time since February 01 2021.
## If you like our free content follow our profile to get more daily ideas. ##
## Comments and likes are greatly appreciated. ##
## Also DONATIONS through TradingView coins help our cause of increasing the daily ideas put here for free and reach out more traders like you. ##

WTI Light Sweet Crude Oil, DAILY Market Analysis 11/15/22For Tuesday, 90.29 can contain session strength, below which 82.70 is attainable within the week, where the market can bottom out through Friday.
A settlement today below 82.70 signals 78.22 within several days, the start of a range of meaningful support down to 76.48 able to contain selling through the balance of the year.
Upside Tuesday, closing above 90.29 signals 95.06 - 95.49 within several days, able to contain buying through the balance of the year, and if settled above a bullish continuation region into January activity.

CRUDE OIL (WTI) What to Expect This Week 🛢
Multiple time frame analysis on WTI.
Price action & key levels.
Bearish bias explained.
❤️Please, support this video with like and comment!❤️

Financial Wave. CLAn upward trend is developing, the first intermediate target is $91.25. We projected a possible movement of CL on the chart. A fall below $87.30 will change our vision for CL.

OIL Weekly Forecast 14-18 November 2022OIL Weekly Forecast 14-18 November 2022
Currently the implied volatility for this asset is around 6.59%, up from 6.36% of last week.
From volatility percentile, point of view, we are currently on 66th from ATR and 66th from OVX index.
With this volatility percentile values into account we can expected on average that the weekly candle is going to be:
4.56% for bullish
5.01% for bearish
With the current IV, we can expect with a 71.0% probability that the market is not going to close either above or below the next channel:
TOP: 94.68
BOT: 83.35
Lastly, based on previous calculations, we have:
31% to hit the previous weekly high of 93.8
65% to hit the previous weekly low of 84.65

WTI Light Sweet Crude Oil, DAILY Market Analysis 11/14/22For Monday, 88.20 can contain selling into later week, above which the 95.06-95.63 region is attainable over the next 3-5 days.
Upside Monday, 90.80 can contain intraday strength, beyond which 93.24 is attainable intraday and likely to contain session strength.
A settlement above 93.24 indicates 95.06-95.63 tomorrow, able to contain buying out through December, once tested 76.48-78.15 longer-term support attainable over the same time horizon.
Downside Monday, breaking/opening below 88.20 allows 85.83 intraday, while closing today below 88.20 will keep 82.63 in reach over the next several days, able to contain selling through the balance of the week and the point to settle below for signaling 76.48-78.15 within 2-3 days.

Crude Oil (WTI) Bearish Outlook For Next Week 🛢️
Hey traders,
WTI Crude Oil broke and closed below a support line of a bearish flag pattern this week.
The price is retesting its lower boundary now.
I believe that the market will most likely drop next week.
Goal for sellers - 85.75 structure.
❤️If you have any questions, please, ask me in the comment section.
Please, support my work with like, thank you!❤️

Oil Makes Another Attempt at the $90'sOil has pivoted from lows and made another run for the $90's. We have broken through $88.74, and fallen just short of $90.06, the barrier to the $90 handle. A strong rally in risk-on assets has benefited oil. If we are able to continue the rally, we could hit $94 again. If we retrace, expect support at $87.21 or $85.55.

CRUDE OIL (WTI) Multi Time Frame Analysis & Technical Outlook 🛢
Top-down analysis on WTI Crude Oil.
Price action, key levels, potential scenarios.
Trading recommendations.
❤️If you have any questions, please, ask me in the comment section.
Please, support my work with like, thank you!❤️

WTI Light Sweet Crude Oil, DAILY Market Analysis 11/11/22For Friday, 88.34 can contain buying through next week, below which 82.56 remains a 3-5 day target, the 76.97-78.08 region expected over the next 2-3 weeks.
Downside Friday, 84.72 can contain intraday weakness, below which 82.56 is attainable intraday and able to contain selling into next week.
A daily settlement below 82.56 signals 78.08 within 2-3 days, the start of a range of targeted long-term support on the 76.97 able to contain selling into December activity.
Upside Friday, closing back above 88.49 will keep 95.77-96.36 long-term resistance in reach by the end of next week, where the market can top out through December, and a meaningful upside continuation region through the balance of the year.

OIL11. 10. 22 I wanted to use the oil daily chart To show you two bar reversals and opening price trades with small stops. I messed it up a little bit near the end of the video, but the first 15 minutes or so I will show you the gist of what I was trying to focus on. Sorry about that. Remember colon it's something to look at if you're out of sync with the market, and all that is occurring is a sequence of losing trades. This probably has something to do with your trade location. Your trade location baby problematic because you may be using oscillators for other tools that really don't have anything to do with a more precise perception of where the buyers or sellers are, and price action.

WTI Light Sweet Crude Oil, DAILY Market Analysis 11/10/22For Thursday, 88.48 can contain buying through next week, below which 82.49 remains 3-5 day target, the 76.97-78.01 region expected over the next 2-3 weeks.
Downside Thursday, 84.72 can contain intraday weakness, below which 82.49 is attainable intraday and able to contain selling through the balance of the week.
A settlement today below 82.49 signals 78.01 within 1-2 days, the start of a range of targeted long-term support on the 76.97 able to contain selling into December activity.
Upside Thursday, closing back above 88.49 will keep 95.91-96.36 long-term resistance in reach by the end of next week, where the market can top out through December, and a meaningful upside continuation region into later year.

Oil Falls from the $90's!Oil has fallen from the $90's after the rejection from $94 has taken the $90 handle entirely. We fell back to the high $80's, with $87.21 providing support, exactly as we predicted in these reports. Our floor for oil for now, is $85.55. The Kovach OBV is still surprisingly strong, though it has arched over a bit with the selloff. If we can pivot off current levels, then $90.06 is the next target.

WTI Light Sweet Crude Oil, DAILY Market Analysis 11/9/22For Wednesday, 88.62 can contain weekly selling pressures, above which 96.05-96.36 is expected within 3-5 days a range of longer-term resistance able to contain buying through the balance of the year, once tested 76.97 attainable over that time horizon.
On the other hand, a settlement today above 96.36 indicates 99.92 within the week, while a weekly settlement Friday above 96.36 would signal 110.72 by the end of the year, where the broader market can top out into next spring.
Downside Wednesday, breaking/opening below 88.62 allows 85.53, while closing below 88.62 indicates a good weekly high, 82.42 then likely within several days, 76.97 attainable by the end of November.

Oil Maintains the $90'sOil topped out around $94 after breaking through our target at $92.03. We made a concerted effort for our next target at $95.24, but fell short just below $94. This was a high from the last attempt in early October, and may constitute a double top. We are not seeing a serious retracement, and are still holding the $90's. In order to press higher, we must break through $94 definitively. If support in the $90's does not hold, then $87.21 will likely be a floor price for now.
