CRUDE OIL (WTI) Detailed Technical Outlook 🛢
Price action analysis for Oil
Key levels and important structures to watch.
Bearish outlook explained.
❤️If you have any questions, please, ask me in the comment section.
Please, support my work with like, thank you!❤️
Cl1

New Relative Lows in OilPersistent rececession fears have slammed oil. A momentous selloff has blasted through the $80's, digging deeply into the $70's, currently feeling out the high $77's at the time of this writing. We are getting support from just above $77.56, but are edging lower and things are looking very bearish. The Kovach OBV has pressed lower and is showing little signs of relief. If we are able to pivot, then $80 should be a ceiling, with $76.16 the next target to the downside.

Oil Order Flow - Opens Door To $60.00In this video I offer my train of thought as to why Oil might be en-route to target as ultimate cyclical target the $60.
The OFA script breaks down what otherwise would be a very messy and chaotic price behavior into neat and visually clear waves.
Remember the two key main features of the OFA indicator:
Magnitude: A major clue that will help determine the health of a trend is the type of progress by the dominant side in control of the trend. We need to ask the following question: Are the new legs in the active buy-sell side campaign as identified by the script increasing or decreasing in magnitude?
Velocity: When it comes to the distance the price moves, the magnitude is only ½ the equation. The other ½ has to do with the velocity of the move or the speed. Was the new leg created after a fast and impulsive move? Or did price make a new low or high with the movement being sluggish, compressive and taking too long to form? A good rule of thumb is to count the number of candles it took to achieve a new leg.

Crude Oil (WTI) Important Breakout & Bearish Outlook 🛢️
Hey traders,
WTI Crude Oil broke and closed below a major horizontal weekly demand cluster.
I believe that it is very strong bearish clue and it may push the market much lower.
The closest support that I spotted is 66 level.
It might be the next mid-term goal for sellers.
❤️If you have any questions, please, ask me in the comment section.
Please, support my work with like, thank you!❤️

USOIL 23rd SEPTEMBER 2022Oil prices slipped below the US$85 per barrel level after the US central bank, the Fed, announced an interest rate hike.
U.S. oil demand over the past four weeks fell to 8.5 million barrels per day (bpd), the lowest since February, according to the Energy Information Administration (EIA). On the other hand, there was a 1.1 million barrel increase in crude oil stocks last week.
The European Union is considering restrictions on Russian oil prices, as well as on high-tech exports to Russia, as well as sanctions in the event of an escalation of Moscow's war in Ukraine.
On the other hand, China's crude oil demand is also still pressured by tight restrictions due to Covid-19.
OPEC crude oil exports have been fairly stable, since the high increase in demand earlier this month for an early winter contract.
When Russia refuses to 'restrictions on Russian oil prices', and OPEC starts to 'reduce oil exports', that's we can see prices will tend to be bullish.

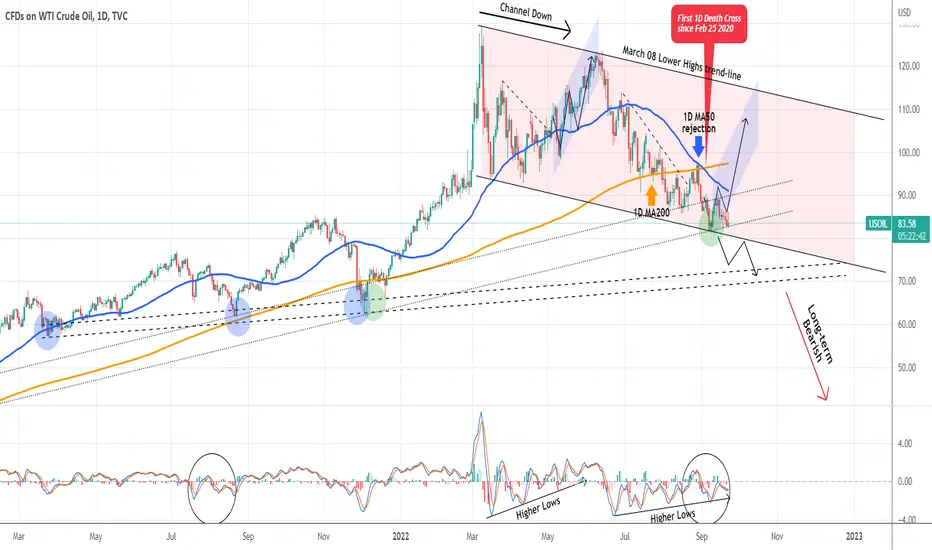
WTI OIL at a critical make or break pointThe WTI Crude Oil (USOIL) has been trading within a structured Channel Down pattern since the March 08 market High, following the immense growth after the COVID 2020 demand crisis. We have covered the Higher Lows zones since the November 02 2020 Low (green circle) and the March 23 2021 Low (blue circle) extensively over the past months on the higher time-frames, which is where Oil is trading at the moment.
Basically the price is at the bottom of both the Channel Down and the Higher Lows zone since Nov 02 2020 2021. The bearish sentiment got stronger when the price got rejected exactly on the 1D MA50 (blue trend-line) on August 30 and turned even worse on September 02 when the 1D MA50 crossed below the 1D MA200 (orange trend-line) to form the bearish pattern of the Death Cross. This is the first time we see this formation since February 25 2020!!
This was a huge bearish sign at the past as it preceded the COVID crash. As long as the Nov 2020 Higher Lows Zone (dotted lines) hold, the Death Cross effect may be postponed for the short-term but only if the 1D MA50 breaks. A first sign towards that bullish break-out may be the Bullish Divergence on the 8H MACD, which is on Higher Lows while Oil has been on Lower Lows since June 22. Also the 8H MACD resembles the July 09 - August 19 2021 fractal, which rebounded on the March 23 2021 zone. Technically the Channel Down should make a new Lower High within 105.00 - 110.00.
A break below the Channel Down though, should finally test the March 23 2021 Higher Lows zone (dashed lines) and at this point under the current fundamentals seems like the most likely scenario. Even if we do get that rebound on the short-term, it would be much safer to be positioned systematically with sells on the rallies, as the Death Cross indicates that the long-term trend is gradually turning bearish .
--------------------------------------------------------------------------------------------------------
** Please support this idea with your likes and comments, it is the best way to keep it relevant and support me. **
--------------------------------------------------------------------------------------------------------
Natural Gas | A bear flag Thursday 22 September 2022
10:50 AM (WIB)
Do not trap by the big macro pictures on the chart for now. Looks at the ascending box that seems the buyers still there. It is still mediocre box that could be draw as the Bear Flags.

OILHELLO GUYS THIS MY IDEA 💡ABOUT CL1 Thank you
IF you like my work please like and follow thanks
TURTLE TRADER 🐢

CL Daily hitting up trend lineCL Daily time frame is hitting the up trend line. Is support holds. We are expecting the market to U-turn bullish and create a new bullish trend towards all time highs.

CRUDE OIL (WTI) Key Levels to Watch Next Week🛢
Hey traders,
Here is my latest structure analysis for WTI Crude Oil .
Resistance 1: 88.9 - 90.4 area
Resistance 2: major falling trend line
Resistance 3: 96.9 - 97.8 area
Support 1: 81.2 - 81.9 area
Consider these structure for pullback/breakout trading next week.
Good luck!
❤️If you have any questions, please, ask me in the comment section.
Please, support my work with like, thank you!❤️

CL1! - Weekly Market Update, 9/19WTI Light Sweet Crude Oil remains supported by channel structures below for this past week.
Price has retraced back to prior to Russia invading Ukraine.

Natural Gas / NG - What, Truly, Is a Bull?The terms "bullish" and "bearish" when used on Twitter and TradingView and in the media are more or less just poorly positioned synonyms for "going up" or "going down."
Yet, it's a misnomer because some of the craziest pumps you'll ever see are during bear markets, and some of the craziest dump-a-thons you'll ever endure are during the most parabolic bull markets.
Right now, the energy world is ablaze because the Russian Federation has more or less cut Europe out of Nord Stream 1 while Europe is already in the middle of an exceptional energy crisis, wrought by its own choices to follow the globalist-communist bloc in trying to punish Putin for a war in Ukraine that roots back to more than a decade of U.S.-NATO-led pot-stirring.
News like this causes Europe's natural gas futures to print remarkably stupid prices, making a huge amount of widows from those who were trading short, and energy companies who are paying those prices and yet cannot charge those prices to the end user because of socialist command economy policies placed by the government.
However, for North America's Henry Hub futures, Europe needing gas doesn't really help, because the Freeport terminal that's really the only place that LNG gets exported in any meaningful quantity blew up in July.
It was supposed to come back online in October. And yet, news of its delay until at least November already printed on Aug. 23.
Taking a look at the monthly, you can see that NG is still, really, historically cheap:
The Biden Administration is going to donate a great quantity of natural gas to Europe once Freeport is back online. In my view, we're going to see a new all-time high print. Something that starts with the number "2."
But before we get there, it's important to keep a cool head, and ask yourself: if Freeport has been offline since July and was set to come back online in October, why does price meander in this $8-9.50 range so early?
Taking a look at the weekly provides some context:
Before Freeport blew up in the first place, NG was flirting with $9. Once it blew up, it immediately took a three week liquidation spree to $5.50, with the worst part of that trip occurring on the final day of June as monthly futures contracts settled.
Then it bounced. And for a commodity whose market maker usually likes to whip it up and down and gap up and gap down with violence on daily and weekly opens, it really just went in a straight line back to $9.
Expanding down to the daily, it's even more obvious how much this traded like the SPX500 does when the Fed's money printer is doing work so that 75 year old men can mash buy and take a nap:
And now here we are, entering the second week of September post-Labor Day. All the propaganda outlets and pundits crank the sirens, chanting, "Europe Natural Gas Utilities Crisis Russia Gazprom Texas Heatwave High Pressure Heat Dome California Electric Grid Shortage!!!"
And all of that is true, just like all of that was true for WTI Crude when it traded at $125 for two months.
And yet somehow, despite the fundamentals and all the pundits calling for $180 and $350 BECAUSE REASON S, oil is down 30% and it still isn't finished dumping.
So, why is it?
It's not hard to figure out.
It really isn't.
Retail buys high because they see confirmation that something is going up, and then panic sells when it gets rugged.
And then when it goes back up they mash buy at a higher price than they sold at because of "Fear of Missing Out," and then they don't sell when they're in profit because their target on the SPX is 12,836 because Gann and Elliot said so, and everyone wants to be that guy you hear about who bought Google at $2 and held it for 20 years while playing golf.
If Shell or Exxon traded like that, they would be bankrupt, none of us would have electricity to read these words, and we'd all either die from heat exhaustion or freeze to death without AC and furnaces.
The reality is that when NG dumped at the end of July, it still didn't dump deep enough to enter a discount in this overall trading range. We've simply been watching what is still currently the 7th straight week of premium trading.
If Natural Gas is going to go to $20 when Biden starts donating energy to save NATO's European arms, it really would make a lot more sense if some time were spent so companies and funds could accumulate a significant position at a relative discount.
And indeed, there are at least two fat and curiously unchallenged double bottoms presented in the 4H chart that just happen to be in the sub-50% dealing range and at a price so low that it will have margin calling and leave ZeroHedge and Javier Blas from Bloomberg and friends in bewildered disbelief as to how energy commodities aren't worth anything "in a recession."
I often say that what a person thinks can happen and what is actually happening in this world and this Universe are simply two totally different things. A human being is heavily deceived by the slow grind of time and the ostensible appearance before their eyes.
Reality, on the other hand, simply follows a certain law and it will complete itself according to that law no matter how anyone cries about it. Whoever is in harmony with the law will establish themselves, and whoever is afoul of the law will get liquidated.
The caveat to this chart is time. I can only fit so many 4H candles in a window and so the time on this chart only extends into early October. These lower prices, if they really come, could happen later in October or even in November.
And while it'll really be quite the opportunity, it's also a "second mouse gets the cheese" kind of thing for those who are trying to get long for the moon at $7 and $6.

CL1!The price broke and closed above resistance.
you can see buying opportunities.
If you like trade futures don´t be forget support for more ideas.
Any questions contact me.
Thank you.

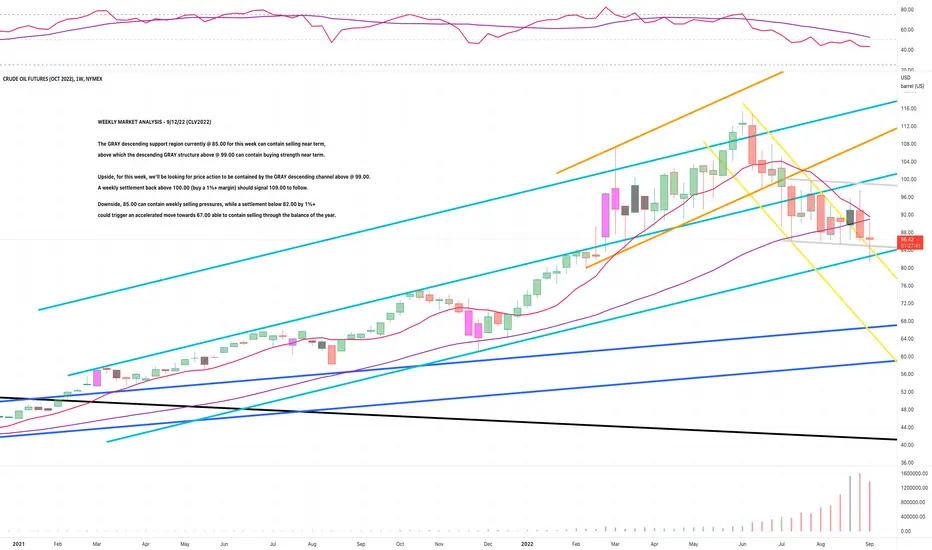
CL1! - Weekly Market Update, 9/12WEEKLY MARKET ANALYSIS - 9/12/22 (CLV2022)
The GRAY descending support region currently @ 85.00 for this week can contain selling near term,
above which the descending GRAY structure above @ 99.00 can contain buying strength near term.
Upside, for this week, we'll be looking for price action to be contained by the GRAY descending channel above @ 99.00.
A weekly settlement back above 100.00 (buy a 1%+ margin) should signal 109.00 to follow.
Downside, 85.00 can contain weekly selling pressures, while a settlement below 82.00 by 1%+
could trigger an accelerated move towards 67.00 able to contain selling through the balance of the year.
Oil Attempts a ReboundOil bottomed out at 81.30, as expected. Oil prices are generally trending downward off recession fears and china coronavirus lock downs . We are seeing a small pivot off lower levels and an attempt to regain 85.55, which should provide strong resistance as it was a low tested several times earlier last week. We are starting to see strong resistance as we approach this level. If we break through we could make a run for the $90's. If we retrace, then $81.30 should provide support again.

CRUDE OIL (WTI) Detailed Technical Outlook 🛢
Weekly/daily time frame analysis on WTI Crude Oil.
Price action, key levels & thoughts.
Potential scenarios.
❤️If you have any questions, please, ask me in the comment section.
Please, support my work with like, thank you!❤️

it's the right time to sell cl !we have a big down trend channel, NYMEX:MCL1! NYMEX:CL1!
and we see the price move into the down channel, with a effect resort candel.

USOIL 5th SEPTEMBER 2022The standoff over Russia's gas and oil exports escalated on Friday after Moscow promised to close its main gas supply pipeline to Germany and G7 countries announced plans for price caps on Russian oil exports aimed at squeezing Russia's war chest in Ukraine. This latest closure of the Nord Stream pipeline, which Russia says will last as long as it takes to make repairs, adds to concerns over winter gas shortages that could pull major economies into recession and lead to energy rationing. Europe accuses Russia of weaponizing energy supplies in what Moscow calls an "economic war" with the West following Russia's invasion of Ukraine. Moscow blames Western sanctions and technical problems for supply disruptions.

USOIL 8th SEPTEMBER 2022Oil prices fell sharply on Wednesday (September 7th), slipping below levels seen before Russia's invasion of Ukraine as dismal Chinese trade data and growing fears of a global economic recession hurt fuel demand.
West Texas Intermediate (WTI) oil futures for October delivery plunged US$4.94 or 5.7 percent.
With lower prices this time it is a good opportunity to supply companies that are optimistic about surviving the recession and tightening monetary policy.
This week, OPEC+ is scheduled to discuss oil production cuts as part of their future strategy.
OPEC+ revised the market balance this year and expects demand to lag supply by 400,000 barrels per day (bpd) compared to the previous estimate of 900,000 bpd.
However, the group of major oil producers expects the oil market to be in deficit by 300,000 bpd by 2023.

Crude Oil - Two TargetsAfter the 114 level seems to be nailed, higher targets are on the plate.
There is not much to say here.
Price just roars further north.
The A/R and Pitchforks project the highly potential price targets.
Read again: "project", not predict ;-)
Trade small, trade save.

LIGHT CRUDE OIL FUTURESCurrently, petroleum trades casually, aggressively and also could not break the strong demand zone, which is a strong support.

Crude Oil in 4H time Frame.Hi Everyone,
Please see updated 4H chart, Oil already hit the support around 86 ready to test the key point at 90, if break there is likely 2 possible upside moment.
as we can see the oil will make range until the fed release their new hike Interest rates.
we also need see the next coming geopolitical movement from Russia , China and USA.
The oil embargo will also have an impact on price movements.
first possible range(4h - 1D):
80 - 110 USD
second possible range (4h - 1D):
75 - 103 USD
i try to always we will keep you all updated . Please don't forget to like, comment and follow to support us, i really appreciate you support !
Goodluck
i'll help you to have a great trade.
Please using good money management.
dont take any emotional trade.
Note:
Dont risk more than 0.2% on trending market
Dont risk more than 1% on ranging market
Wish good luck for all people.
Please help support me by Clicking like button, and if you like my ideas please follow me and support me. i Relly Appreciate it!
i'll make more and more great analysis if this chanel grows.
on Gold , Oil , Nasdaq, SP500 , and some American, China, Japan, Indonesia stocks.
Best luck for you.
Cheers mate!
Thankyou.

CL1!:Short Trading Opportunity
CL1!
- Classic bearish pattern
- Our team expects fall
SUGGESTED TRADE:
Swing Trade
Short CL1!
Entry - 87.23
Stop - 91.28
Take - 81.15
Our Risk - 1%
Start protection of your profits from higher levels.
❤️ Please, support our work with like & comment! ❤️
