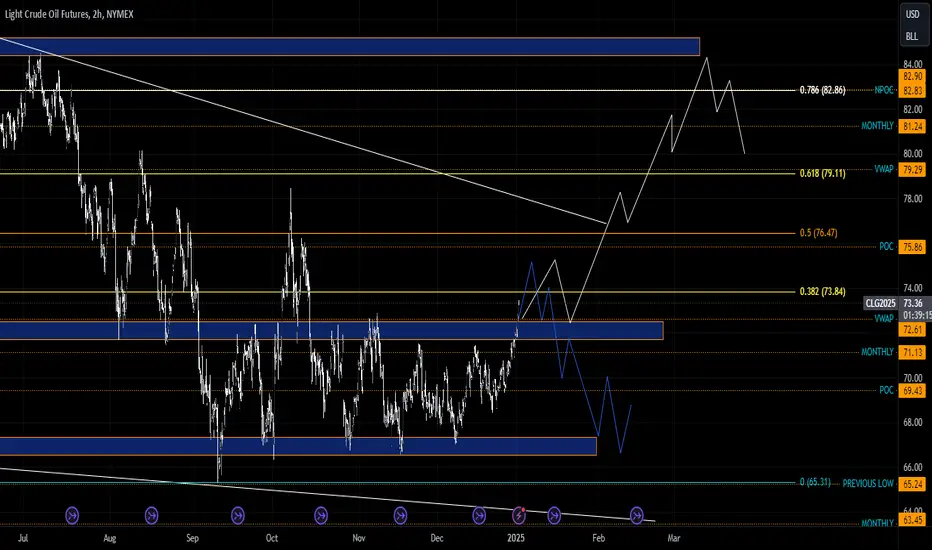
Crude OIL Follow the plan Oil is one of the main tools that pressure the global economy. This tool is manually controlled; I will not repeat who owns it.
For the last 10 years, I have seen this pattern very often when we see a triangle that breaks down, but before it collects liquidity from above and breaks the upper resistance
I talked about it in a previous post
The idea is still the same; the timings are stretched longer.
I intend to pick up a historical start this year, most likely at the end of the year.
That's my lazy plan.
The realization is more complicated because opening a position at the ideal entry point will be challenging. All shorts will be liquidated and stop out for a long time, so we will probably have to stand in the reversal formation phase for a long time.
I could go on and on about politics and how it's explained to you on TV. But I don't do that.
Best regards EXCAVO
Cl1

Forecast UPDATES! Jan 15, WedIn this video, we will update the forecasts for the following markets:
ES \ S&P 500
NQ | NASDAQ 100
YM | Dow Jones 30
GC |Gold
SiI | Silver
PL | Platinum
HG | Copper
Enjoy!
May profits be upon you.
Leave any questions or comments in the comment section.
I appreciate any feedback from my viewers!
Like and/or subscribe if you want more accurate analysis.
Thank you so much!
Disclaimer:
I do not provide personal investment advice and I am not a qualified licensed investment advisor.
All information found here, including any ideas, opinions, views, predictions, forecasts, commentaries, suggestions, expressed or implied herein, are for informational, entertainment or educational purposes only and should not be construed as personal investment advice. While the information provided is believed to be accurate, it may include errors or inaccuracies.
I will not and cannot be held liable for any actions you take as a result of anything you read here.
Conduct your own due diligence, or consult a licensed financial advisor or broker before making any and all investment decisions. Any investments, trades, speculations, or decisions made on the basis of any information found on this channel, expressed or implied herein, are committed at your own risk, financial or otherwise.

CL continued Bullish BiasI will keep my bias Bullish with the draw being the PDH at 80.16 Now price could retrace into the D Discount Wick into the CE level and then trade higher but my overall Focus is the double top BSL.

TP FILLED ON USOIL TRADEYesterday I posted to sell USOIL, and I didn't post about where to close since we didn't close at the target, instead we closed a bit higher after that the market swept a LQ at 77.399.
Follow for more daily trades!

SELL USOILGood morning traders,
I'm sharing with you my trade for today on OIL, you acn sell with the same TP and SL as mine.
Follow for more!

SELL USOILGood morinng traders!
Our trade today is on OIL, we're selling after having the reversal confirmed by thge market to target our LQ level.
Follow for more!

Crude Oil breaks and follows projectionAfter the long consolidation time, CL finally broke the Trend-Barrier (TB) and is now on the move to the upside.
It's not stupid to aim for the 1/4 line as PTG1.
But for sure I would only close a portion of the position, since the upside potential is far higher.
And if you don't know how much to bank, just go with 50% of your investment. If it's going higher, you're still participating from the move.
If it goes sour, you have already banked 50%.
Just create a plan and follow it.

The Market Matrix - Gold, Crude, Nasdaq & DXY for January12 2025This weeks edition of The Market Matrix.
Actionable insights for Gold, Crude Oil, Nasdaq & DXY.

COLLECTED PROFITS ON TODAY'S TRADE ON USOILI posted earlier today to buy on USOIL | OIL | CL1!, We set a 1:2 trade but since today is a holiday and the markets are slow, we closed after that we have an equal high and the market swept them.
We had a wonderful trade in a closed market.
Follow for more!

BUY USOILAs you can see here on the chart, the market will start its rally upwords after the last down movement, now we got the confirmation of the reversal.
Buy and target the same level as mine.
Follow for more!

HTF Directional Bias for CL
I like the fact that price traded higher into a premium and found rejection off the Volume Imbalance 50% CE level as it clears the BSL above the PDHs.
Currently price is trading inside the wick from the Mon 06 Jan 2025 and looks to have reached as low as the 25% quadrant level.
My bias for CL is Bearish as I am looking at the two PDLs in discount above the D BISI which should act as a draw for price to reach lower and clear that SSL at 73.11 and 72.70 From there I could expect price to dip into the D BISI and reject possibly off the high or 50% CE level.

WTI OIL Critical crossroads on the 16-month Resistance.WTI Oil (USOIL) is having a strong rally in the past 30 days following the rebound on the 2-year Support Zone. This Zone has contained all 1W candle closings above it, so this rebound is coming as a natural technical reaction for buyers but it is about to face a critical Resistance Cluster.
First is the 1W MA50 (blue trend-line) but the most important level is the 16-month Lower Highs trend-line that started in late September 2023. Technically, as long as it holds, the price is more likely to get rejected now back towards the Support Zone, so at the moment we are bearish with a 68.00 Target.
If the Lower Highs trend-line breaks and WTI closes a 1W candle above it, we don't expect the 1W MA200 (orange trend-line) to offer much Resistance, so we will take the small loss on the short and switch to buying. Our Target in that case will be Resistance 1 at 84.50.
-------------------------------------------------------------------------------
** Please LIKE 👍, FOLLOW ✅, SHARE 🙌 and COMMENT ✍ if you enjoy this idea! Also share your ideas and charts in the comments section below! This is best way to keep it relevant, support us, keep the content here free and allow the idea to reach as many people as possible. **
-------------------------------------------------------------------------------
💸💸💸💸💸💸
👇 👇 👇 👇 👇 👇

CL1! Scenario 2.1.2025 The price has currently broken through one of the main resistances and we have oil at 73 and then I have two scenarios: either the price does not break through the support at 72.5 and goes up, but I would like to see an sfp below the low, if we were to consider a short, I would like an sfp above the high, then there would be a potential entry.
Crude Opportunity Part 2In this second part, the Crude Futures Daily chart is used.
In this chart, there are marked points where the SuperTrend Buy signal is triggered and is coincided by a green Rate of VolDiv (RoVD, bottom panel). There is one on 8 October but there was no comcomitant indication and clearly it "failed". The others that fulfilled the condition are marked with a yellow time line.
So clearly, the recent breakout is projected to have something similar in terms of a bullish rally.
This is in line with the weekly outlook.
Together with technical indicators like the RoVD, as well as the MACD where there is a clear breakout support, Crude appears to have much upside potential. However, there is no rush as it just met the trendline resistance and is expected to pull back a bit to retest and breakout again for the longer term.
Overall, this looks not like a spike out of fear, but one spurred by inflation. This is in the MUST WATCH list for sure and an accumulation plan should be in place.
A projected path is drawn as a guide and the target for Crude is 100-105.

BUY USOIL | CL1!Good morning traders!
Today's trade is on Oil, you can buy and set the same target and stop as mine.
Follow for more!

Crude Opportunity Part 1Previously, heads up about BTCUSD and it was pretty spot-on.
Oddly enough, CRUDE OIL CL1! is next.
For the first part, here we look at the marked time lines, and the effect after these time lines. 5 of the last 6 times, saw a bullish rally. Of these, 4 of the 5 occasions had the Rate of VolDiv (custom indicator) trend changed for an uptick.
In essence, the current weekly Crude Oil Futures CL1! show a similar set up ready for a spike and rally for Crude Oil. No fundamental reason (yet) but the technicals are projecting a billish scenario based on the technical set up.
Part 2 will look more in-depth and zoom into the recent time frame...
Stay tuned if you are keen...

Murphy Oil Corp START BUY at 14The company in the energy sector is undertaking efforts to optimize debts and increase efficiency in production. Stable dividends and share buybacks create an interesting investment opportunity

WTI OIL Break-out or rejection strategy.WTI Oil (USOIL) gave us an excellent buy signal last time (December 27, see chart below) that produced a Bullish Leg straight to our $72.80 Target:
The price is right now above Resistance 2 and almost at the top (Higher Highs trend-line) of the Channel Up. Having completed a +6.65% rise (which was the previous Bullish Leg), it is now highly likely to start seeing a reversal to a Bearish Leg. Especially since the 1D RSI is testing the October 07 2024 High.
As long the price gets rejected below the top of the Channel Up, we will be bearish, targeting $70.50 (above the 0.618 Fib and the 1D MA50). If the price breaks and closes a 1D candle above the Channel Up, we will take the small loss and switch to a buy, targeting the 1D MA200 (orange trend-line) at $75.15.
-------------------------------------------------------------------------------
** Please LIKE 👍, FOLLOW ✅, SHARE 🙌 and COMMENT ✍ if you enjoy this idea! Also share your ideas and charts in the comments section below! This is best way to keep it relevant, support us, keep the content here free and allow the idea to reach as many people as possible. **
-------------------------------------------------------------------------------
💸💸💸💸💸💸
👇 👇 👇 👇 👇 👇

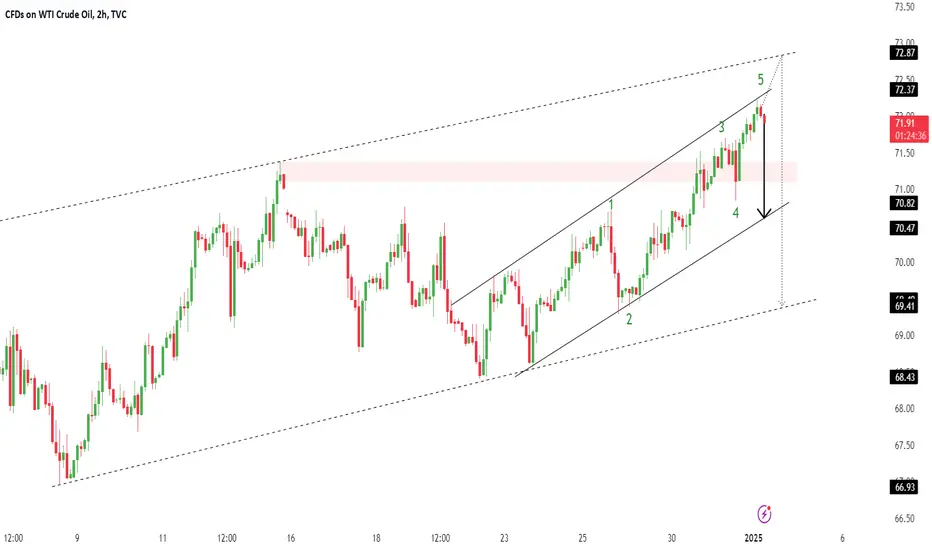
US OilUS Oil - Crude Oil
Completed " 12345 " Impulsive Waves
Break of Structure
RSI - Divergence
Bullish Channel as an Corrective Pattern in Short Time Frame
Change OF Characteristics
WTI OIL Will it hold the 4H MA200 and rebound?WTI Oil (USOIL) almost tested on yesterday's pull-back the 4H MA200 (orange trend-line), following Monday's rebound on the former Lower Highs trend-line. This technical shift from a Resistance level turning Support, signifies the emergence of a new Channel Up pattern, which needs to hold the 4H MA200 in order to materialize the new Bullish Leg to a new Higher High.
The pattern's first Higher High was priced on the 71.45 Resistance (1) and if the current Higher Low holds at the bottom of the Channel Up, we expect an equally powerful Bullish Leg for the next Higher High. However the 1D MA100 (red trend-line) needs to break as it currently poses the strongest Resistance, having rejected the uptrend not just on the Resistance 1 test (December 13) but also yesterday (December 26).
As a result, if this level breaks, we expect the trend to hit at least Resistance 2 with our Target being $72.80.
-------------------------------------------------------------------------------
** Please LIKE 👍, FOLLOW ✅, SHARE 🙌 and COMMENT ✍ if you enjoy this idea! Also share your ideas and charts in the comments section below! This is best way to keep it relevant, support us, keep the content here free and allow the idea to reach as many people as possible. **
-------------------------------------------------------------------------------
💸💸💸💸💸💸
👇 👇 👇 👇 👇 👇

SELL CRUDEOIL | USOIL | CL1!You can sell USOIL | CL1! | USOUSD at the same entry as mine and the same target and stop.
Follow for more!

TQRGET REACHED ON CRUDE OILEarlier I posted to buy on CL1! | USOUSD | CRUDE, after that I posted to sell and reverse the position, now the market reached our target which was the LQ Level, 2 good trades today!
Follow for more daily trades!

TRADE REVERSED ON CRUDE OILI posted earlier to sell on CL and I didn't post to reverse the position after that we got a reversal, now we're targetting the BS LQ.
