Planning for the Next Trade in Crude OilNYMEX:CL1!
Key Levels – Higher Timeframe:
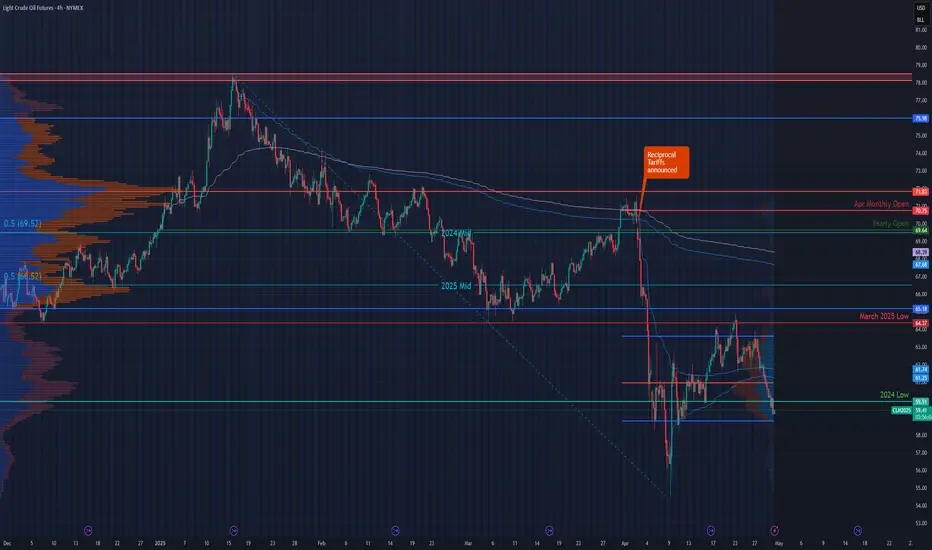
• 2025 High: 78.56
• Yearly Open (2025): 69.64
• 2025 mCVPOC: 71.83
• Yearly VWAP: 68.41
• AVWAP from Yearly Highs: 67.71
• 2025 mCVAL: 65.28
• March 2025 Low: 64.37
• 2024 Low: 59.91
April 2025 Key Levels:
• April mCVAL: 58.79
• April mCVPOC: 60.94
• April AVWAP from Lows: 61.29
• April AVWAP from Highs: 61.76
• April mCVAH: 63.73
Our previous trade idea played out as expected. With updated levels now in place, we aim to reassess the market context without falling into recency or confirmation bias. These biases often lead to an overly bearish outlook at market lows, especially amid ongoing headlines around trade war tensions and supply concerns. While such fundamentals are important, maintaining objectivity is key.
This leads us to the central question: Is all this bearish sentiment already priced in? If so, why are sellers still dominant?
From a broader perspective, the overall context for crude remains bearish. However, this does not imply an immediate continuation to lower prices.
Currently, price is trading below both the midpoint of 2025 and that of 2024. Additionally, the recent price swing failed at the March 2025 low—an important technical rejection. The 2024 low at 59.91 now serves as key structural support. We anticipate further consolidation within the April 2025 value range, specifically between mCVAH (63.73) and mCVAL (58.79).
We define the area between April’s mCVPOC (60.94) and AVWAPs (61.29 / 61.76) as a "noise zone"—a region where price action is likely to be choppy and directionless. This zone is not favorable for directional trades.
Potential Trade Setup – Range-Bound Play
Example Trade 1: Long Crude Oil
• Entry: 59.91
• Stop: 59.20
• Target: 61.76
• Risk: 71 ticks
• Reward: 185 ticks
• Risk/Reward Ratio: 2.6R
Example Trade 2: Long Crude Oil
• Entry: 58.80
• Stop: 58.20
• Target: 61.76
• Risk: 60 ticks
• Reward: 296 ticks
• Risk/Reward Ratio: 4.93 R
Important Notes:
• These are example trade ideas and not financial advice or recommendations.
• Traders should conduct independent analysis and ensure proper risk management.
• Stop-loss orders are not guaranteed; slippage may occur, resulting in losses beyond predefined levels.
• AVWAP levels are accurate at the time of posting, they may vary as indicator further calculates prices with new volume and price information.
Glossary Index for all technical terms used:
ATH: All time high
VPOC: Volume Point of Control
VAL: Value Area Low
VAH: Value Area High
VP: Volume Profile
AVP: Anchored Volume Profile
C: Composite (prefix before VAL, VAH, VPOC, VP, AVP)
mC: micro-Composite (prefix before VAL, VAH, VPOC, VP, AVP)
AVWAP: Anchored Volume Weighted Average Price
Green Zones: Bull/ Buyers support zones
Red Zones: Bear/Seller resistance zones
Cl_f1!
Is CL looking bearish? Short below LIS/Yearly Open?NYMEX:CL1!
Macro update:
Will we see another bullish leg like Jan 2025? Or does crude oil have room to move further lower and resume its downtrend after putting in the high of the year?
In our opinion, most headlines since the new US administration have already been priced in by market participants.
Crude oil fundamentals—encompassing supply, production, and demand outlook—are likely to influence prices more significantly than headline news. Our analysis indicates that the market has rebalanced, trading above the Composite Volume Point of Control (CVPOC) at $68.45 per barrel, as derived from our 2022 anchored Composite Volume profile. Furthermore, the 2025 Volume profile is exhibiting a “b”-shaped formation, signaling a move toward balance in its lower range.
From a market auction perspective, two key price ranges are established:
Q4 2024 Lower Distribution: Approximately $65–$70, indicating a balanced market.
Q1 2025 Value Area: Approximately $70–$75, also reflecting balance.
In our analysis, it’s essential to adopt a broader view by examining higher timeframe levels to stay aligned with these key market levels. While intraday or intrawork trends may display bearish or bullish momentum, the overall market auction framework suggests further consolidation within these ranges—unless new developments significantly alter the crude oil fundamentals or breaking headlines emerge that have yet to be priced in.
Key Levels to Watch
Key levels represent areas of interest and zones of active market participation. The more significant a key level, the closer we monitor it for potential reactions and trade setups in alignment with our trading plan.
Jan 2024 CVPOC and mCVPOC Q4 2024 confluence: 68.45 - 68.25
Key Bull Support/LIS: 69.90 - 70.50
Feb 2025 VAL: 70.80
2025 mCVPOC: 72.82
Feb 2025 VAH: 72.70
mCVAH/Jan 2025 mid: 74.96 - 74.80
Scenario 1:
Price gets above key support to further consolidate within Feb 2025 Value Area
Scenario 2:
Intraday bullish price action with higher lows that fails to gain momentum above the 2025 VPOC.
Scenario 3:
Price holds below Yearly Open and LIS key support. A bearish head and shoulders pattern develops to push prices lower to test CVPOC 2022.
Micro CME contracts allow for more precise risk management during volatile market conditions. Additionally, you can participate in the CME and TradingView paper trading competition, giving you the opportunity to test your skills in The Leap without risking real money.

COT Analysis Summary - Energy SectorA few weeks ago, I was calling for longs in CL, HO & RB based on the COT strategy. The move is underway, but based on new analysis this week, I would look to take further long entries in these energy markets. There are currently no COT strategy setups for NG.
