$KO | #CocaCola looks like a BUY here! Sitting on MAJOR SUPPORT!$KO | #CocaCola looks like a BUY here! Sitting on MAJOR SUPPORT!
Cocacola


KO ready for TKO! 1 higher high to goLONG TERM PERSPECTIVE (2 WEEK INTERVAL)
LONG TERM PERSPECTIVE (WEEKLY INTERVAL)
3 DAY INTERVAL
1 DAY INTERVAL
will do further analysis, as time progresses. must see what rest of US stocks do
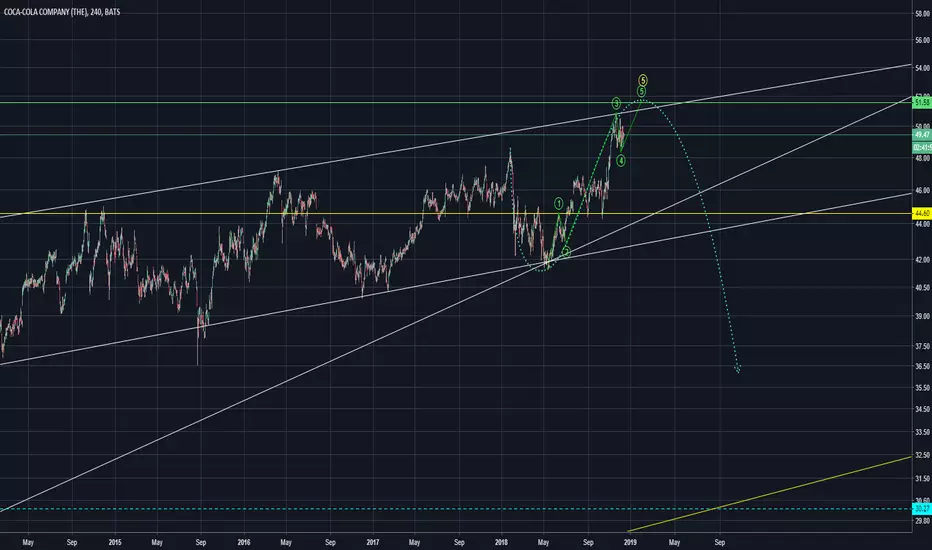
If KO continues trend, Nov 30 calls will 10xNov 30 calls at strike $51.50 are $0.10. If KO continues it's trend from October 26th to Nov 30, KO calls at strike $51 will reach $1 for an upside of 10x. Since KO is only 1% from the bottom of it's trend, one could sell at a 50% loss tomorrow if it breaks it's trend for a resulting Risk/Reward of 0.50/10. In my analysis, this play has a 20x greater reward than risk.

$KOif this opens this week green, go long. If it opens red, look for nice dip to go long. This chart is extremely bullish and offers a lot of trading opportunities.

COCA COLA SELLWait for the price to hit the upper trendline of the pattern and watch strong price action for sell.
Don't take a trade if you don't see clearly when big guys are in.

Can Coca Cola's Fizz see it Breakout!?Coca Cola is a household name and a company many investors may be interested in trading and it is potentially
on the verge of breaking out.
On the weekly chart we can see that price has bounced off the 50 simple moving average where it found support.
The sellers were unable to gain control and the buyers forced price to head even higher.
The 200 simple moving average on the daily chart (not shown) was also used as a support area.
Price trended well from 2016 to 2017 so if a breakout does occur then we may see a nice trend follow as it did in the past.
The consolidation area which price is currently held within has lasted for over 5 months so we shouldn't be too quick to enter a trade
if we do see a breakout. Let price confirm that it wants to stay out of the consolidation area and then look for trading opportunities.
As last week was bullish it will be interesting to see how the coming week will perform.
Any comments or questions, do not hesitate to leave them below. Hit agree if you share our sentiments!
Sublime Trading

Staples, RALLY or PULLBACKHere we broke through the lows, that confirmed that this sector is weak. So here is a simple setup. I want in if and only if we have a lower low , immediately XLP makes higher highs , I would be wrong.

Coca cola long and safe investmentIf i had money
With No doubt, i bought the shares stock of the Coca-Cola Company
Investment in the Coca-Cola Company can be very effective
Of course i telling you look long investments for futures
1. price is being revised
2. And the downtrend wave will end soon
3.And will soon resume its growth
4.Must wait in the future
Good news from Coca-Cola Company
Newer products
Better market for selling products and so on
5. The company's stock prices in the next few years
Greatly increases
Do not miss the opportunity to buy at this price today

Coca Cola Seasonal Decline ExpectedAccording to seasonal chart Coca Cola shows a decline in August until end of September.
Move is supported by HTF price action.

Coca cola : It is not time to buyThe weakness of the Coca Cola title continues. On July 26th, second-quarter earnings will be announced, which in the last two years has been exacerbated by the strength of the dollar and the massive internal restructuring plan; Another disappointing result would bring the title to an interesting listing. For the moment we expect a good price to buy the shares

Bullish Triple Cross For Coca-ColaOn April 27, 2017, The Coca-Cola Company ( ) 20 day moving average (DMA) crossed above the 250 DMA , 50 DMA crossed above the 200 DMA, and 100 DMA crossed above the 150 DMA. All three crosses are bullish in nature and have never all occurred on the same day before. Historically the stock does not always rise over the next 20 trading days when each individual cross occurs. The 20 DMA has crossed above the 250 DMA 50 times with a median gain of 2.685% and maximum gain of 13.139%. The 50 DMA has crossed above the 200 DMA 38 times with a median gain of 3.46% and maximum gain of 11.364%. The 100 DMA has crossed above the 150 DMA 47 times with a median gain of 3.216% and maximum gain of 13.953%.
When we take a look at other technical indicators, the relative strength index (RSI) is at 55.3323. RSI tends to determine trends, overbought and oversold levels as well as likelihood of price swings. I personally use anything above 75 as overbought and anything under 25 as oversold. The current reading declares the stock has been neutral and not likely to produce volatile price swings.
The true strength index (TSI) is currently 22.0722. The TSI determines overbought/oversold levels and/or current trend. I solely use this as an indicator of trend as overbought and oversold levels vary. The TSI is double smoothed in its calculation and is a great indicator of upward and downward movement. The current reading declares the stock is moving up.
The positive vortex indicator (VI) is at 1.0681 and the negative is at 0.9066. When the positive level is higher than 1 and higher than the negative indicator, the overall price action is moving upward. When the negative level is higher than 1 and higher than the positive indicator, the overall price action is moving downward. The current reading declares the stock has been moving up slowly, but the negative indicator is gaining ground.
The stochastic oscillator K value is 46.7087 and D value is 50.0531. This is a cyclical oscillator that is highly accurate and can be used to identify overbought/oversold levels as well as pending reversals and short-term activity. I personally use anything above 80 as overbought and below 20 as oversold. When the K value is higher than the D value, the stock is trending up. When the D value is higher that the K value the stock is trending down. The current reading declares the stock has left overbought territory and is pretty neutral on direction.
Considering the moving average crossover, RSI, TSI, VI and stochastic levels, the overall direction appears to continue heading up over the long term. Based on historical movement compared to current levels and the current position, the stock could gain another 1.60% over the next 20 trading days.

A Comparison of Pepsi Co. and Coca Cola Co.This is a comparison of Pepsi Co. and Coca-Cola Co.'s stocks over the past 45 years.

long COCA COLA @ daily @ trading capability until january`17Take care
& analyzed it again
- it`s always your decission ...
(for a bigger picture zoom the chart)
This is only a trading capability - no recommendation !!!
Overnext month i`ll confirm or change my opinion about this SetUp :)
Buying/Selling or even only watching is always your own responsibility ...
Best regards
Aaron

KO Coca Cola Co potential bullish cypher pattern on weekly chartbuy @$38.82
right below X we have strong weekly support offering downside protection (red line)

Coca-Cola 4h The chart tells it all.
Set Stop Loss and Take Profit accordingly. Manage your risk and enjoy the profit.


Elliott Wave Analysis & Forecast, #KO, M1, 20160119Today we pick up coke share and gone deeply into price history. If we look at chart we have to know that is SUPER CYCLE complete in its five red waves? The span of the cycle consisted about 100 years but usually the age of super cycle consist of 50-70 years but it is not hard and fast rule. If its correct then we are now in super correction since 1998. Red wave A completed in the form of triangle and wave B finished just above the previous high in nov , 2014. Now we are in final wave red C which will consist of five blue sub waves. As wave 1 is little bit short, we are expecting that blue wave 3 will extends and ideal target for this wave is near 9$-10$ or even low in coming years.
