Coca-Cola Stock Falls Despite Strong EarningsDuring the latest trading session, Coca-Cola stock maintained a clear neutral bias after a nearly 1% decline, falling below the $70 per share level. This movement came despite the company reporting better-than-expected results, with earnings per share (EPS) of $0.87, above the $0.83 expected, and total revenue of $12.62 billion, exceeding market estimates of $12.54 billion.
Despite these solid results, the company noted that it expects a possible decline in sales volume over the coming months and also anticipates higher costs due to a new commercial strategy. Additionally, there is growing uncertainty around demand for sugary beverages, which could be impacted by the current economic backdrop. These factors have limited short-term upside potential, leaving the stock in a state of technical neutrality.
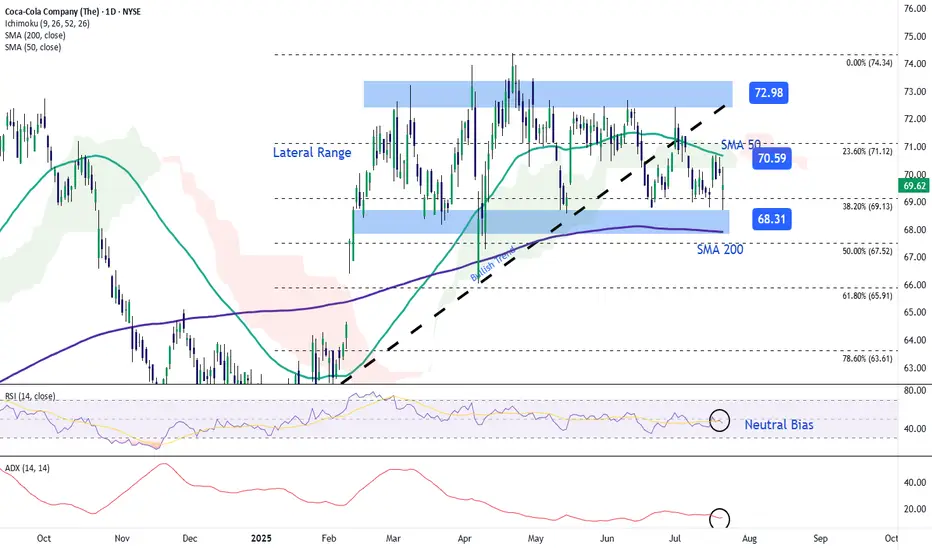
Sideways Range Holds
Since late February, the stock has been trading within a steady sideways range, with a ceiling at $73 and a floor at $68. The current price remains near the midpoint of that range, reflecting a lack of clear long-term direction. As long as this indecision continues, range-bound behavior is likely to dominate in the sessions ahead.
Technical Indicators
RSI: The Relative Strength Index remains close to the neutral level of 50, indicating a balance between buying and selling pressures. Without a clear directional shift, the sideways range may continue in the short term.
ADX: The ADX line has been fluctuating below the 20 level, indicating low average volatility and a persistent consolidation phase. Unless this indicator sees a meaningful uptick, the current range is likely to remain in play.
Key Levels to Watch:
$73 – Major Resistance: Marks the upper boundary of the range. A strong move toward this level could initiate a new bullish trend.
$70 – Immediate Resistance: Aligns with the 50-period simple moving average and the 23.6% Fibonacci retracement level. A breakout here could signal a short-term bullish bias.
$68 – Key Support: Aligned with the 200-period simple moving average, this level represents a critical technical floor. A break below it could activate a relevant bearish bias and potentially lead to a longer-term downtrend.
Written by Julian Pineda, CFA – Market Analyst
Cocacolacompany
Coca-Cola: Nearing Final Wave III HighDespite recent sell-offs, we still expect Coca-Cola to reach a final high of magenta wave within our beige Target Zone between $76.58 and $81.51, which should also mark the completion of the broader beige wave III. However, an alternative scenario—with a 38% probability—remains in play: in this case, the top of beige alt.III would have already occurred, and a direct decline below $60.62 would likely follow. In either scenario, once the high of beige wave III is established, we anticipate a significant correction.
📈 Over 190 precise analyses, clear entry points, and defined Target Zones - that's what we do.

Coca-Cola: IndecisiveCoca-Cola continues to trade sideways, still failing to confirm either of our scenarios definitively. The primary scenario envisions that wave III in beige will post another high within the beige Target Zone ($76.58–$81.51), which offers a potential setup for short positions. Following that, wave IV in beige should begin a substantial correction. However, if the stock fails to overcome resistance at $74.38, it could indicate that the top of wave alt.III in beige is already in. A decline below the $66.05 support level would activate the alternative scenario (35% probability), implying a drop below $60.62.

Shares of Coca-cola Set For Breakout Amid Golden Cross Pattern The Coca-Cola Company (NYSE: NYSE:KO ) on Tuesday reported first-quarter sales below analysts' estimates but profit that topped expectations, as the beverage giant navigates tariff uncertainty.
Earnings Overview
The company said its "comparable," or adjusted, earnings per share came in at $0.73 on revenue that declined 2% YoY to $11.1 billion. Analysts expected $0.72 and $11.22 billion, respectively.
CEO James Quincey said:
"Despite some pressure in key developed markets, the power of our global footprint allowed us to successfully navigate a complex external environment."
Coca-Cola Says Operations 'Subject to Global Trade Dynamics'
In an update to its full-year outlook, Coca-Cola said that its "operations are primarily local, however, it is subject to global trade dynamics which may impact certain components of the company’s cost structure across its markets. At this time, the company expects the impact to be manageable."
Technical Outlook
Shares of Coca-Cola ( NYSE:KO ) were down about 1% shortly after the market opened Tuesday. They entered the day up about 15% since the start of the year. As of the time of writing, the stock is up 0.49%.
Albeit earnings missed estimate, the 4 hour price of Coca-Cola shares (NYSE: NYSE:KO ) depicts a golden cross pattern- this is a metric that is generally seen as a bullish reversal with its counterpart known as "Death cross". With the RSI at 51 and the Golden cross pattern, NYSE:KO might be on the cusp of a bullish campaign.

Coca-Cola Company (KO) Shares Trade Near All-Time HighCoca-Cola Company (KO) Shares Trade Near All-Time High
Stock market charts indicate that from the start of last week’s trading through to its close:
→ The S&P 500 Index (US SPX 500 mini on FXOpen) declined by approximately 3%;
→ Pepsico (PEP) shares dropped by more than 1%;
→ Coca-Cola Company (KO) shares rose by around 2.4%.
Why Aren’t Coca-Cola Shares Falling?
The relatively strong performance of Coca-Cola (KO) shares compared to the broader market and its main competitor may be attributed to the fact that Coca-Cola operates a concentrate production facility in Atlanta, USA. In contrast, Pepsico’s equivalent production is based in Ireland. This gives Coca-Cola a potential advantage under the tariff policies pursued by the Trump administration.
Incidentally, according to media reports, Diet Coke is the favourite drink of the US President.
Technical Analysis of KO Stock Chart
In 2025, KO stock has been forming an upward channel, though the current price is approaching key resistance levels:
→ the upper boundary of this ascending channel;
→ the $73 level, above which several successive all-time highs have been formed. However, price action suggests that bulls have so far struggled to establish a foothold above this mark.
It is possible that the upcoming quarterly earnings report, scheduled for 29 April, could provide a positive catalyst for KO’s share price.
This article represents the opinion of the Companies operating under the FXOpen brand only. It is not to be construed as an offer, solicitation, or recommendation with respect to products and services provided by the Companies operating under the FXOpen brand, nor is it to be considered financial advice.

Coca-Cola: As PlannedAs primarily anticipated, Coca-Cola has recently established the peak of wave in magenta just below the resistance at $73.53. The stock then dropped by approximately 5%. We now expect the low of wave in magenta to occur soon, and afterward, wave should bring significant gains, thus completing the large wave III in beige. Our Target Zone for this wave III top lies between $75.42 and $78.88. It provides opportunities to either close existing long positions or to open new short trades.

Coca-Cola: High in Sight?!Coca-Cola has gained around 9% over the past two weeks and should now be approaching the high of the turquoise wave 4. As soon as this top is established (below the resistance at $70.74), we expect sell-offs down to the forecast low of wave (A) in magenta below the support at $60.62. However, if the stock breaks above the resistances at $70.74 and $73.53 during its current upward move, we will consider wave alt.(A) in magenta as complete. In this scenario, the subsequent wave alt.(B) would already be underway, aiming for a high within our beige Target Zone between $75.32 and $80.36 (probability: 39%).

Coca-Cola (KO) Stock Surges Nearly 5% in a DayCoca-Cola (KO) Stock Surges Nearly 5% in a Day
Yesterday, shares of The Coca-Cola Company (KO) saw a significant rally, climbing nearly 5% and reaching a yearly high above $67. The last time KO stock traded at this level was in late October 2024. Investor optimism was fueled by the release of the company’s Q4 financial report, which exceeded expectations:
→ Reported earnings per share: $0.55 vs. expected $0.52
→ Gross revenue: $11.5 billion vs. forecasted $10.7 billion
Additionally, Coca-Cola announced:
→ A substantial market share increase in the non-alcoholic beverage sector and $10.8 billion in free cash flow.
→ Projections for 5–6% organic revenue growth in 2025, highlighting the company’s resilience amid economic uncertainty.
Technical Analysis of Coca-Cola (KO) Stock
At yesterday’s market open, KO formed a large bullish gap, which may act as future support. Meanwhile, price extremes outline an ascending channel pattern.
If optimism persists:
→ The price may move towards the channel median, where supply and demand tend to balance (similar to early 2025).
→ Bears might become active around $69.25, a level that has previously influenced price movements (indicated by arrows).
Analysts' Price Forecast for Coca-Cola (KO) Stock
Following the earnings report, analysts from leading investment firms have acknowledged Coca-Cola’s strong performance, either reaffirming or raising their price targets for KO stock:
→ Citi maintained a "Buy" rating with a $85 price target.
→ Jefferies reiterated its "Buy" rating with a target of $75.
→ UBS kept its "Buy" rating, setting a $72 target.
According to TipRanks:
→ 12 out of 13 surveyed analysts recommend buying KO stock.
→ The 12-month average price target for KO is $72.4.
Trade on TradingView with FXOpen. Consider opening an account and access over 700 markets with tight spreads from 0.0 pips and low commissions from $1.50 per lot.
This article represents the opinion of the Companies operating under the FXOpen brand only. It is not to be construed as an offer, solicitation, or recommendation with respect to products and services provided by the Companies operating under the FXOpen brand, nor is it to be considered financial advice.

Coca-Cola To Report Q4 Earnings Today Ahead of Market OpenCan the Beverage Giant Sustain Its Momentum?
Coca-Cola (NYSE: KO) is set to report its fourth-quarter earnings results on Tuesday, February 11,2025 ahead of the market open. Investors and traders are closely watching the stock, which has already shown premarket strength, rising 0.20% early Tuesday morning. With the Relative Strength Index (RSI) at 60.84, market participants are anticipating a potential bullish continuation, provided earnings results meet or exceed expectations.
Strong Performance in 2023
Coca-Cola, a global leader in the beverage industry, has continued to demonstrate resilience despite economic uncertainties. In 2023, the company reported $45.75 billion in revenue, marking a 6.39% increase from the previous year’s $43 billion. Earnings also saw an impressive 12.28% growth, reaching $10.71 billion. This performance underscores Coca-Cola’s ability to maintain steady growth through product diversification and strategic market positioning.
Analysts remain optimistic about the stock, with 17 analysts giving KO a consensus rating of "Strong Buy." The 12-month price target of $72.18 suggests a potential 11.82% upside from its latest price, reinforcing bullish sentiment ahead of the earnings report.
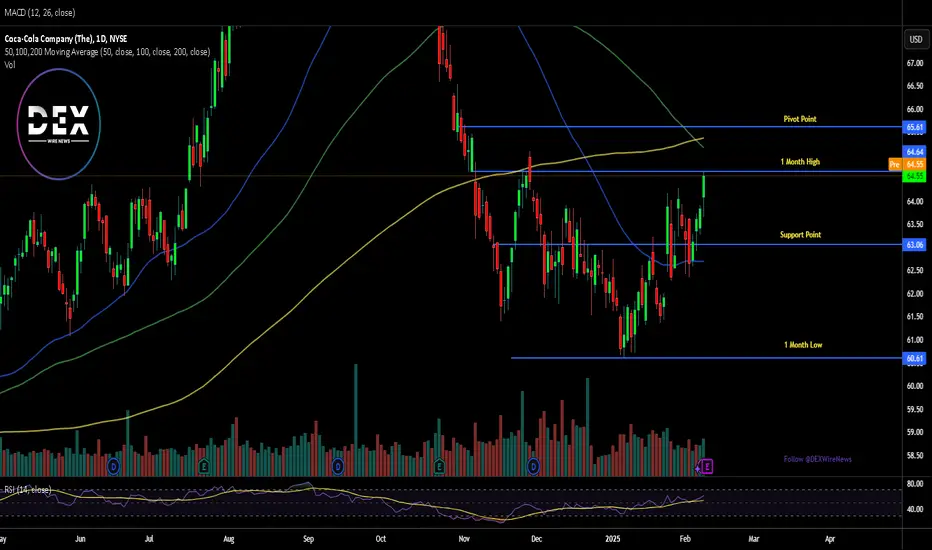
Technical Analysis
As of Tuesday’s premarket session, NYSE:KO is trending upwards, with its price hovering near $65, a key pivot and resistance level. Breaking this barrier could trigger a bullish rally, potentially pushing KO toward higher price targets in the coming weeks.
However, if earnings disappoint, a retracement may be in play, with immediate support aligning with the 38.2% Fibonacci retracement level at $63. This level could serve as a critical point for a potential rebound, should selling pressure emerge following the earnings announcement.
What to Expect Post-Earnings
A strong earnings beat could propel KO further into bullish territory, confirming its upward trajectory and attracting more institutional interest. On the flip side, weaker-than-expected results may lead to a temporary pullback, offering a potential buying opportunity at key support levels.
The Fizz is Back: Coca-Cola's Stock on the Rebound● The price had encountered several resistance points around the $62 mark in the past.
● Once it broke through this barrier, the stock surged to reach a record high of $72.5.
● However, it then faced a significant pullback, dropping approximately 16% before finding support at the breakout area.
● Recently, the price has begun to climb once more, setting its sights on the previous all-time high, with expectations of surpassing it.

coca cola on its way to targetget a buy postion on coca cola stock
we have to see the stop shown in the graph

Coca-Cola: Opportunity of a Lifetime?A quick word on what is going on with Coca-Cola.
It seems like we are seeing the largest correction from the Covid lows in March 2020.
Looking for another leg lower into wave (C) before we could expect some upside.
As always feel free to as questions and leave a like if you enjoy the content!
Trade safe!

Coca-Cola fall back to 1.618Coca-Cola fall back to 1.618
This chart shows the weekly candle chart of Coca Cola Company's stock from the end of 2019 to the present. The graph overlays the bottom to top golden section at the beginning of 2020. As shown in the figure, after peaking at the end of April 2022, the stock of Coca Cola Company broke out of the large triangle fluctuation and consolidation trend. In October 2022, after stepping back on the bottom of the graph to the top of the golden section at 1.382, it also broke out of the triple shoulder position of the head, shoulder, and top! At present, Coca Cola's stock has fallen back to the bottom of the chart, which is 1.618 on the golden section. In the future, this position will serve as the watershed for judging its strength!

Coca-Cola I Potential move to upside Welcome back! Let me know your thoughts in the comments!
** Coca-Cola Analysis - Listen to video!
We recommend that you keep this pair on your watchlist and enter when the entry criteria of your strategy is met.
Please support this idea with a LIKE and COMMENT if you find it useful and Click "Follow" on our profile if you'd like these trade ideas delivered straight to your email in the future.
Thanks for your continued support!

COCA COLA BUYHi, according to my analysis of Coca-Cola stock. There is a good buying opportunity. We notice that the stock came back from a very strong area, which is the strong support at 59, which it could not break several times. All of these things indicate that the stock remains in a very positive state. good luck for everbody

KO - Extremely Bullish State 3M Coca-Cola has currently provided us a great long opportunity on this 3 Month chart
Price has moved up just above the Gaussian Channel
Last time this was seen (the previous strong bullrun) price soared about 4000% over a period of 20 years
Whos in it for the long game?

Coca Cola Analysis / RSI divergence Hello everyone, as we all know the market action discounts everything :)
_________________________________Make sure to Like and Follow if you like the idea_________________________________
The KO stock has been doing great lately, where in the last 2 weeks the price jumped from $54.28 and reached $56.92 today almost a 5% increase.
Both the short-term and long-term trends are positive. This is a very positive sign.
KO is currently trading near its 52 week high, which is a good sign. The S&P500 Index however is also trading near new highs, which makes the performance in line with the market.
KO has an average volume of 14981700. This is a good sign as it is always nice to have a liquid stock.
Possible Scenario for the market :
Looking at how the stock has been doing lately we notice a strong Bullish movement that will lead the stock to the first resistance line at $56.95, if the Bulls were able to push further and breakout that resistance then we could be seeing the stock reaching the $57.92 range by the end of the week.
In case they weren't able to breakout the first resistance then a correction wave will happen that will cause the price to drop back the support line at $56.13.
Technical indicators show :
1) The market is above the 5 10 20 50 100 and 200 MA and EMA (Strong Bullish Sign)
2) The MACD is above the 0 line indicating a Bullish market with a positive crossover between the MACD line and the Signal line
3) The RSI is 64.84 showing great strength. with a small Bullish divergences
Weekly Support & Resistance points :
support Resistance
1) 56.14 1) 57.03
2) 55.67 2) 57.45
3) 55.25 3) 57.92
Fundamental point of view :
Kepler Capital analyst Richard Withagen maintained a Buy rating on Coca-Cola (NYSE:KO) Europacific Partners on Tuesday, setting a price target of EUR59, which is approximately 17.15% above the present share price of $57.8.
The current consensus among 10 TipRanks analysts is for a Moderate Buy rating of shares in Coca-Cola Europacific Partners, with an average price target of $66.65.
The analysts price targets range from a high of $76 to a low of $48.78.
Coca-Cola European Partners (NASDAQ:CCEP) Plc engages in the distribution and sale of ready-to-drink beverages. It operates through the following brands: Coca-Cola, Diet Coke or Coca-Cola Light, Coke Zero, Coca-Cola Life, Fanta, and Sprite. It also offers energy drinks, waters, juices, sports drinks, and ready-to-drink teas. The company was founded on August 4, 2015 and is headquartered in Uxbridge, the United Kingdom.
This is my personal opinion done with technical analysis of the market price and research online from Fundamental Analysts and News for The Fundamental point of view, not financial advice.
If you have any questions please ask and have a great day !!
Thank you for reading.

KO (Coca-Cola Company) Target Price 57.55KO (Coca-Cola Company) show signs of more bullish moves. On the H1, H2, H3, H4, and Daily Chart:
@higher lows were created,
@EMA 10 is above the EMA 20
Charts shown below are H1, H2, H3, H4, and Daily Chart:
@
@
@
@
@
Charts below were the best entry points:
@
@

Coca cola bullies divergence After some new confirmed about CR7 soccer player was only to complete a pattern we can see high divergences in 1h and 2h


COCA COLA LONG WE HAVE REJECTION OF PITCHFORK TREND , AT THE SAME TIME IT'S REJECTING SUPPORT WITH 190 MA , WITH A LONG PIN BAR CANDLE , & IF WE TAKE A LOOK ON FIBO'S IMPORTANT LEVEL WE HAVE STRONG REJECTION , THE RSI IS SHOWING US A KIND OF DIVERGANCE , WICH CONFIRM OUR PROBABILITY , SO BETTER TO TAKE A LONG POSITION ON THIS MARKET , TILL 83,30 & TRAIL STOP THE PROFITS !

SETUP COCA-COLA DAILYHi shareholder friends, I'm you today prepared the analysis of Coca Cola that will not be to buy these next days, I see it for sale. Good luck to you all! Ratio/Risk: 3.12

Coca Cola#InstintoFinanciero
Datos que observo que me llaman la atención:
# Rebote en el 61,8%
# No logra sobrepasar la EMA(200)
# Bajó el volumen
# Presentación de estado de resultado
