“COFFEE CFD Smash-and-Grab: Thieves’ Swing Trade Blueprint!"🚨☕ The Great "COFFEE" Market Heist 🚨💰
🌟Hi! Hola! Ola! Bonjour! Hallo! Marhaba!🌟
⚔️Dear Money Makers & Robbers, 🤑💸✈️
Get ready for the ultimate COFFEE Commodities CFD Market Heist! Based on our 🔥Thief Trading Style combining technical and fundamental analysis, here’s our master plan to snatch profits from the market vault.
💥 The Master Plan:
📉 Entry:
“The vault is wide open! Swipe the bearish loot at any price—our heist is on!”
💸 Use sell limit orders on the 15- or 30-minute timeframe, at the nearest swing high or low levels to lock in the perfect robbery spot. Thief (I"AM) using multiple limit orders (DCA / layering strategy style method of entries).
🛑 Stop Loss:
📌 Set your Thief SL at the nearest or swing high level of candle wick on the 4H timeframe (~313.00) to keep your loot safe.
📌 Adjust SL based on your trade risk, lot size, and multiple entry plan—don’t let the cops catch you!
🎯 Target:
Aim for 260.00 or escape before the target—take the loot and run!
👀 Scalpers’ Tip:
Only scalp on the Short Side! If you’ve got deep pockets, jump in big; otherwise, join swing traders to ride the heist. Use trailing SL to protect your loot.
💣 Market Vibes:
The “COFFEE” CFD market is trapped in bearish territory, fueled by:
🔎 Risky levels
🔎 Oversold zones
🔎 Consolidation
🔎 Trend reversal
🔎 Traps near levels where bullish robbers get strong.
📰🗞️ The Big Picture:
Check out the Fundamentals, Macro, COT Report, Quantitative Analysis, Sentimental Outlook, Intermarket Analysis, and Future Trend Targets to stay one step ahead! 👉👉👉
⚠️ Trading Alert:
News releases can rock the market vault!
🚨 Avoid new trades during big news
🚨 Use trailing SL to lock profits and guard your loot.
💥 Hit the Boost Button!
Supporting our Robbery Plan helps us all steal money with ease! 💰💵 Boost our robbery team’s strength, and trade with the Thief Trading Style to cash in every day. 💪🏆🤝🚀🎉
Stay tuned for our next heist plan—until then, keep those profits safe and stay sharp! 🤑🐱👤🤩
Coffeefutures

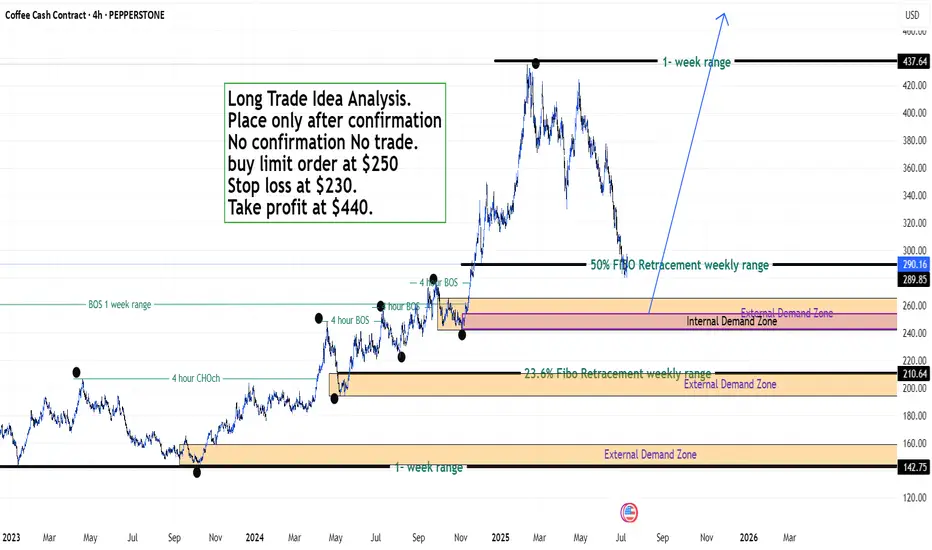
Coffee Trade Analysis - Fx Dollars - {11/07/2025}Educational Analysis says that Coffee (Commodity) may give trend Trading opportunities from this range, according to my technical analysis.
Broker - NA
So, my analysis is based on a top-down approach from weekly to trend range to internal trend range.
So my analysis comprises of two structures: 1) Break of structure on weekly range and 2) Trading Range to fill the remaining fair value gap
Let's see what this Commodity brings to the table for us in the future.
Please check the comment section to see how this turned out.
DISCLAIMER:-
This is not an entry signal. THIS IS FOR EDUCATIONAL PURPOSES ONLY.
I HAVE NO CONCERNS WITH YOUR PROFIT OR LOSS,
Happy Trading, Fx Dollars.
“COFFEE CFD Smash-and-Grab: Thieves’ Swing Trade Blueprint!"🚨☕ The Great "COFFEE" Market Heist 🚨💰
🌟Hi! Hola! Ola! Bonjour! Hallo! Marhaba!🌟
⚔️Dear Money Makers & Robbers, 🤑💸✈️
Get ready for the ultimate COFFEE Commodities CFD Market Heist! Based on our 🔥Thief Trading Style combining technical and fundamental analysis, here’s our master plan to snatch profits from the market vault.
💥 The Master Plan:
📉 Entry:
“The vault is wide open! Swipe the bearish loot at any price—our heist is on!”
💸 Use sell limit orders on the 15- or 30-minute timeframe, at the nearest swing high or low levels to lock in the perfect robbery spot.
🛑 Stop Loss:
📌 Set your Thief SL at the nearest or swing high/low on the 4H timeframe (~380.00) to keep your loot safe.
📌 Adjust SL based on your trade risk, lot size, and multiple entry plan—don’t let the cops catch you!
🎯 Target:
Aim for 315.00 or escape before the target—take the loot and run!
👀 Scalpers’ Tip:
Only scalp on the Short Side! If you’ve got deep pockets, jump in big; otherwise, join swing traders to ride the heist. Use trailing SL to protect your loot.
💣 Market Vibes:
The “COFFEE” CFD market is trapped in bearish territory, fueled by:
🔎 Risky levels
🔎 Oversold zones
🔎 Consolidation
🔎 Trend reversal
🔎 Traps near levels where bullish robbers get strong.
📰🗞️ The Big Picture:
Check out the Fundamentals, Macro, COT Report, Quantitative Analysis, Sentimental Outlook, Intermarket Analysis, and Future Trend Targets to stay one step ahead! 👉👉👉🔗 (Check our bi0 for liinks!)
⚠️ Trading Alert:
News releases can rock the market vault!
🚨 Avoid new trades during big news
🚨 Use trailing SL to lock profits and guard your loot.
💥 Hit the Boost Button!
Supporting our Robbery Plan helps us all steal money with ease! 💰💵 Boost our robbery team’s strength, and trade with the Thief Trading Style to cash in every day. 💪🏆🤝🚀🎉
Stay tuned for our next heist plan—until then, keep those profits safe and stay sharp! 🤑🐱👤🤩
"COFFEE" Commodities CFD Market Bearish Heist Plan (Swing / Day)🌟Hi! Hola! Ola! Bonjour! Hallo! Marhaba!🌟
Dear Money Makers & Robbers, 🤑 💰💸✈️
Based on 🔥Thief Trading style technical and fundamental analysis🔥, here is our master plan to heist the "COFFEE" Commodities CFD Market. Please adhere to the strategy I've outlined in the chart, which emphasizes long entry. Our aim is the high-risk Red Zone. Risky level, overbought market, consolidation, trend reversal, trap at the level where traders and bearish robbers are stronger. 🏆💸"Take profit and treat yourself, traders. You deserve it!💪🏆🎉
Entry 📈 : "The vault is wide open! Swipe the Bullish loot at any price - the heist is on!
however I advise to Place buy limit orders within a 15 or 30 minute timeframe most recent or swing, low or high level. I Highly recommended you to put alert in your chart.
Stop Loss 🛑:
Thief SL placed at the Nearest / Swing low level Using the 4H timeframe (370) Day/Swing trade basis.
SL is based on your risk of the trade, lot size and how many multiple orders you have to take.
🏴☠️Target 🎯: 470 (or) Escape Before the Target
🧲Scalpers, take note 👀 : only scalp on the Long side. If you have a lot of money, you can go straight away; if not, you can join swing traders and carry out the robbery plan. Use trailing SL to safeguard your money 💰.
💰💵💸"COFFEE" Commodities CFD Market Heist Plan (Swing / Day) is currently experiencing a bullishness,., driven by several key factors. .☝☝☝
📰🗞️Get & Read the Fundamental, Macro Economics, COT Report, Sentimental Outlook, Intermarket Analysis, Seasonality, Future trend targets & Overall outlook score..., go ahead to check 👉👉👉🔗🔗🔗
⚠️Trading Alert : News Releases and Position Management 📰 🗞️ 🚫🚏
As a reminder, news releases can have a significant impact on market prices and volatility. To minimize potential losses and protect your running positions,
we recommend the following:
Avoid taking new trades during news releases
Use trailing stop-loss orders to protect your running positions and lock in profits
💖Supporting our robbery plan 💥Hit the Boost Button💥 will enable us to effortlessly make and steal money 💰💵. Boost the strength of our robbery team. Every day in this market make money with ease by using the Thief Trading Style.🏆💪🤝❤️🎉🚀
I'll see you soon with another heist plan, so stay tuned 🤑🐱👤🤗🤩

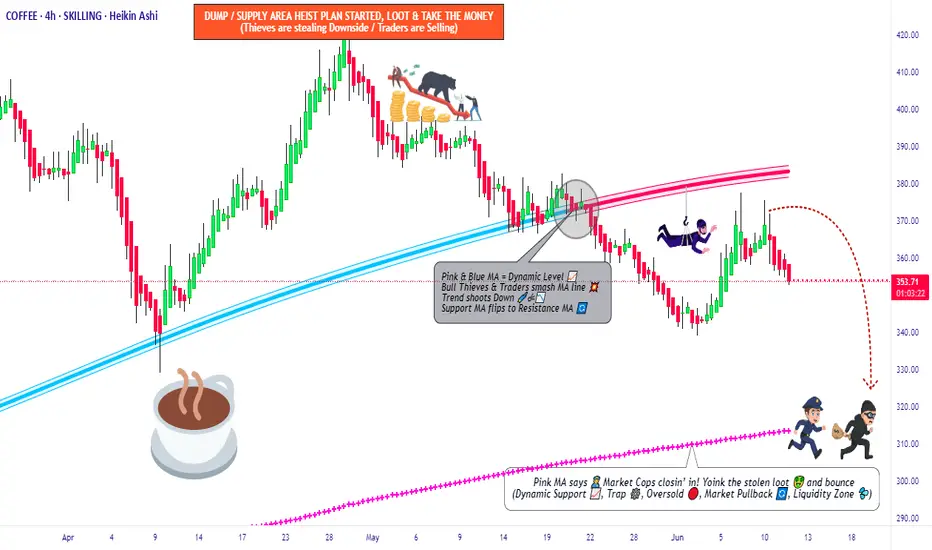
"COFFEE" Commodities CFD Market Bearish Heist Plan🌟Hi! Hola! Ola! Bonjour! Hallo! Marhaba!🌟
⚔Dear Money Makers & Thieves, 🤑 💰✈️
Based on 🔥Thief Trading style technical and fundamental analysis🔥, here is our master plan to heist the "COFFEE" Commodities CFD Market. Please adhere to the strategy I've outlined in the chart, which emphasizes short entry. Our aim is the high-risk Green Zone. Risky level, oversold market, consolidation, trend reversal, trap at the level where traders and bullish thieves are getting stronger. 🏆💸Book Profits Be wealthy and safe trade.💪🏆🎉
Entry 📈 : "The heist is on! Wait for the breakout (370) then make your move - Bearish profits await!" however I advise placing Sell Stop Orders below the breakout MA or Place Sell limit orders within a 15 or 30 minute timeframe. Entry from the most recent or Swing high or low level should be in retest.
📌I strongly advise you to set an alert on your chart so you can see when the breakout entry occurs.
Stop Loss 🛑: Thief SL placed at (400) swing Trade Basis Using the 4H period, the recent / swing high or low level.
SL is based on your risk of the trade, lot size and how many multiple orders you have to take.
🏴☠️Target 🎯: 340 (or) Escape Before the Target
🧲Scalpers, take note 👀 : only scalp on the Short side. If you have a lot of money, you can go straight away; if not, you can join swing traders and carry out the robbery plan. Use trailing SL to safeguard your money 💰.
"COFFEE" Commodities CFD Market is currently experiencing a Neutral trend (higher chance to 🐻🐼Bearishness)., driven by several key factors.
📰🗞️Read the Fundamental, Macro Economics, COT Report, Seasonal Factors, Intermarket Analysis, Sentimental Outlook, Future trend predict.
Before start the heist plan read it.👉👉👉
📌Keep in mind that these factors can change rapidly, and it's essential to stay up-to-date with market developments and adjust your analysis accordingly.
⚠️Trading Alert : News Releases and Position Management 📰 🗞️ 🚫🚏
As a reminder, news releases can have a significant impact on market prices and volatility. To minimize potential losses and protect your running positions,
we recommend the following:
Avoid taking new trades during news releases
Use trailing stop-loss orders to protect your running positions and lock in profits
💖Supporting our robbery plan 💥Hit the Boost Button💥 will enable us to effortlessly make and steal money 💰💵. Boost the strength of our robbery team. Every day in this market make money with ease by using the Thief Trading Style.🏆💪🤝❤️🎉🚀
I'll see you soon with another heist plan, so stay tuned 🤑🐱👤🤗🤩

Coffee Futures Outlook: Potential Corrections Ahead After HistorCoffee futures have experienced a strong upward movement, breaking their all-time high and unlocking Fibonacci-based mirroring and projection targets. However, the manner in which the price reached this level—overextended and distanced from its moving averages—combined with last month’s candlestick signaling selling pressure, suggests a high probability of corrective movements in the coming months. Should a pullback occur, it will be crucial to monitor how the price reacts upon testing the 20-period moving average.

Have you had your coffee yet?We already know that coffee beans have always been one of the most traded commodities in the world, specifically second, so why the sudden interest again?
Figure 1: Summary of World Coffee
In recent years, global consumption has increased at a higher rate than production due to pent-up demand. This rather large deficit in balance in the past two years puts the coffee market in an interesting spotlight. Nonetheless, arabica beans continue to be the more favored selection, with South America as the central production region, driven mainly by Brazil.
Gaining Access to This Market
Amongst various coffee derivatives, a coffee futures contract is the most common way to trade coffee. The 4/5 Arabica Coffee Futures (ICF) listed by Brasil, Bolsa, Balcão (B3) Exchange is an example of such contracts.
For those unfamiliar with futures contracts, it is a legal agreement to buy or sell a specified asset at a predetermined price for delivery at a specified time in the future. For the ICF contract, the asset is 100 bags of 60 kilograms filled with grade 4-25 or better Arabica coffee bean produced in Brazil that is meant to be delivered in the city of São Paulo, Brazil, or a B3 accredited warehouse.
The ICO’s Grading and Classification of Green Coffee states that “coffees of the highest altitudes are denser and larger in size than those produced at lower altitudes.” Loosely speaking, larger beans with higher density are better.
The grade indicators refer to the number of defects found in a 300g sample. To achieve a 4-25 grade, the coffee must be classified by B3 in accordance with its rules and regulations. This grading system is more specific to Brazil-produced beans. Other coffee-producing countries have other specifications and classifications.
The Trampoline Effect
Figure 2: Supply & Demand Factors
Historically, the ICF future prices resemble that of a trampoline, with major support lines at the 124.55 and 103.60 levels. Let us explore some of the factors that caused these jumps previously; bear in mind that consumption of Arabica beans has been steadily increasing since the 1990s.
S1: Poor weather conditions in South America in 2010
Brazil suffered from poor weather conditions and faced significant problems in meeting the expected crop yield. Large producers were also considering hoarding their stocks. The problem was further exacerbated by the backdrop of record low arabica stock levels since the 1960s.
S2: Drought in Brazil in 2014
Similarly, poor weather conditions caused uncertainty in crop production for the harvest year and pushed prices up.
S3: Drought and frost in Brazil 2021
The effects of drought followed by a severe wave of frost in Brazil wiped out its coffee production. This was accompanied by increased freight costs and shipment issues caused by Covid-19.
S4: Harvest Conditions
Evidently, weather conditions pose significant downside risks to the coffee supply. Moreover, occasional coffee leaf rust coupled with increasing demand has caused spikes in coffee prices.
USD and Coffee
Figure 3: ICF and DXY (Inverted)
As with many commodities, coffee tends to move inversely with USD. This is especially so since most coffee contracts, like the ICF, are priced in USD. When the dollar rises, coffee becomes more expensive in non-USD terms and can cause international demand to fall, and vice versa.
Figure 4: ICF and BRLUSD
This relationship becomes more apparent when compared to BRLUSD. Our thought process:
Local Brazilian producers and manufacturers traded these ICF contracts as a hedging tool. During the physical delivery of the beans, these market participants would then have to do a currency exchange. Consequently, the impact of BRLUSD rates would have a larger impact on them.
Similar Coffee Futures Contract
Figure 5: ICF and KC
The two contacts’ underlying assets - arabica beans - have similar grading standards. Consequently, macroeconomic factors are likely to have similar impacts on the two contract prices. The prices between the two contracts exhibit a very strong positive correlation. We can then create a spread with ICF – Coffee C (KC) Futures Contract.
Figure 6: ICF - KC
ICF is quoted USD per bag for a contract size of 100 60kg bags, while KC is quoted USD cents per pound for a contract size of 37,500 lbs. We can then create a spread with ICF1!/60-KC1!/0.4536/100, by converting both contracts to the same base units.
The spread setup indicates that KC generally trades at a premium compared to ICF. This could be attributed to several factors, a notable one being the higher liquidity preference investors tend to have for the KC contract, which might reflect a broader international preference. It is also worth noting that ICF requires Brazil-produced arabica beans, while KC comprises beans from other countries. This could explain the uncanny coincidence between the upside bias in spread movements (Figure 6) occurring in periods identified in Figure 2 – supply-side factors driven mainly from the Brazil side.
Putting into Practice
Enough has been said about coffee; you must be wondering how we then use this information to set up trades. Here are some ways for consideration.
Case Study 1: Directional Driven
By considering current macroeconomic factors on coffee, to express a “quieter” outlook on coffee, an investor could sell the ICF future contract (ICFH4).
At the present level of 206.00, with a stop-loss above 219.00 – a conservative resistant line – it brings us a hypothetical maximum loss of 219.00-206.00 = 13.00 points.
As shown in Figure 2, if ICF1! Reverts to major support line 124.55, a hypothetical gain of 206.00-124.55=81.45 points.
Each ICF futures contract represents 100 bags; the value of each point move is USD100.
However, as we approach the main harvest period for Brazil, May to Sep, it is of paramount importance for the investor to keep a watch for any potential hiccups that could negatively affect the harvest yield. Furthermore, this is likely to be a medium-term macro-driven strategy.
Case Study 2: Spread Driven
Regarding the ICF-KC spread currently trading at the upper bound, an investor with a bearish short-term view that the spread will trend downwards could sell ICF futures contract (ICFH4) and buy KC futures contracts (KCH4).
At the present level of 206.00 and 169.95 for ICFH4 and KCH4, respectively. Following the formula above, the spread will be at –0.31336 points.
Setting the resistance at the Fibonacci 50% ratio, we have a stop loss at -0.25, which brings us a hypothetical maximum loss of -0.25-(-0.31336) = 0.06336 points.
Setting the support at the Fibonacci 38.2% ratio, we set our take profit at -0.40, which brings us a hypothetical gain of -0.31336-(-0.40) = 0.08664 points.
The value of each point move in ICFH4 is USD100, while KCH4 is USD375.
Conclusion
There are various methods to create opportunities for investors, depending on how the investor would like to view the market or what other financial assets to pair up with coffee futures contracts. What we have covered in this article merely scrapes the tip of the iceberg, and we hope investors keep a creative mindset and explore other potential options.
Disclaimer:
The contents of this article are intended for information purposes only and do not constitute investment recommendations or advice. Nor are they used to promote any specific products or services. They serve as an integral part of a case study to demonstrate fundamental concepts in risk management under given market scenarios. A full version of the disclaimer is available in our profile description.

Coffee price keeps the negativity – AnalysisCoffee price provided more negative closings by consolidating below 178.00 resistance, to start reacting to the major indicators by declining towards 159.40, expecting to continue forming negative crawl and attempt to touch 154.00, while breaking this obstacle will extend trades towards 147.10 to face the historical support that appears on the chart, assuring the importance of monitoring its behavior to manage to detect the next main trend.

COFFEE C FUTURES, H4 Potential for Bearish MomentumType : Bearish Momentum
Resistance : 235.2
Pivot: 225.25
Support : 211.40
Preferred Case: On the H1, with price moving below the ichimoku indicator and along the descending trendline, we have a bearish bias that price will drop from our pivot at 225.25 in line with the 23.6% fibonacci retracement and overlap resistance to the 1st support at 211.40 in line with the 161.80% fibonacci extension and swing low support.
Alternative scenario: Alternatively, price may break the pivot structure and rise to the 1st resistance at 235.2 in line with the swing high resistance, 100% fibonacci projection and 78.6% fibonacci retracement .
Fundamentals: Since both countries, Russia and Ukraine, are major exporter of agriculture goods and their persistent war will lead to a shortage of agricultural goods and give us a bullish bias for coffee.

Coffee C Futures ( KC1! ), H1 Potential for Bearish dropType : Bearish Momentum
Resistance : 237.4
Pivot: 229.35
Support : 221.85
Preferred Case: On the H4, with price moving within the ascending channel and price expected to reverse off the stochastic resistance which supports bearish bias that price will drop from our pivot at 229.35 in line with the 100% fibonacci projection and swing high resistance to the support at 221.85 in line with the overlap support, 61.8% fibonacci projection and 23.6% fibonacci retracement.
Alternative scenario: Alternatively, price may break through pivot to the resistance level at 237.4 in line with the 100% fibonacci projection .
Fundamentals: No major news

Coffee C Futures ( KC1! ), H1 Potential for Bullish bounceType : Bullish Bounce
Resistance : 222.25
Pivot: 216.00
Support : 210.80
Preferred Case: With price bouncing off our ichimoku cloud , we have a bullish bias that price will rise to our 1st resistance at 222.25 in line with the horizontal pullback resistance from our pivot of 216.00 in line with the horizontal overlap support and 78.60% Fibonacci retracement .
Alternative scenario: Alternatively, price may break pivot structure and head for 1st support at 210.80 in line with the horizontal swing low support.
Fundamentals: No Major News
Any opinions, news, research, analyses, prices, other information, or links to third-party sites contained on this website are provided on an "as-is" basis, as general market commentary, and do not constitute investment advice. The market commentary has not been prepared in accordance with legal requirements designed to promote the independence of investment research, and it is therefore not subject to any prohibition on dealing ahead of dissemination. Although this commentary is not produced by an independent source, FXCM takes all sufficient steps to eliminate or prevent any conflicts of interest arising out of the production and dissemination of this communication. The employees of FXCM commit to acting in the clients' best interests and represent their views without misleading, deceiving, or otherwise impairing the clients' ability to make informed investment decisions. For more information about the FXCM's internal organizational and administrative arrangements for the prevention of conflicts, please refer to the Firms' Managing Conflicts Policy. Please ensure that you read and understand our Full Disclaimer and Liability provision concerning the foregoing Information, which can be accessed on the website.

Coffee C Futures ( KC1! ), H1 Potential for Bullish bounceType : Bullish Bounce
Resistance : 237.45
Pivot: 222.15
Support : 210.30
Preferred Case: With price moving above our ichimoku cloud , we have a bullish bias that price will rise to our 1st resistance at 237.45 in line with the horizontal swing high resistance from our pivot of 222.15 in line with the horizontal pullback support and 61.8% Fibonacci retracement .
Alternative scenario: Alternatively, price may break pivot structure and head for 1st support at 210.30 in line with the horizontal swing low support and 23.60% Fibonacci retracement .
Fundamentals: No Major News
Any opinions, news, research, analyses, prices, other information, or links to third-party sites contained on this website are provided on an "as-is" basis, as general market commentary, and do not constitute investment advice. The market commentary has not been prepared in accordance with legal requirements designed to promote the independence of investment research, and it is therefore not subject to any prohibition on dealing ahead of dissemination. Although this commentary is not produced by an independent source, FXCM takes all sufficient steps to eliminate or prevent any conflicts of interest arising out of the production and dissemination of this communication. The employees of FXCM commit to acting in the clients' best interests and represent their views without misleading, deceiving, or otherwise impairing the clients' ability to make informed investment decisions. For more information about the FXCM's internal organizational and administrative arrangements for the prevention of conflicts, please refer to the Firms' Managing Conflicts Policy. Please ensure that you read and understand our Full Disclaimer and Liability provision concerning the foregoing Information, which can be accessed on the website.

Coffee C Futures ( KC1! ), H1 Potential for Bullish bounceType : Bullish Bounce
Resistance : 237.45
Pivot: 222.25
Support : 210.00
Preferred Case: With price moving above our ichimoku cloud, we have a bullish bias that price will rise to our 1st resistance at 237.45 in line with the horizontal swing high resistance from our pivot of 222.25 in line with the horizontal pullback support and 61.8% Fibonacci retracement.
Alternative scenario: Alternatively, price may break pivot structure and head for 1st support at 210.00 in line with the horizontal swing low support and 23.60% Fibonacci retracement.
Fundamentals: No Major News
Any opinions, news, research, analyses, prices, other information, or links to third-party sites contained on this website are provided on an "as-is" basis, as general market commentary, and do not constitute investment advice. The market commentary has not been prepared in accordance with legal requirements designed to promote the independence of investment research, and it is therefore not subject to any prohibition on dealing ahead of dissemination. Although this commentary is not produced by an independent source, FXCM takes all sufficient steps to eliminate or prevent any conflicts of interest arising out of the production and dissemination of this communication. The employees of FXCM commit to acting in the clients' best interests and represent their views without misleading, deceiving, or otherwise impairing the clients' ability to make informed investment decisions. For more information about the FXCM's internal organizational and administrative arrangements for the prevention of conflicts, please refer to the Firms' Managing Conflicts Policy. Please ensure that you read and understand our Full Disclaimer and Liability provision concerning the foregoing Information, which can be accessed on the website.

What’s brewing with coffee futures?Like most commodities, London coffee futures saw a massive price uptrend in 2021. However, since the beginning of 2022, it's finally cooled off to an eight and half month low. As a silver lining, perhaps more interesting price action is currently heading our way.
With a very sharp fall during the last two weeks of February it's since consolidated, trading between $2,000 and $2,200 per metric tonne. As of writing, London robusta coffee futures (LRC) are trading at $2,099 per metric tonne.
For London coffee futures, May is typically a ranging month with price starting to pick up towards the second half of June. More often than not, highs of the year are made during the June and July months. However, seasonal trends will be butting up against the possibility that coffee prices are still overextended from 2021’s price hike.
Where could coffee prices reasonably head?
Looking at the daily chart with the Awesome Oscillator indicator, we can see some slight divergence. In spite of its undescriptive name, the Awesome Oscillator details trends and shifts in momentum. On the chart above, can see that the indicator is showing signs of a shifting momentum since the first week of March. With price consolidating, the indicator has slowly crept back up to its zero line, failing to keep correlation to the actual price and trend of the price chart. This could be a suggestion that price may make its way towards June and July highs. If so, the bigger question is if it will actually create the yearly high as well before making its way back down.
In respect to fundamentals, it has been noted that Brazil is currently harvesting a record setting yield of robusta coffee beans. However, the risk of frost hitting Brazil’s crop might not have been priced into its current trading price.
Start trading coffee futures with live and demo accounts today

Coffee C Futures ( KC1! ), H1 Potential for Bullish bounceType : Bullish Bounce
Resistance : 225.40
Pivot: 221.95
Support : 219.75
Preferred Case: With price moving above our ichimoku cloud, we have a bullish bias that price will rise to our 1st resistance at 225.40 in line with the horizontal swing high resistance from our pivot of 221.95 in line with the 23.60% Fibonacci retracement and horizontal pullback support.
Alternative scenario: Alternatively, price may break pivot structure and head for 1st support at 219.75 in line with the horizontal pullback support and 38.20% Fibonacci retracement.
Fundamentals: No Major News
Any opinions, news, research, analyses, prices, other information, or links to third-party sites contained on this website are provided on an "as-is" basis, as general market commentary, and do not constitute investment advice. The market commentary has not been prepared in accordance with legal requirements designed to promote the independence of investment research, and it is therefore not subject to any prohibition on dealing ahead of dissemination. Although this commentary is not produced by an independent source, FXCM takes all sufficient steps to eliminate or prevent any conflicts of interest arising out of the production and dissemination of this communication. The employees of FXCM commit to acting in the clients' best interests and represent their views without misleading, deceiving, or otherwise impairing the clients' ability to make informed investment decisions. For more information about the FXCM's internal organizational and administrative arrangements for the prevention of conflicts, please refer to the Firms' Managing Conflicts Policy. Please ensure that you read and understand our Full Disclaimer and Liability provision concerning the foregoing Information, which can be accessed on the website.

KC1! Coffee Futures Coffee Futures
Held onto the $220 support area , sprung and broke that supply line creating the dragon pattern and maturing into a bearish bat harmonic which has a PCZ of $254

KCK2022 (Coffee Futures) | H4 Bullish BounceType : Bullish Bounce
Resistance : 220.75
Pivot: 211.10
Support : 204.70
Preferred Case: Price is near pivot level of 211.10 in line with 127.20% Fibonacci extension and 61.8% Fibonacci projection. Price can potentially move towards the 1st resistance level of 220.75. Our bullish bias is further supported by stochastic indicator as it is at support level.
Alternative scenario: Price could also head towards the 1st support level of 204.70 in line with 78.6% Fibonacci projection and 138.2%% Fibonacci extension .
Fundamentals: No Major News

KCK2022 (Coffee Futures) | H4 Bearish DipType : Bearish Dip
Resistance : 233.50
Pivot: 221.45
Support : 202.30
Preferred Case: Price is near pivot level of 221.45 in line with 23.6% Fibonacci retracement. Price can potentially dip to the 1st support level of 202.30 which is a swing low support. Our bearish bias is further supported by price moving under the Ichimoku cloud indicator.
Alternative scenario: Price could also head towards the 1st resistance level of 233.50 in line with 38.2% Fibonacci retracement and 61.8% Fibonacci projection.
Fundamentals: No Major News

COFFEE FUTURES (KC1!) Monthly, Weekly, DailyDates in the future with the greatest probability for a price high or price low.
The Djinn Predictive Indicators are simple mathematical equations. Once an equation is given to Siri the algorithm provides the future price swing date. Djinn Indicators work on all charts, for any asset category and in all time frames. Occasionally a Djinn Predictive Indicator will miss its prediction date by one candlestick. If multiple Djinn prediction dates are missed and are plowed through by same color Henikin Ashi candles the asset is being "reset". The "reset" is complete when Henikin Ashi candles are back in sync with Djinn price high or low prediction dates.
One way the Djinn Indicator is used to enter and exit trades:
For best results trade in the direction of the trend.
The Linear Regression channel is used to determine trend direction. The Linear Regression is set at 2 -2 30.
When a green Henikin Ashi candle intersects with the linear regression upper deviation line (green line) and both indicators intersect with a Djinn prediction date a sell is triggered.
When a red Henikin Ashi candle intersects with the linear regression lower deviation line (red line) and both indicators intersect with a Djinn prediction date a buy is triggered.
This trading strategy works on daily, weekly and Monthly Djinn Predictive charts.
Trades made when the monthly, weekly and daily arrows are pointing in the same direction are the most profitable.
This is not trading advice. Trade at your own risk.
