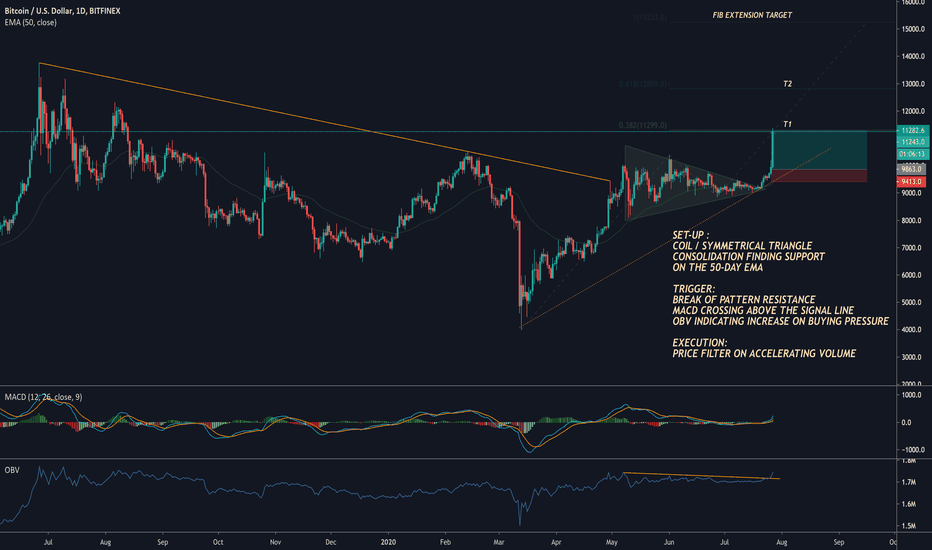
COIL
Bitcoin built a massive bullish CoilBitcoin built a massive bullish Coil if there is an outbreak to the upperside and a retest. The realistic result is a Target with 24300$ and an advanced Target of 47400$. Plus the typically overbuy there could be 50k+.
BUT everytime if a new Line is build you have to rebalance the targets with new Charts Patterns.
Good luck, much fun !
Gnosis (GNOUSD): Coiling Volume.This is a daily chart of GNOUSD on Kraken.
Looks like volume is coiling between an uptrend (green) line and a downtrend (red) line.
Don't be surprised if you see a BIG move at the end of this coiling.
Looking at price, based off of the Fib drawn from the high around $26 and the low around $13,
we see some clear resistance at 0.382, a common area of resistance.
If price can clearly break this resistance along with bullish market structure (i.e double bottom w. breakout),
and volume looks bullish, it's a good call to buy some.
Until then, pay attention.
Longterm Pivot Probability USOIL has been coiling for two weeks now after it hit the 50% retracement point on the whole bull cycle from $26, and almost reached the 23.60% fib extension support based on its first impulse/reaction pivots of the $26 bottom. There are a lot of traders that see these things and most of them will not feel comfortable being exposed to long risk at this point. This in turn will impact the supply side and oil price is more probable to find some respite and orchestrate some sort of a relief rally. It seems reasonable to be looking for a buy setup as the market is still above the bottom and sellers are still unable to push for further lows.
Coiled at end of Triangle with Bullish Stochastic DivergenceThere is divergence playing out on the daily, there is new divergence on the hourly, it is coming out of a downward channel and is currently coiling in a triangle pattern that is looking bullish. Looking for a move to the 200ma.
Buy: 33.50 - 34.00
Stop: 32.30
Target: 38.37 - 43.18
OPXA Tight Coil and Potential BreakoutGreat coil over past 3 months. More recently the trend of higher lows has tightened. Today, on higher relative volume , it closed higher than it has in a month, and outside of coil I've drawn which shows downward trend of closes. Risk to below the new tighter trendline (.99), reward to 1.25/30 minimum based on width of recent tighter coil. In my opinion, based on how tight this coil has gotten over the last 3 months, big volume could send this to test spot before the gap at 1.49
$JCP for the move up?$JCP daily looks bullish to me. Coil break to upside and retest of apex w/ a hammer candle.
Heavily balance on weekly chart.
$MET possible reversal to come$MET broke coil to downside on daily.
However, w/ the .618 fib touch, bounce, and break above the .5 and .382, could see a complete reversal here if we see a break of apex to upside, and still has major MA's above.
Could just be a retest, but gap still open above wedge.


