Bitcoin - An Epic Move Awaits!Bitcoin gained 13% in H1 2025, outperforming Ethereum and Solana, which dropped ~25% and ~17% respectively—highlighting BTC's strength in turbulent market conditions.
Institutional wedge: spot-BTC ETFs saw huge inflows—BlackRock’s took in $336M, and total crypto product inflows approached $45B+ this year.
AI models foresee BTC holding $105K+ by end-June, with ChatGPT pointing to $118K and Grok forecasting $108K, based on momentum and ETF flows.
We see BTC holding the 20 MA and spiking to new all time highs.
COIN-M

ARTY Launch: Play-and-Earn goes live June 30KUCOIN:ARTYUSDT Artyfact (ARTY) is approaching a major milestone, with its Play-and-Earn platform scheduled to launch on June 30. In anticipation, the token is already showing signs of strength, trading around $0.188 and gaining upward momentum. This move comes off a clear technical structure: a double-bottom reversal followed by a breakout above the descending trendline.
Price action is beginning to confirm the shift in sentiment as the official Play-and-Earn tournament kickoff draws near. With just days left until June 30, anticipation is building as the launch will mark a real turning point. Until then, the current pre-launch sentiment continues to lean optimistic, driven by growing community engagement, strong social media traction, and increasing excitement around what Artyfact is building.
The anticipation surrounding the June 30 launch could be creating strong momentum, as traders and early supporters position themselves ahead of what could be a key moment for the project.
From a broader market perspective, Bitcoin continues to lead the risk-on rotation. BTCUSD recently had an aggressive bullish rally and is poised to maintain upward momentum if macro conditions remain favorable.
Historically, Bitcoin strength has preceded major capital inflows into small-cap altcoins. As BTC resumes its bullish trajectory toward the $110,000 zone, it provides ideal conditions for undervalued projects to reprice aggressively. The rotation effect tends to flow from BTC → ETH → high-utility altcoins and ARTY is positioned to benefit from this dynamic.
Fundamentally, ARTY is deeply undervalued relative to its potential.
Low market cap: A micro-cap with asymmetric upside.
80%+ of total supply is in circulation, reducing inflation risk and encouraging organic demand.
Holder base is expanding, reflecting early-stage adoption and network growth.
Major catalysts ahead:
🎮 Launches on PlayStation, Xbox
📱 Releases on AppStore and Google Play
🧩 NFT integration and metaverse gameplay expansion
These milestones could drive exponential user growth, attracting both gamers and crypto enthusiasts to the ecosystem. When combined with the convergence of technical bottoming, bullish macro conditions, and strong fundamental catalysts, the setup supports the potential for a sustained move toward the $1.00 zone as momentum builds post-launch.
Traders should monitor for confirmation:
-Higher low formations
-Expansion in bullish volume
-Strong closes above interim resistances
With BTC strengthening and capital rotating down the risk curve, early entries in fundamentally sound projects like ARTY offer high risk-reward profiles.

Short COINBASE $COINPlease do your own analysis, i am not responsible for your losses. Trading is risky.
This is daily candle, so when will it happen will take time, 1month or 1.5 month...can't know that.
Please don't tell me you traded and lost, you have to be careful.
The price will drop to the target green area..

Coinbase (COIN) Shares Hit Year-to-Date HighCoinbase (COIN) Shares Hit Year-to-Date High
As we reported six days ago, shares of Coinbase Global (COIN) received a strong bullish boost after the US Senate approved the GENIUS bill, which sets out regulations for the use of stablecoins.
As the Coinbase Global (COIN) stock chart shows, the rally is ongoing. Yesterday, the price surged by over 12%, once again becoming the top performer in the S&P 500 index (US SPX 500 mini on FXOpen).
Bullish sentiment is being fuelled by news that:
→ Two funds managed by Cathie Wood’s Ark Invest acquired around 4,200 Coinbase shares;
→ Analysts at Benchmark raised their target price for Coinbase Global (COIN) from $301 to $421.
Could the COIN share price continue to rise?
Technical Analysis of the Coinbase (COIN) Stock Chart
From a broader perspective, the COIN share price has formed an ascending channel over the past year (marked in grey), and only once — in reaction to news about Trump tariffs — did the price briefly fall outside of this channel.
Based on this, it is reasonable to assume that the developing intermediate rally (highlighted in blue) could reach the upper boundary of the grey channel. However, the psychological level of $350 — near the 2024 peak — appears to be a significant resistance point on this path.
It is possible that we will soon see this level act as resistance on the COIN stock chart, leading to the formation of a correction — which would seem appropriate after a nearly 40% price increase since the start of the month.
This article represents the opinion of the Companies operating under the FXOpen brand only. It is not to be construed as an offer, solicitation, or recommendation with respect to products and services provided by the Companies operating under the FXOpen brand, nor is it to be considered financial advice.

BTCUSD : HUGE FALL AHEAD ? Sell at 106200 or below
Stoplos : 113000
Target : 100000, 90000
BTCUSD struggling hard to make new highs. Retest of 90k level expected.

Circle Collapse - Will COIN follow? Circle stock has been on a wild ride lately
After a meteoric rise of over 700% since its IPO on June 5, it's now facing some turbulence:
- Today, the stock dropped nearly 16%, partly due to Cathie Wood’s ARK Invest selling $110 million worth of shares.
- Analysts are also sounding caution. Compass Point initiated coverage with a $205 price target—below its current trading price—citing rising competition in the stable coin space.
- Despite the dip, some still see long-term potential. A recent Forbes analysis explored whether Circle could hit $500 per share, driven by growth in USDC reserves and infrastructure revenue.

COIN- Cup and Handle FormationThere is more to this, but the basic formation is here. Other systems seem to also support the formation (such as Gann, and Harmonics).
There are a few 6 month candles overlaid in the entry to this that I was creating- illustrating the 6 month gains to form the cup. The handle portion did catch me off guard as we are typically use to seeing a cup form at the initial correction, but this one seems to have formed inside of the down move (very interesting).
Lets see how it works out. If true- its 50% gain on the bone here.

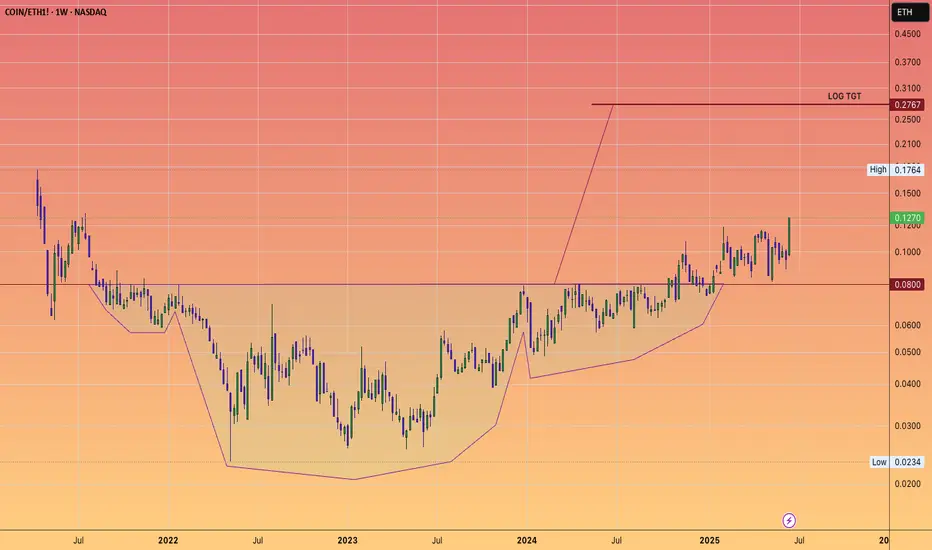
Coinbase Global Inc. Bullish Confirmed Confirms Bullish BitcoinCOIN's chart looks very similar to Ethereum. Today's action reveals something great; bullish confirmed.
Always, since this stock started trading, it has been moving as a unit together with Bitcoin and the entire Cryptocurrency market.
When Bitcoin is bullish, Coinbase is bullish.
When Bitcoin is bearish, Coinbase is bearish and vice versa.
Here we have a very strong, high volume bullish breakout on COIN. This means that Bitcoin, Cardano, Ethereum, XRP, Dogecoin, Avalanche and the rest of the Cryptocurrency market is about to break bullish really strong.
There was a low point 7-April 2025. The same with the projects I just mentioned above.
Here this 7-April low marks a double-bottom compared to September 2024. After this low, the recovery starts and we have a strong rise.
In late May, there is a price peak and we enter a consolidation phase, in this case a small retrace. The chart is identical to ETHUSDT.
After a strong higher low, some minor bearish action with no bearish pressure, Coinbase is going up. You can expect the exact same dynamic happening to Bitcoin and all the Altcoins. Bullish confirmed. The market will resolve green.
Today Coinbase hits the highest price since February 2025.
Namaste.

Coinbase: Surging HigherCoinbase has surged sharply above the $275.90 level, prompting us to consider green wave finished. Now, we see the stock advancing in wave , which still has more upside potential to finalize light green wave a. Afterward, we expect a corrective pullback in wave b, which may dip below $275.90, before green wave c resumes the advance, thus completing orange wave b distinctly above $275.90.
📈 Over 190 precise analyses, clear entry points, and defined Target Zones - that's what we do.

The Chart you don't want to see: Coinbase Vampire attacked ETHBrian Armstrong is a significant influencer in both Silicon Valley and now Washington, D.C., where he is instrumental in shaping legislation and attracting investments that benefit Coinbase and its shareholders.
Vitalik writes blogs and appoints EF directors who appear to have ambiguous gender identities and are quite out there on the spectrum.
Jesse Pollak is yet another astute player who has leveraged ETH's technology to transform BASE into a powerhouse integrating neatly into Coinbase platform for payments and now DEX trading within app.
ETH will thrive.
However, as we've observed, Joe Lubin's return as a public figure to advocate for and steer the future of Ethereum has never been more crucial.
But will it be sufficient to compete with Brian and Jesse? They seem to be operating on a significantly higher plane.
His name is Monero- Despite numerous attempts by various projects to create private coins or tokens, none have succeeded meaningfully.
- Monero is the Bitcoin of the darknet. They can delist it or try to kill it, but Monero is here to stay.
- With rising concerns over privacy and the inevitable push toward CBDCs, the next bullish cycle could drive XMR to a new ATH, $1,000 is a realistic target, not a fantasy.
- Everything you need is in the chart. This is not financial advice, buy only when you believe the time is right.
Happy Tr4Ding !

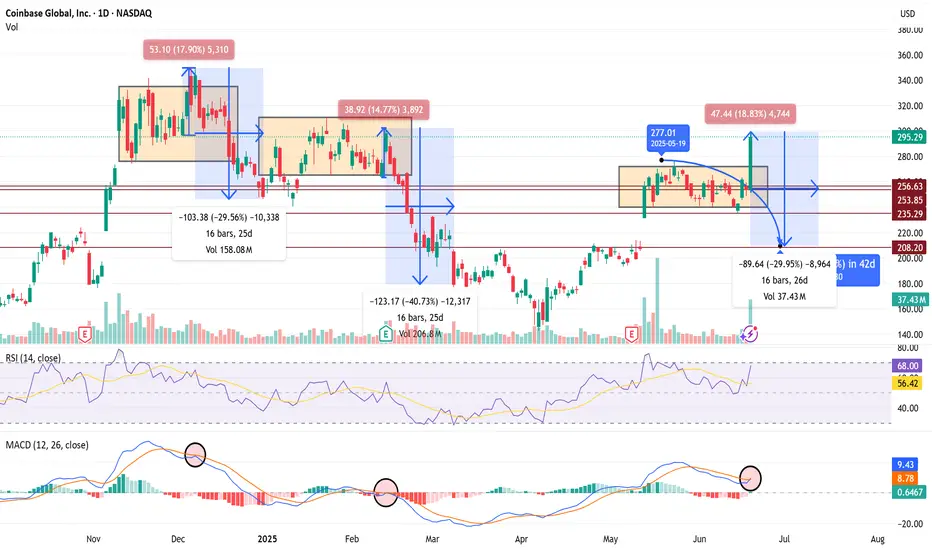
$COIN 30% Pullback Confirms if we Fakeout Recent 15%+ Rally 🧨 COIN SHORT TRADE IDEA — FAKEOUT TRAP IN PLAY
Ticker: NASDAQ:COIN
Date: June 20, 2025
Thesis: Breakout trap setup — expecting a rug pull / red reversal tomorrow to confirm.
🔍 Context
Price broke above range today with a big +18.8% candle to $295 — but...
Volume spike may signal exhaustion, not strength.
RSI = 68 → near overbought
MACD curling into a bearish cross — same signal preceded the last -30% and -40% drawdowns.
History: Same range-break setups in Dec and Feb collapsed hard (-30 to -40%) over 16–25 days.
💣 Trade Plan (Short Setup)
Entry Trigger:
🔻 Enter short if price closes below $277 tomorrow — confirms breakout trap.
Targets:
🎯 Target 1: $253 (top of old range)
🎯 Target 2: $235 (mid-range support)
🎯 Target 3: $208 (full breakdown move, matches last 2 cycles)
Stop Loss:
🛑 Above $297 (breakout highs)
Timeframe:
1–3 weeks (16–26 bars historically)
🧠 Bias
Bearish unless bulls hold $280+. If we get a big red daily candle tomorrow, fakeout confirmed — high-probability follow-through expected.
Ethereum, Bullish Breakout Expected Any Moment Now!Look at this, the first peak for Ethereum happened 13-May after the start of the recovery and the end of the downtrend. The lowest point happened five days later on 18-May and there has been no new lows since. Ethereum has been in a bullish consolidation pattern, a classic bullish flag.
This kind of dynamic clearly reveals a bullish bias and certainly, Ethereum is already trading pretty low compared to its last high.
A new and most interesting signal comes from the stock COIN, for Coinbase. This stock went ahead and produced a very strong bullish breakout yesterday with a green candle reaching +16%. COIN's chart and ETH are almost identical, exactly the same. Since these two move together, we can expect Ethereum to follow suit and do the same. We can expect a bullish breakout to happen any day now. Consolidation has been going long enough. It is time for the market to grow.
Some of the smaller altcoins continue to move forward, this is a signal that should not be ignored.
Namaste.

COINBASE: Is it a guide on how to trade PEPE??Coinbase saw a massive surge yesterday as the Senate cleared the path for stablecoin regulation. This turned its 1D technical outlook almost overbought (RSI = 68.001, MACD = 11.870, ADX = 26.090). Our TP = 348.50 on COIN remains but oddly enough, we see a stronger than expected correlation with PEPE. Since it is now lagging after the Senate decision, this may be a great time to buy PEPE as this pattern shows that soon it will follow Coinbase upwards anf they will converge.
See how our prior idea has worked out:
## If you like our free content follow our profile to get more daily ideas. ##
## Comments and likes are greatly appreciated. ##

Coinbase Shares Rise Following Stablecoin Legislation ApprovalCoinbase (COIN) Shares Rise Following Stablecoin Legislation Approval
Shares in Coinbase Global (COIN) surged by 11% yesterday, making the company the top performer in the S&P 500 index (US SPX 500 mini on FXOpen).
The sharp rise was driven by news that the US Senate has approved the GENIUS stablecoin bill, which sets out a regulatory framework for the use of stablecoins — crypto assets whose value is pegged to another currency or financial instrument, such as the US dollar.
The bill (which still requires approval from the House of Representatives) would pave the way for banks, fintech companies, and other financial market participants to use stablecoins. This development acted as a strong bullish catalyst for COIN shares.
Technical Analysis of Coinbase (COIN) Share Price Chart
In our previous analysis of the COIN share price chart, we:
→ identified an ascending channel (shown in blue);
→ suggested that the COIN share price could rise towards the psychological level of $300.
That projection has played out — the price is now very close to the $300 mark. So, what comes next?
In a bold, optimistic scenario, buyers may hope for a continuation of the rally, with the share price pushing towards the upper boundary of the long-term ascending channel, especially following the recent news. In the medium term, the blue ascending channel may remain relevant, given the strong signal of improved cryptocurrency regulation in the US legislative framework.
However, we also note some vulnerability to a pullback, as:
→ the $300 level may act as significant resistance;
→ the price is approaching the upper boundary of the blue channel, which also shows resistance characteristics;
→ once the initial wave of positive sentiment fades, some investors may look to take profits, especially given the more than 20% rise in Coinbase (COIN) shares since the beginning of the month.
This article represents the opinion of the Companies operating under the FXOpen brand only. It is not to be construed as an offer, solicitation, or recommendation with respect to products and services provided by the Companies operating under the FXOpen brand, nor is it to be considered financial advice.

ANOTHER COVERED CALL ON COINI bought to close my previous one. That is linked below.
I sold for 2.33. BTC for .80 on Friday. With today's LARGE move AND being a retest gap, I will sell another one. TREND is still bullish. Buy dips and hold on!

covered call on COINCryptos are pumping.. Trend is bullish. Moving averages, gaps, volume, everything looks like this should eventually resolve higher.

DOGE/USDTDogecoin is currently in a trading range and could enter a trend if it breaks the upper and lower lines. We'll have to wait and see what happens.

$COIN i following this gann arc quiet nicely!once price breaks the arc it will gravitate to the next one

BTCUSD : SELL IN 4HR CHARTBTCUSD SELL @ 106000 or below
Target : 100000
Stoploss : 107500
BTCUSD formed a perfect sell trend in 4hr chart. I am short on BTCUSD

ApeCoin (APE) Cup Pattern (1D)After a deviation below demand, BINANCE:APEUSDT formed a clean rounded bottom, reclaimed the zone, briefly consolidated, and it's now attempting to break above resistance.
Key Levels
• $0.79: Current resistance
• ~$0.65: Current support, breaking it might lead to the formation of a handle
• $0.50-$0.60: Main demand zone and logical pullback target in case of a handle
• $1.20: Measured breakout target, and previous swing high
Worth watching it closely for a daily close above $0.79 with good volume to activate the target.
Alternatively, look at the $0.50-$0.60 area for a reversal in case of a rejection here.

Bitcoin Brewing - A large move is coming!Bitcoin has been under pressure over the last few trading sessions.
Despite the equity markets going higher this asset is stuck in a holding pattern.
We are currently forming a wedge pattern that has given us a directional bias to trade.
Price action is at a 50/50 in terms of falling lower or rallying higher.
Being the fact that the bulls have been forming higher lows & higher highs, we have to give them due respect.
However understand this BTC is showing some distribution signs and is likely going to have a decent selloff within the next 15-45days. We may have 1 more spike higher but we may not.
1 note of interest is the 7day & 20 day moving average just signaled a bearish crossover which is something you need to monitor closely.
I do think the upside is limited to about 115K if we have 1 more move higher.

Bearish Divergence on Bigger tf
CMP 105228.47 (02-06-2025)
Bearish Divergence on Bigger tf (Cautious
approach should be taken).
However, if 109350 is Crossed, we may
witness 115000 & then 120000 - 121000.
and if 112000 is crossed & sustained, be ready
to get New Highs :-)
Lets be more cautious & dig out 3 Important
Support Levels.
S1 around 103000 - 102500
S2 around 97800
S3 around 93400 - 93500.
