FIL RectangleBINANCE:FILUSDT has been trading in a rectangle since August 2022. It recently below the demand zone, swept liquidity to $2 and regained support.
Key Levels to Watch
• $2.4-$3.0: Support and multi-year demand zone, recently tested and regained.
• $10.5-$11.8: Resistance and multi-year supply zone.
Measured Rectangle Targets
• Breakout: $20.0, also a support dating back to December 2020.
• Breakdown: $0.5
Filecoin is still lagging behind other alts, but, if you're looking for something you don't need to chase, it could already offer a nice long entry, with interesting R/R and a clear invalidation (lower low below $2.0).
Coin

PIUSDT Daily Technical AnalysisPIUSDT Daily Technical Analysis
Pi Network Coin indicators are POSITIVE.
On April 14th, Pi Network Coin faced a strong sell-off after failing to break above the 21-day moving average (0.75121), dropping down to the support level at 0.59073 before attempting to recover. If this support holds, it may test the 21-day moving average (now at 0.71713) again. If it can rise above this level, it will also break through the 0.69100 resistance at the same time. Overall, we can say that Pi Network Coin has halted its downtrend and increased the probability of a new upward move. Positive news from the Pi Network team could support a price increase. At these price levels, accumulating Pi Network Coin for long-term investment might be a reasonable decision. The final decision is yours. In the medium term, there's also a possibility that Pi Network Coin could retest the $3 level.
For users of the Pi app who have locked coins, if there's no urgent need, they can choose to relock their coins for another 2-week period instead of selling. They can then track the price every two weeks and decide to relock again if appropriate. The long-term potential for the price to reach much higher levels still remains strong.
THIS IS NOT INVESTMENT ADVICE.
The information, comments, and recommendations here do not constitute investment advice. Investment advisory services are provided within the framework of an agreement to be signed between the investor and brokerage firms, portfolio management companies, or non-deposit-taking banks. The content shared here reflects only personal opinions. These views may not be suitable for your financial situation, risk, and return preferences. Therefore, no investment decisions should be made solely based on this content.
If you'd like to avoid missing out on our technical analyses with positive or risky indicators, please follow and like us — we'd appreciate your support!

PIUSDT Daily Technical AnalysisPIUSDT Daily Technical Analysis
Pi Network Coin indicators are POSITIVE.
After experiencing a sharp decline, Pi Network Coin started showing sideways price movements following the positive action on April 5. Currently, it is trading above the support level of 0.5087. With today’s positive movement, a slight increase in volatility is also observed. If the positive sentiment in the cryptocurrency market continues, Pi Network Coin is likely to show upward movement as well. For stronger support and bullish momentum, it is important for the coin to break through the resistance levels at 0.6910 and 0.7711. Additionally, if it can break above the 21-day moving average around 0.8060, it may gain strength in the medium term and potentially reach back to the $1 level.
THIS IS NOT INVESTMENT ADVICE
The information, opinions, and suggestions here do not constitute investment advice. Investment advisory services are provided through an agreement between the investor and authorized institutions such as brokerage firms, portfolio management companies, and non-deposit banks.
The content on this page reflects personal opinions only. These views may not be suitable for your financial situation or your risk and return preferences. Therefore, no investment decisions should be made based solely on the information and writings on this page.
To avoid missing any of our analyses with positive or risky technical indicators, feel free to follow and like us — we would really appreciate it!

ARTY coin is in the bottomARTY has bottomed out and appears very undervalued, making it an excellent entry point. I’ve already bought ARTY, as the current price of $0.2685 (as of April 15, 2025) presents a strong opportunity. The chart shows a clear break above a long-term descending trendline, labeled "a broken trendline," signaling a potential reversal. The price is now testing resistance around $0.420, with a projected target of $1.107 during a bull run, as indicated by the arrow on the chart. The Ichimoku Cloud also shows ARTY trading above the cloud, a bullish signal, while the RSI at the bottom is trending upward, indicating growing momentum.
Additionally, ARTY’s market cap is very low, with 80% of its total supply already in circulation. The number of ARTY holders is steadily increasing, reflecting growing interest. Artyfact has significant upcoming milestones, including launches on PlayStation, Xbox, AppStore, and Google Store, which are expected to attract millions of users and drive substantial growth.
This setup, combined with the fundamental catalysts, makes ARTY a compelling investment at this stage.

Long Coinbase as a proxy bet on Crypto until end of yearUntil proven otherwise I must be under the assumption that the worst is behind us for the time being. That being said, more debasement is infinitely more likely than less, so long risk assets.
-looking for a lovely retest of the broken downtrend, coinciding with a nice support level within the next 30 days. This has to be a buy for me (in the green box).
-looking to close position late this year (likely December)

One-trick Pony Club pumped and dumped`If you wonder how much all the monkey pictures are REALLY worth, you should check YouTube video:
"Right Clicking All The NFTs"
by Coffeezilla
with 1,399,517 views
uploaded on 21 Dec 2021
The story of sh1tcoins (Bored Ape Yacht Club and all the rest):
Once upon a time, a rich man from the city arrived in a village. He announced to the villagers that he would buy Monkeys for 100 each.
The villagers were very happy, after all there were hundreds of Monkeys in a nearby forest. They caught the Monkeys and got them to the rich man. He bought hundreds of Monkeys and paid 100 for every Monkey the villagers gave him. They began to make a living out of getting Monkeys from the forest and selling it to the rich man.
Soon, the forest began to run out of monkeys that were easy to catch.
Sensing this, the rich man offers 200 for every monkey. The villagers were ecstatic. They went back to the forest, set up traps and caught the monkeys and got them to the rich man.
A few days later, the rich man announced he would pay 300 per monkey. The villagers began climbing trees and risking their lives to catch monkeys and get them to the rich man – who bought them all.
There were no Monkeys left in the forest!
One day, the rich man announced he would like to buy more monkeys – this time for 800 each.
The villagers couldn’t believe this. They were desperately trying to get more monkeys..
Meanwhile, the rich man said he had to go back to the city on some business work and until he returns his manager would deal on his behalf.
Once he left, the villagers were unhappy. They were making quick and easy money from selling monkeys, but the forest no longer had monkeys.
This is when the manager of the rich man stepped in. He made an offer the villagers could not refuse. Pointing out to all the monkeys that the rich man had caged. He told the villagers he would sell the monkeys for 400 each.
“Sell them back to the rich man at 800 each when he comes back” the manager said.
The villagers were over the moon. Buy for 400 and sell for 800 in few days. They had just found the easiest way to double their money. The villagers collected all their savings and even borrowed money. There were long queues and within a few hours, almost all the monkeys were sold out.
Unfortunately, their happiness did not last long, as the manager went missing the next day and the rich man never came back.
Many villagers kept the monkeys with them, hoping the rich man would come back. But soon, they lost hope and had to let the monkeys back into the forest as feeding and taking care of the noisy monkeys became extremely difficult.

Coinbase Global, Inc. Goes Bullish —The Correction Is Over!COIN's bearish volume peaked November 2024. Ever since this date, peak bearish volume continued to drop. As we approached today, the lowest price since February 2024, COIN ended up closing with a green bar rather than a red one; the bears are gone.
I am giving you technical analysis in a very simple way. When volume and price produce a divergence, it means that we are on the verge of a change of trend.
Coinbase found support just below the September 2024 low. This support is also a long-term higher low compared to February 2024.
The correction was big and strong. Lasting more than 4 months and reaching almost 60%. A huge drop, but the market never drops forever, it never moves in one single direction, it moves in waves.
Did you enjoy the bearish wave? Did you suffer through this wave?
No problem, after a bearish wave comes a bullish wave. The good news is that the bearish wave lasted 4 months but the bullish wave will go for 8-12. That's a great deal. Go down 4 months and then growth for 8 months straight.
Coinbase is preparing to grow, together with Bitcoin, NVIDIA and the Stock market.
The bears are out. We will gain control of the market. It is the bulls turn. We are going up.
Namaste.

whats new? trump for kingi got an alert at 130 and a boner for 103
waiting on word on April 9th... fomc decision
no reason shit gonna start pumping (currently), ya kno?!.

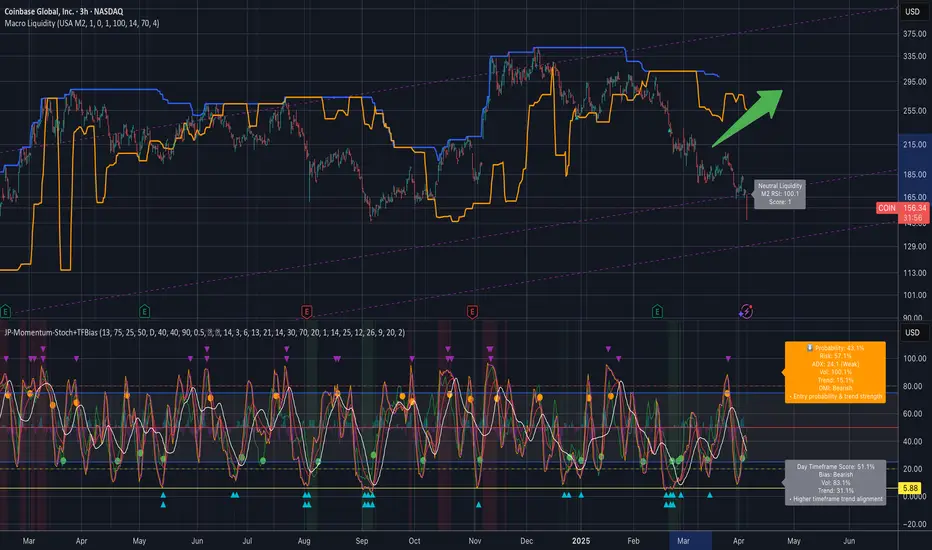
i missed the target before -30% i'd like to offer you The Bottomt's awkward when 'all models are wrong, some are merely useful' when i called 'the fear is in the streets' with a buy action forward. boy was i wrong (and so paid the price for that call)
but with -30% additional downside i've been stalking this patiently.. and +/- 5% diff i think This is it a good bottom as any now (you cant ever time them right) but merely highER probability of the bottom
Here is why.
Overall Price Action
• COIN appears to be trading within a broad upward‐sloping channel since last year’s lows, though recent sessions show a pullback from the high‐$300s down to the mid‐$100s.
• The stock has been staging multi‐month rallies followed by pronounced corrections, indicating that volatility remains high.
Short‐Term (Days to ~2 Weeks)
• Current Bias: Bearish/Consolidation - stay cautious
Reasoning: Momentum indicators (e.g. the stochastic overlays) are in lower ranges or rolling over from mid‐levels, and the daily timeframe readout references a bearish tilt with relatively weak trend strength (low ADX, sub‐50% probability).
Key Levels:
• Immediate Support: Around ~150–145 (a break below opens room toward ~130–125).
• Short‐Term Upside: A rebound and close above ~165–170 would help neutralize the immediate downtrend and could invite a bounce toward ~180.
• Confidence: Moderate (about 50%) given the mixed signals on momentum and the broader market volatility.
Near‐Term (2–6 Weeks)
• Current Bias: Cautiously Bullish if support holds; risk of deeper pullback if ~145 fails
Reasoning:
• The purple channel on the chart suggests that price may still be in a rising structure overall.
• If COIN defends that lower‐channel region near 130–150 and momentum begins to turn, a bounce toward the mid‐$180s or even low‐$200s is plausible.
• Conversely, if broader crypto markets or equities weaken further, the stock could see a retest of the lower trend boundary around the low‐$100s.
Key Levels:
• Upside Targets: ~185, then ~200–210 as a bigger pivot.
• Downside If Support Breaks: ~120–130.
• Confidence: Moderate (around 60%) on a bounce scenario, but keep watch for major support to confirm.
Long‐Term (6+ Weeks to Multiple Months)
Current Bias: Constructive but Volatile
Reasoning:
• The broader up‐channel hints COIN may be in a longer‐term recovery cycle from 2022 lows, but large swings remain likely due to the stock’s sensitivity to crypto sentiment.
• Sustained closes above ~$200–210 would solidify the bullish structure and open the door toward the mid‐$200s, possibly higher if the channel holds.
• A breakdown below ~$120 would negate the broader uptrend and suggest a return to deeper support in the double‐digit zone.
Key Levels:
• Main Resistance: ~250–270 (top portion of the channel if momentum truly resurges).
• Deep Support: ~100–120, critical to maintain a longer‐term bullish outlook.
• Confidence: Moderate‐Low (roughly 50%) given macro uncertainties; confirmation of trend strength would come from multiple weekly closes above or below these key thresholds.
So what do i think? its about Time-in-The-Market, not Timing-The-Market
The Bottom Line
Short Term : Leaning bearish unless price reclaims ~165–170.
Near Term : Watch ~145 and ~130–135 as critical support—if those levels hold, a push toward the high‐$100s is plausible.
Long Term : The up‐channel remains in play, but a break below ~120 would undermine the bullish structure. Upside targets could extend into the mid‐$200s if broader momentum and crypto sentiment remain supportive.
Opening (IRA): COIN March 21st 220 Covered Call... for a 215.96 debit.
Comments: High IV + weakness. Selling the -85 delta call against shares to emulate the delta metrics of a 16 delta short put, but with the built-in defense of the short call. Going lower net delta due to the shorter duration (35 DTE).
Metrics:
Buying Power Effect/Break Even: 215.96/share
Max Profit: 4.04
ROC at Max: 1.87%
50% Max: 2.02
ROC at 50% Max: .94
Will generally look to take profit at 50% max, roll out short call if my take profit is not hit.

TURBO long-term outlookAfter completing its first cycle TURBO seems to stabilize around the 0.0010-0.0020$ region which marks the last ATH from 2023. What's interesting here is that TURBO follows the DOGE coin pattern levels almost to a T, in speedrun mode. It is absolutely not the same structure but it respects the same trading ranges and shows a lot of similarities, which is quite remarkable.
Watch out for this yearly trendline in the TURBO chart and expect some volatility for the next months. Breaking under 0.0010$ could potentially confirm a longer downtrend if we don't see a big impulsive bounce to the upside in the near future.

Coin geometry 3 hours chart going up in whilethis is slight update to the previous video about coin
it will continuum down in the channel for while
then rally up for long term traders

KANGO TO THE MOON! TECHNICAL ANALYSIS🔸 Chart Pattern: Falling Wedge Formation
KANGO has been trading inside a well-defined falling wedge, a classic bullish reversal pattern that often signals a potential breakout after sustained downtrend pressure. The price is nearing the apex and has started to show signs of bullish momentum, testing the upper resistance of the wedge.
🔸 Key Technical Highlights:
Support Zone: 0.00001200 – 0.00001800 USDT
Resistance Zone: 0.00010000 – 0.00018000 USDT
Breakout Trigger: A confirmed breakout above 0.00002000 USDT with volume confirmation
🔸 Indicators:
VMC Cipher B: Bullish divergence detected, momentum turning green, indicating hidden buyer strength
RSI (14): 45.43 and climbing – neutral territory, leaving room for a strong upward move
MFI (Money Flow Index): Currently at 56, suggesting renewed accumulation and capital inflow
Stochastic RSI: Oversold (~20), pointing to an imminent bullish crossover
🔸 Volume Analysis:
A visible volume squeeze is occurring; a spike in volume could catalyze a breakout and rapid price appreciation.
🚀 KANGO TO THE MOON 🔥
🎯 Falling wedge pattern? Check. Bullish divergence? Check. Meme coin magic? DOUBLE CHECK.
KANGO is locked, loaded, and ready to blast off! After months of consolidation, it's tightening the coil inside a textbook falling wedge, and the breakout zone is just a breath away. With bullish momentum building and the community revving up, all eyes are on KANGO to flip resistance into launch fuel. 🌕🚀
From stealth mode to beast mode – the KANGO ROCKET is warming up.
📈 Eyes on the 0.00002000 zone – a clean break here and it’s liftoff time!
🔥 If you're not strapped in yet, this might be your final boarding call.
👉 KANGO isn't just a meme. It's a MOVEMENT.

MUBARAKUSDT Hourly Technical AnalysisMUBARAKUSDT Hourly Technical Analysis
Mubarak Meme Coin has shown a positive breakout in the 1-hour technical analysis, breaking above the 0.13552 resistance level. Currently, it has broken above the 0.15057 resistance and surged up to 0.16595 resistance, increasing the risk of potential profit-taking sales. If profit-taking occurs, a pullback towards the 21-day price average (around 0.45057) may happen. Indicators are at peak levels, and slight downward movements in a partially negative direction can be observed.
Changpeng Zhao (CZ) still supports this coin. A vote is currently ongoing for its listing on Binance, and the results will be announced soon. This movement is creating a positive sentiment for now. If the listing vote results are positive, it could positively impact the price.
NOT INVESTMENT ADVICE.
The information, comments, and recommendations provided here do not constitute investment advice. Investment advisory services are offered within the framework of an agreement between clients and brokerage firms, portfolio management companies, and non-deposit banks. The content on this page reflects only personal opinions. These views may not be suitable for your financial situation, risk tolerance, or return preferences. Therefore, investments should not be made based on the information and writings on this page.
To avoid missing our analyses of both positive and risky technical indicators, follow us and like our content—we would appreciate it!

NILUSDT Hourly Technical AnalysisNILUSDT Hourly Technical Analysis
Nillion Coin is experiencing selling pressure below the 21-day moving average in the 1-hour technical analysis. Currently, it is trying to recover after forming support at 0.5441. The decline in Bitcoin has also affected Nillion Coin. Indicators are partially positive and moving in a neutral position. For NILUSDT to recover, it needs to break above the 21-day moving average and surpass resistance levels.
NOT INVESTMENT ADVICE.
The information, comments, and recommendations provided here do not constitute investment advice. Investment advisory services are offered within the framework of an investment advisory agreement signed between investors and brokerage firms, portfolio management companies, or non-deposit banks. The opinions expressed on this page are solely personal views. These views may not be suitable for your financial situation, risk tolerance, or return preferences. Therefore, no investment decisions should be made based on the information and statements provided on this page.
To stay updated on our analyses, whether positive or risky based on technical indicators, we would appreciate it if you follow and like us.

Worldcoin $WLD Child Sam Altman (CEO of OpenAI) Worldcoin Project Analysis
Worldcoin is a cryptocurrency aimed at providing secure global economic access through innovative technology, primarily utilizing iris biometric identification. Co-founded by Sam Altman(CEO of OpenAI) , the project merges AI, blockchain, and decentralized finance for identity verification and equitable economic participation.
Key Innovations
Iris Biometric Technology : Unique method of online identity verification, addressing identity fraud concerns.
Layer 2 Ethereum Solution : Enhances transaction speed and security within the crypto landscape.
World ID and Orb: Users get a digital identity with unique IrisHash, promoting human verification against systems designed to prevent Sybil attacks.
Market Forecasts
Long-term Growth Potential: Analysts suggest potential price increases, a maximum of $6$, until the end of 2025
Current Market Condition: Despite innovations, Worldcoin’s WLD token is trading at an all-time low, emphasizing market volatility.
Regulatory Challenges
Privacy Concerns: Investigated in multiple countries for data protection, raising ethical questions regarding biometric data usage.
I mpact on Market Launch: Ongoing regulatory scrutiny may delay the global rollout, particularly in the US.
Investment Outlook
Pros:
- Innovative approach offers unique value in the crypto space.
- Significant token allocation for community support adoption.
- Focus on security enhancements and compliance could improve market perception.
Cons:
-Regulatory investigations may impact growth and trust.
-Current low market performance showcases potential investor skepticism.
-Ethical concerns surrounding biometric data handling may deter users.
Conclusion: Worldcoin holds significant long-term growth potential due to its innovative identity verification technology and economic paradigm shift towards equitable participation. However, market conditions, regulatory challenges, and privacy concerns pose serious investor risks. Monitoring regulations and technological developments will be crucial for potential investors in navigating this complex landscape.
Best regards EXCAVO

MUBARAKUSDT Hourly Technical AnalysisMUBARAKUSDT Hourly Technical Analysis
In the 1-hour technical analysis of the newly listed Mubarak Meme Coin, it is moving at the same level as the 21-day price average. Indicators are positive, and the price is consolidating in a sideways range, fluctuating between 0.130 - 0.150.
This meme coin is supported by CZ and is currently undergoing a voting process on Binance. CZ has shown his support for this meme coin by wearing the traditional Arab outfit featured in the coin's symbol in his social media posts. In short, since MUBARAK coin has a potential chance of getting listed on Binance in the future, the probability of positive price movements is high.
THIS IS NOT INVESTMENT ADVICE.
The information, comments, and recommendations provided here do not constitute investment advice. Investment advisory services are offered within the framework of an investment advisory agreement signed between the investor and brokerage firms, portfolio management companies, or non-deposit banks. The content on this page reflects only personal opinions and may not be suitable for your financial situation, risk tolerance, or return expectations. Therefore, no investment decisions should be made based on the information and statements provided here.
To stay updated on our analyses with both positive and risky technical indicators, please follow and like our page. Your support is greatly appreciated!

PIUSDT Daily Technical AnalysisPIUSDT Daily Technical Analysis
Pi Network Coin indicators are NEGATIVE. The selling pressure on Pi Coin is still ongoing. Indicators are at a low position but still appear negative. If it can move sideways above the 0.92957 support level, the chances of recovery in the coming days may increase. The 0.92957 - 0.858 price levels are important support points.
It seems that the Pi Network team is somewhat weak in social communication. The applications created on the platform are still inactive, and the KYC period for users who joined before the Mainnet has now expired. There has been no explanation regarding the coins removed from accounts, or at least, we haven't seen one. In fact, no statement has been made on their YouTube channel either. If the coin does not break below these support levels, it could create a buying opportunity for positive price movements in the future. There is currently no clear information, so we will see how things develop.
NOT INVESTMENT ADVICE.
The information, comments, and recommendations provided here do not constitute investment advice. Investment advisory services are offered within the framework of an agreement between clients and brokerage firms, portfolio management companies, and non-deposit banks. The content on this page reflects only personal opinions. These views may not be suitable for your financial situation, risk tolerance, or return preferences. Therefore, investments should not be made based on the information and writings on this page.
To avoid missing our analyses of both positive and risky technical indicators, follow us and like our content—we would appreciate it!

PIUSDT Hourly Technical AnalysisPIUSDT Hourly Technical Analysis
In the 1-hour technical analysis of Pi Network Coin, the selling pressure continues as it failed to break the 1.21 resistance. The price has dropped to the 1.0770 support level. If this support is also broken downward, the next support levels are 1.031 - 1.010. Our current expectation is negative. Next week, we may shift to daily technical analysis since daily technical data is also becoming clearer. However, for now, the daily outlook also appears negative. If there are sharp declines, buying at lower prices could create a potential for significant long-term returns.
THIS IS NOT INVESTMENT ADVICE.
The information, comments, and recommendations provided here do not constitute investment advice. Investment advisory services are provided within the framework of an investment advisory agreement signed between the investor and brokerage firms, portfolio management companies, or non-deposit banks. The content on this page reflects only personal opinions and may not be suitable for your financial situation, risk tolerance, or return expectations. Therefore, no investment decisions should be made based on the information and statements provided here.
To stay updated on our analyses with both positive and risky technical indicators, please follow and like our page. Your support is greatly appreciated!

COINBASE This is the time to buy and target $400Coinbase Global (COIN) has been trading within a Channel Up pattern since the March 25 2024 High, so effectively a whole year. In the past 10 days it has been consolidating on top of the 1W MA100 (red trend-line), which is the natural long-term Support of the market.
During the same time it entered the Mayer Multiple Bands (MMB) Buy Zone, consisting of the 3 SD (green trend-line) and 2 SD (blue trend-line) below levels, which has given the ultimate buy signals since the January 2023 market bottom. Practically, the stock is consolidating within the 2 SD below and 1W MA100, a tight buy range.
Given the symmetry of the Channel Down Bearish Legs (both -48.39%), we expect a similar symmetry on its Bullish Legs too. Since the previous one reached the 1.236 Fibonacci extension, we are confidently targeting $400 before this Cycle tops. That would also make a perfect entry within the MMB Sell Zone that consists of the Mean MM (black trend-line) and 1 SD above (grey trend-line).
Notice also how the 1W RSI touched the Support of the September 06 2024 Low.
-------------------------------------------------------------------------------
** Please LIKE 👍, FOLLOW ✅, SHARE 🙌 and COMMENT ✍ if you enjoy this idea! Also share your ideas and charts in the comments section below! This is best way to keep it relevant, support us, keep the content here free and allow the idea to reach as many people as possible. **
-------------------------------------------------------------------------------
💸💸💸💸💸💸
👇 👇 👇 👇 👇 👇

$TRUMP ─ @realDonaldTrump Long Trade SETUP$TRUMP ─ @realDonaldTrump Long Trade SETUP 👀
Looking for another long trade entry.
⚠️If the Twin OB fails, then a new low is on the table.
ENTRY = TwinOB + FibFan + nPOC + Fib Golden Pocket + WO + DO
SL = below VAL + TwinOB
------------
------------
As always, my play is:
✅ 50% out at TP1
✅ Move SL to entry
✅ Pre-set the rest of the position across remaining TPs
It's important to take profits along the way and not turn a winning trade into a losing trade.

the Head and Shoulders of the Month!Hello TradingView Family / Fellow Traders. This is Richard, also known as theSignalyst.
📈 This week, XRP rejected the $2 support level and has been trading higher.
Today, XRP formed an inverse head and shoulders pattern and broke its green neckline upward.
🏹 As long as the bulls hold, a movement towards the upper bound of the falling red channel would be expected.
📚 Always follow your trading plan regarding entry, risk management, and trade management.
Good luck!
All Strategies Are Good; If Managed Properly!
~Rich

#ZECUSDT #1D (Binance Futures) Descending channel breakoutZcash broke-out printing a morning star, looks good for recovery towards 100EMA resistance.
⚡️⚡️ #ZEC/USDT ⚡️⚡️
Exchanges: Binance Futures
Signal Type: Regular (Long)
Leverage: Isolated (2.0X)
Amount: 5.9%
Current Price:
36.12
Entry Zone:
36.05 - 33.55
Take-Profit Targets:
1) 41.83
1) 47.12
1) 52.42
Stop Targets:
1) 28.92
Published By: @Zblaba
SEED_DONKEYDAN_MARKET_CAP:ZEC BINANCE:ZECUSDT.P #1D #Zcash #Privacy z.cash
Risk/Reward= 1:1.2 | 1:2.1 | 1:3.0
Expected Profit= +40.4% | +70.8% | +101.3%
Possible Loss= -33.8%
Estimated Gaintime= 1-2 months
