Comex
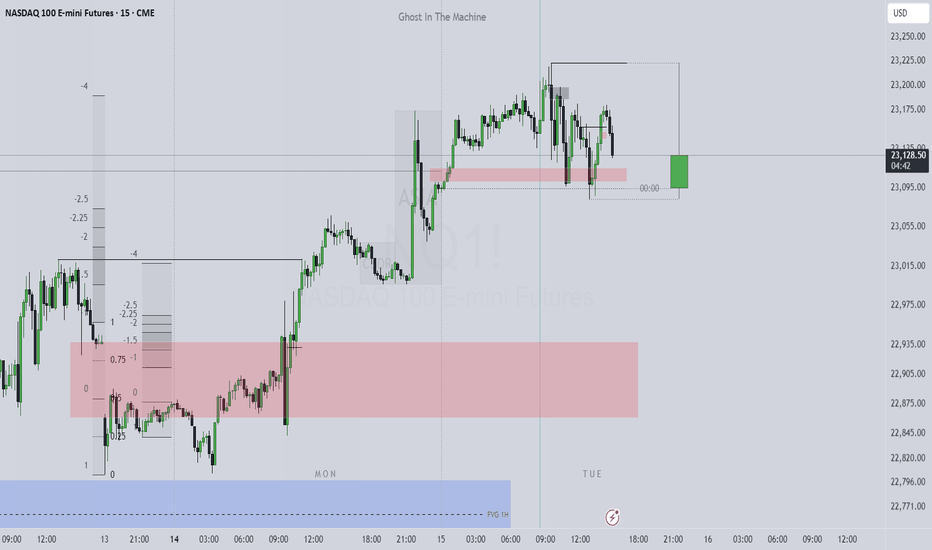
Nasdaq 100. Mistakes and Daily Orderflow 27.05.25Covered the mistakes that I have made while reading the price. Wanted the shorts although the daily and the 4H suggested bullish price action. The good think was didn't forced. Just left the market after booking partials and breakeven
Post that took one long towards the Volume Imbalance
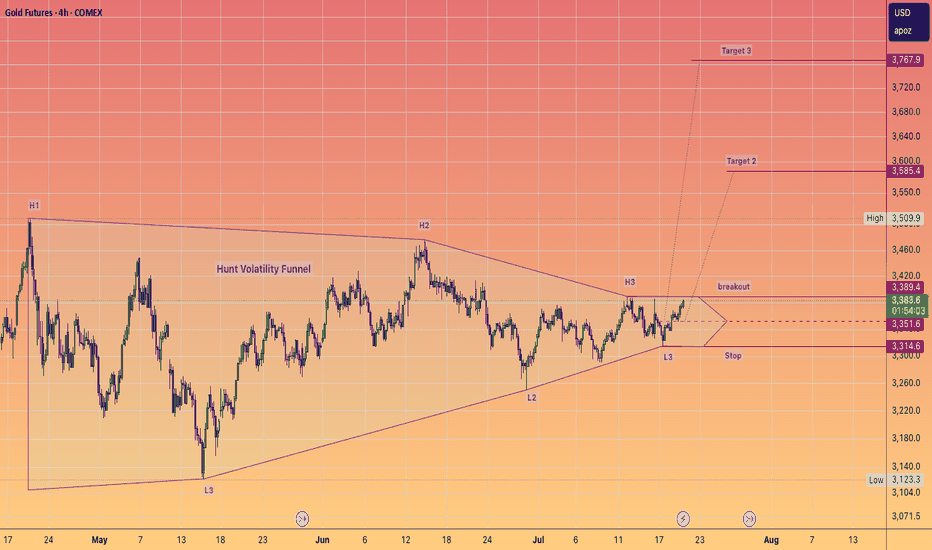
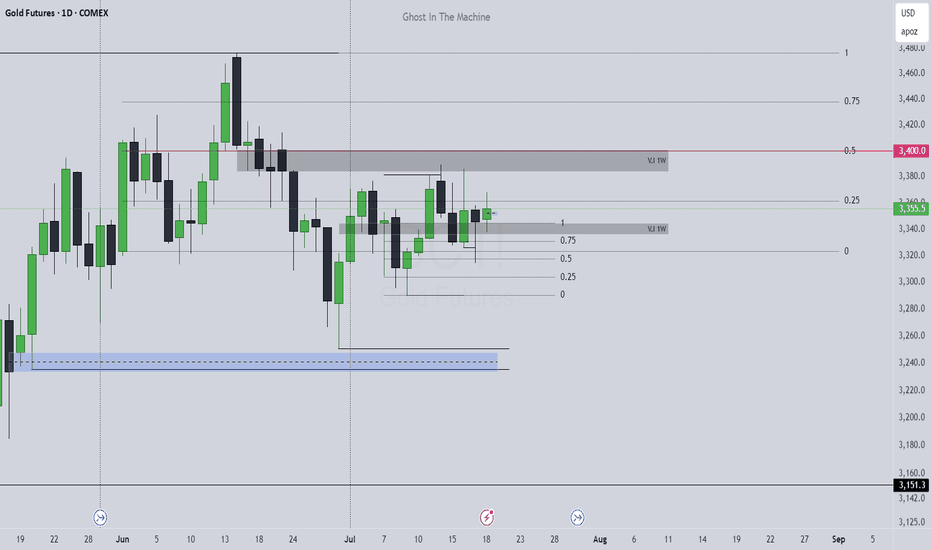
GC1! Gold Futures Weekly Outlook. Expecting Mid week reversalCOMEX:GC1!
Expecting a massive meltdown on Gold after $3400. On the Daily Internal Range Liquidity.
Trading All Time Highs is different compare to trading when you have a data on the left. Very volatile conditions on GOLD. I will buy from a 4H orderflow upto $3400. Then would short from $3400 CME_MINI:NQ1!
E-mini S&P 500 Outlook for next week. Thought process is the same just like NQ1!. Want massive buyside expansion. But weekly profiles need to be there. Tuesday/Wednesday Low of the Week is what I' personally looking for.
So expecting an SMT Divergence on the Previous Weekly Sellside . And then a massive push up.
2nd Stage Distribution on Market Maker Buy Model. Offset it is. Crosshairs on 5529
Gold Above $3,000 and MoreAccording to the World Gold Council, more than 600 tons of gold — valued at around $60 billion — have been transported into vaults in New York. Why are they doing that?
Since Donald Trump election in November, there is around $60 billion worth of gold that has flowed into a giant stockpile in New York.
The reason why physical gold is flowing into the US is because traders are afraid Trump might put tariffs on gold.
Gold Futures & Options
Ticker: GC
Minimum fluctuation:
0.10 per troy ounce = $10.00
Micro Gold Futures & Options
Ticker: MGC
Minimum fluctuation:
0.10 er troy ounce = $1.00
1Ounce Gold Futures
Ticker: 1OZ
Minimum fluctuation:
0.25 per troy ounce = $0.25
Disclaimer:
• What presented here is not a recommendation, please consult your licensed broker.
• Our mission is to create lateral thinking skills for every investor and trader, knowing when to take a calculated risk with market uncertainty and a bolder risk when opportunity arises.
CME Real-time Market Data help identify trading set-ups in real-time and express my market views. If you have futures in your trading portfolio, you can check out on CME Group data plans available that suit your trading needs www.tradingview.com
Trading the Micro: www.cmegroup.com
Is this the Pull Back Zone On Gold XAU GC1! In this video I highlight the potential area for a pull back on Gold Using the TR Pocket and Trend based Extension tool . Using these tools combined we were able to establish a zone of perfect confluence for a downside reaction on Gold. Also I use the new Demonstration Cursor released by Tradingview to highlight the levels on the chart of where my fib pulls were made.
In addition to the above I noticed after completing the video that we have yearly pivots that are untapped around $2580.
CPI on Wednesday may give us the narrative for the reaction up at those highlighted highs and to begin cooling off . I welcome your engagement Boosts comments + follows . Enjoy Ty
Gold Futures Trade Idea
Gold futures have broken out of multi-year resistance levels and are trading near all-time highs. After trending higher for most of 2024, the focus shifts to where prices will move in 2025 and the remaining weeks of the year.
Several macroeconomic factors will influence gold's trajectory, including:
1. Geopolitical landscape
2. Interest rates and inflation outlook
3. Supply and demand dynamics
In the next two weeks, significant data points and economic events will shape the market. Central banks worldwide are set to adjust interest rates. The CME FedWatch Tool indicates that the Federal Reserve is expected to cut rates by 25 bps on December 18, 2024. Key considerations will include any shift in language about future rate cuts and the dot plot from the upcoming meeting. Additionally, the U.S. CPI report, due Wednesday, will be closely watched.
Key Levels to Watch:
Line in the Sand (LIS): 2673.80–2684.50
Resistance: 2740–2760
Support: 2552.50–2566.80
Three Possible Scenarios for Gold Futures Prices:
1. Bullish Break Above LIS:
A breakout and sustained hold above the LIS could push prices higher toward resistance levels. This scenario might be driven by softer CPI data on Wednesday and the Federal Reserve's dovish stance, including potential future rate cuts. A lower inflation environment could provide further tailwinds for gold.
2. Pullback Toward Support:
If prices break and hold below the LIS, clearing recent consolidation lows around 2630, a decline toward the support zone is likely. This scenario aligns with persistent inflation, leading to a "higher for longer" interest rate environment in 2025. Additionally, easing geopolitical tensions under the new U.S. administration could shift focus toward domestic policies, potentially reducing gold's safe-haven appeal.
3. Range-Bound Price Action:
Gold prices could consolidate near current highs, trading within a range below all-time highs. This scenario reflects a lack of decisive inflows or outflows, with market participants waiting for clearer cues to shape the price trajectory in 2025.
As the year concludes, the interplay between macroeconomic factors and technical levels will determine whether gold continues its upward momentum, retraces to support, or stabilizes in a range. Stay tuned for key economic releases to guide near-term price action.
Disclaimer: The views expressed are personal opinions and should not be interpreted as financial advice. Derivatives involve a substantial risk of loss and are not suitable for all investors.
Gold Breaks All-Time-High !Gold surged above $2286 per ounce, marking yet another milestone in its remarkable ascent. This surge has persisted for two consecutive trading days, underscoring the enduring strength of the precious metal.
The driving force behind this meteoric rise is the mounting anticipation of an imminent interest rate cut by the US Federal Reserve in June. Such a move is expected to exert downward pressure on the US Dollar, consequently fueling further gains in Gold prices. Year-to-date, Gold has surged by an impressive 9.8%, with March alone witnessing a staggering increase of nearly 9.4%.
A closer examination from a technical standpoint reveals a bullish breakout from an ascending triangle formation, marked (in blue) which has been taking shape since early 2020. This breakout signals a robust indication of sustained bullish momentum in Gold prices over the long term. For traders, this presents a lucrative opportunity to capitalize on the prevailing bullish bias both in the intermediate and short term.
Going along the phrase of "The trend is your friend", a simple trade below may capture any retracement opportunities along this steep surge.
Entry: 2218
TP: 2320 (can be partial TP or pull up trail stop)
SL: 2149
Copper Futures to target 5.05 after crossing 3.85COMEX
On the weekly chart, a technical pattern has formed and the crossing confirmation above 3.85 will push the price up to 5.05 passing through several levels of resistance - shown on the chart.
Trading above 5.05 for more than a month, the long term target will be 5.6
Stop loss should be considered - 3.75
Gold up from here! Its gonna be the big oneYou can see very clearly why gold will break into its mew price territory. I used my own method of triangulation that has proven to be fairly accurate up to most of the time. I think that gold will become very expensive and soon become 5000 dollars but not before it bounces off of 3000 first then back up to test ath. 5000 next move take pay. Wave 2 8500 expected march 2023. Like and follow