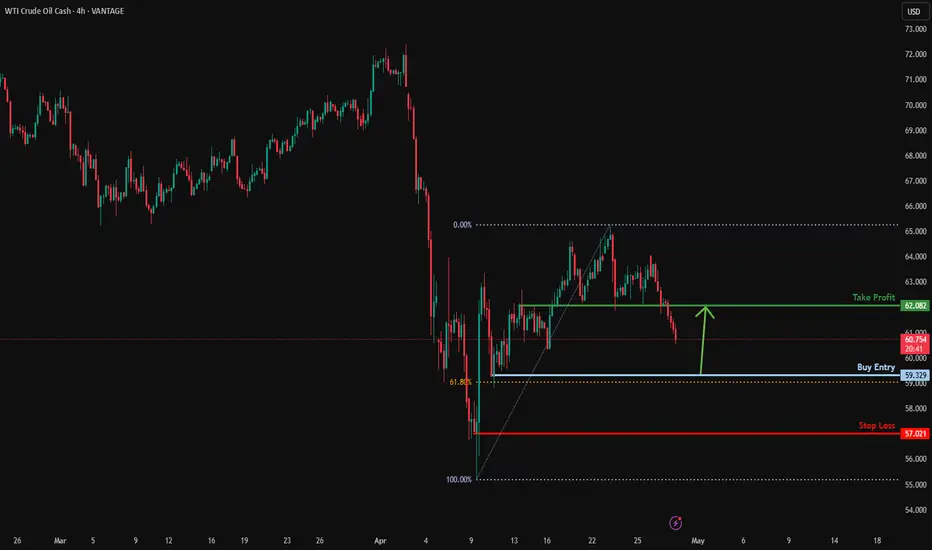
Could the price bounce from here?USO/USD is falling towards the support level which is a pullback support that lines up with the 61.8% Fibonacci retracement and could bounce from this level to our take profit.
Entry: 59.32
Why we like it:
There is a pullback support level that lines up with the 61.8% Fibonacci retracement.
Stop loss: 57.02
Why we like it:
There is a pullback support level.
Take profit: 62.08
Why we like it:
There is an overlap resistance level.
Enjoying your TradingView experience? Review us!
Please be advised that the information presented on TradingView is provided to Vantage (‘Vantage Global Limited’, ‘we’) by a third-party provider (‘Everest Fortune Group’). Please be reminded that you are solely responsible for the trading decisions on your account. There is a very high degree of risk involved in trading. Any information and/or content is intended entirely for research, educational and informational purposes only and does not constitute investment or consultation advice or investment strategy. The information is not tailored to the investment needs of any specific person and therefore does not involve a consideration of any of the investment objectives, financial situation or needs of any viewer that may receive it. Kindly also note that past performance is not a reliable indicator of future results. Actual results may differ materially from those anticipated in forward-looking or past performance statements. We assume no liability as to the accuracy or completeness of any of the information and/or content provided herein and the Company cannot be held responsible for any omission, mistake nor for any loss or damage including without limitation to any loss of profit which may arise from reliance on any information supplied by Everest Fortune Group.
Commmodities
Bearish drop?XAU/USD is rising towards the resistance level which is a pullback resistance that aligns with the 38.2% Fibonacci retracement and could reverse from this level to our take profit.
Entry: 3,419.43
Why we like it:
There is a pullback resistance that lines up with the 38.2% Fibonacci retracement.
Stop loss: 3,458.51
Why we like it:
There is a pullback resistance level that is slightly above the 61.8% Fibonacci retracement.
Take profit: 3,355.45
Why we like it:
There is a pullback support level that is slightly below the 61.9% Fibonacci retracement.
Enjoying your TradingView experience? Review us!
Please be advised that the information presented on TradingView is provided to Vantage (‘Vantage Global Limited’, ‘we’) by a third-party provider (‘Everest Fortune Group’). Please be reminded that you are solely responsible for the trading decisions on your account. There is a very high degree of risk involved in trading. Any information and/or content is intended entirely for research, educational and informational purposes only and does not constitute investment or consultation advice or investment strategy. The information is not tailored to the investment needs of any specific person and therefore does not involve a consideration of any of the investment objectives, financial situation or needs of any viewer that may receive it. Kindly also note that past performance is not a reliable indicator of future results. Actual results may differ materially from those anticipated in forward-looking or past performance statements. We assume no liability as to the accuracy or completeness of any of the information and/or content provided herein and the Company cannot be held responsible for any omission, mistake nor for any loss or damage including without limitation to any loss of profit which may arise from reliance on any information supplied by Everest Fortune Group.

Could the Silver reverse from here?The price is rising towards the pivot which has been identified as a pullback resistance that lines up with the 138.2% Fibonacci extension and could reverse to the 1st support which is an overlap support.
Pivot: 34.86
1st Support: 32.94
1st Resistance: 36.08
S&P500 (US500) is falling towards the pivot which acts as a pullback support and could bounce to the 1st resistance which is an overlap resistance.
Pivot: 5,405.74
1st Support: 5,176.07
1st Resistance: 5,769.85
Risk Warning:
Trading Forex and CFDs carries a high level of risk to your capital and you should only trade with money you can afford to lose. Trading Forex and CFDs may not be suitable for all investors, so please ensure that you fully understand the risks involved and seek independent advice if necessary.
Disclaimer:
The above opinions given constitute general market commentary, and do not constitute the opinion or advice of IC Markets or any form of personal or investment advice.
Any opinions, news, research, analyses, prices, other information, or links to third-party sites contained on this website are provided on an "as-is" basis, are intended only to be informative, is not an advice nor a recommendation, nor research, or a record of our trading prices, or an offer of, or solicitation for a transaction in any financial instrument and thus should not be treated as such. The information provided does not involve any specific investment objectives, financial situation and needs of any specific person who may receive it. Please be aware, that past performance is not a reliable indicator of future performance and/or results. Past Performance or Forward-looking scenarios based upon the reasonable beliefs of the third-party provider are not a guarantee of future performance. Actual results may differ materially from those anticipated in forward-looking or past performance statements. IC Markets makes no representation or warranty and assumes no liability as to the accuracy or completeness of the information provided, nor any loss arising from any investment based on a recommendation, forecast or any information supplied by any third-party.

Could the price drop from here?The Gold (XAU/USD) has reacted off the pivot and could drop to the pullback support.
Pivot: 3,052.78
1st Support: 3,020.46
1st Resistance: 3,059.37
Risk Warning:
Trading Forex and CFDs carries a high level of risk to your capital and you should only trade with money you can afford to lose. Trading Forex and CFDs may not be suitable for all investors, so please ensure that you fully understand the risks involved and seek independent advice if necessary.
Disclaimer:
The above opinions given constitute general market commentary, and do not constitute the opinion or advice of IC Markets or any form of personal or investment advice.
Any opinions, news, research, analyses, prices, other information, or links to third-party sites contained on this website are provided on an "as-is" basis, are intended only to be informative, is not an advice nor a recommendation, nor research, or a record of our trading prices, or an offer of, or solicitation for a transaction in any financial instrument and thus should not be treated as such. The information provided does not involve any specific investment objectives, financial situation and needs of any specific person who may receive it. Please be aware, that past performance is not a reliable indicator of future performance and/or results. Past Performance or Forward-looking scenarios based upon the reasonable beliefs of the third-party provider are not a guarantee of future performance. Actual results may differ materially from those anticipated in forward-looking or past performance statements. IC Markets makes no representation or warranty and assumes no liability as to the accuracy or completeness of the information provided, nor any loss arising from any investment based on a recommendation, forecast or any information supplied by any third-party.

Bearish drop?WTI Oil (XTI/USD) is rising towards the pivot and could drop to the 2st support level which is an overlap support that aligns with the 161.8% Fibonacci extension.
Pivot: 71.47
1st Support: 69.15
1st Resistance: 72.74
Risk Warning:
Trading Forex and CFDs carries a high level of risk to your capital and you should only trade with money you can afford to lose. Trading Forex and CFDs may not be suitable for all investors, so please ensure that you fully understand the risks involved and seek independent advice if necessary.
Disclaimer:
The above opinions given constitute general market commentary, and do not constitute the opinion or advice of IC Markets or any form of personal or investment advice.
Any opinions, news, research, analyses, prices, other information, or links to third-party sites contained on this website are provided on an "as-is" basis, are intended only to be informative, is not an advice nor a recommendation, nor research, or a record of our trading prices, or an offer of, or solicitation for a transaction in any financial instrument and thus should not be treated as such. The information provided does not involve any specific investment objectives, financial situation and needs of any specific person who may receive it. Please be aware, that past performance is not a reliable indicator of future performance and/or results. Past Performance or Forward-looking scenarios based upon the reasonable beliefs of the third-party provider are not a guarantee of future performance. Actual results may differ materially from those anticipated in forward-looking or past performance statements. IC Markets makes no representation or warranty and assumes no liability as to the accuracy or completeness of the information provided, nor any loss arising from any investment based on a recommendation, forecast or any information supplied by any third-party.

Gold Struggles at Trendline Resistance: What’s Next?Gold Weekly Analysis
Trendline Resistance:
Gold's price has repeatedly struggled to break above the rising trendline, signaling strong resistance in this area.
Support Zone Strength:
The previous resistance zone has flipped into a solid support level, providing a safety net for any pullbacks.
Next Move:
A breakout above the trendline could trigger a strong bullish continuation.
A rejection here may lead to a pullback, with support near $2,387 acting as the critical level to monitor.

WTI OIL 4H Death Cross. Trade the break-outs.WTI Oil (USOIL) formed yesterday a Death Cross on the 4H time-frame, the first such (bearish) formation in almost 2 months (since November 17 2022). The price got rejected exactly on both the 4H MA50 (blue trend-line) and 4H MA200 (orange trend-line) following last week's rejection (January 03) on the 1D MA50 (yellow trend-line). We covered this on our last week analysis:
The only pattern that is in favor of Oil rising is the Channel Up of October 18 to November 07, which held the Medium-term Support. A similar Channel Up can re-test the 1D MA50 but as always on risky set-ups, it is best to trade the break-out. That is the 76.70 Resistance, between the 4H MA200 and 4H MA50.
On the downside, a break below the 72.50 Support, targets a Lower Low on the long-term Channel Down (dashed) close to 68.00.
As before, keep an eye on the 1D RSI, which has a clear Lower Highs trend-line that offers solid sell entries.
-------------------------------------------------------------------------------
** Please LIKE 👍, FOLLOW ✅, SHARE 🙌 and COMMENT ✍ if you enjoy this idea! Also share your ideas and charts in the comments section below! **
-------------------------------------------------------------------------------
💸💸💸💸💸💸
👇 👇 👇 👇 👇 👇

Oil Struggles to Recover $90Oil seems to have bottomed out at $85.55. We saw good support from green triangles on the KRI, and a subsequent pivot back to the high $80's. We are now just below $90, with $90.06 in particular being the level to break before attaining higher levels. We should see significant resistance there. The Kovach OBV is bearish and keeps pressing lower. If we fail to test the $90's, then $85.55 should provide support, with the next support levels below including $84.75 and $83.76.

Are Feeder Cattle Setting Up for a Bigger Directional Move?Feeder Cattle
Technicals (August): Feeder cattle made an attempt to breakout yesterday but fell flat, despite the bloodbath in the grain complex. As mentioned in recent reports, the inability to take out recent highs with the collapse in grains should be a caution flag for the Bulls. That’s not to say we can’t rally from here, but the recent price action has been dismal. Perhaps feeders were pricing in a breakdown in corn prices for a while now, that’s the first thought that comes to mind. Nonetheless, the market is consolidating and looks ready for a bigger directional move once support or resistance gives way.
Resistance: 175.35-175.65****, 176.80-177.075***
Pivot: 171.45 -172.40
Support: 169.40**, 167.325**
Futures trading involves substantial risk of loss and may not be suitable for all investors. Trading advice is based on information taken from trade and statistical services and other sources Blue Line Futures, LLC believes are reliable. We do not guarantee that such information is accurate or complete and it should not be relied upon as such. Trading advice reflects our good faith judgment at a specific time and is subject to change without notice. There is no guarantee that the advice we give will result in profitable trades. All trading decisions will be made by the account holder. Past performance is not necessarily indicative of future results.

Copper breaking outTechnical Analysis
As you can see in the chart, every red square is showing a consolidation period, followed by a strong rally.
Today's action is showing strength as we are seeing a potential breakout, outside the 1-month consolidation period.
Trade setup
The light-blue arrows are potential measured moves. However, I would follow the 5sma or 10sma, as a stop-exit for 50% of your position.
Fundamental Analysis
There is some concern around inflation, all though the Fed maintains he believes it will be transitory.
Here is the way I follow inflation, which is a free chart by the Federal Reserve Economic Data :
fred.stlouisfed.org
Another way is with the TIP etf.

Natural Gas 9 novembernatural gas has declined significantly but winter is here so demand for it is there.
predicting a bearish movement unless it hits my sl
please like and follow for updates

$USOIL #CRUDEOIL - Buying @ 41 into $42+, Invalid below 40like the technicals here & price and time theory correlates nicely with this move
been tracking this one for a while (related)
think its time for oil to follow the other commodities such as gold and silver's lead and rally to the upside this week
Entry around 41 invalid below $40 key level... initial profit taking @ $42 and move stops to break even to make the trade risk free

Gold - Hot metalGold (1H) - intraday bullish bias
The bullion rallied above the 1527 resistance with a strong momentum, which indicates that buyers are getting more confident. The RSI pulled back from the over-bought area for a cool down, we can expect the price to consolidate for a few hours near the moving averages and the trendline before moving up towards 1540. The uptrend stays intact as long as the trendline is respected.
Key support: 1524/1516
Key resistance: 1535/1544

WTI - Fill the gapWTI (1H) - intraday bearish bias
The oil price is likely to stay in retreat as it is filling the gap left by the Sunday gap. Buyers are likely to be lurking around the psychological level of 58, which coincides with the 61.8% Fibonacci retracement level. Though the 20-hour moving average has proved to be a solid resistance level and we can expect the price to stay under pressure in the short-term.

Gold Class today for historic "SEPTEMPER"The shiny yellow metal trading with full bear potential, which is meant to be limited as FOMC scheduled later at 2:00 NY Time.
Potential Areas:
$1186
$1198
Tradings are recommended to be taken with breakout strategy to either direction.
Along $5 of stops.
Positions to be hold till LME session the next day.

Silver (July/18) AnalysisSilver
We are in the deep sell-down mode lately and there is no end in sight at this moment.
It shall go lower as there are more bear forces are in it.
I foresee a strong support nearly at $14.5. So, the sell is still the better bet.
Press "Like" and "Follow".
Sonic
Disclaimer:
The information contained in this presentation is solely for educational purposes and does not constitute investment advice. We may or We may not take the trade.
The risk of trading in securities markets can be substantial. You should carefully consider if engaging in such activity is suitable to your own financial situation.
We, Sonicr Mastery dot com is not responsible for any liabilities arising from the result of your market involvement or individual trade activities.

Possible short on silver ? Daily bearish engulfing creating an all new low for the year. Heat still around the trade war so greenback will be showing strength, the least resisted area now is 15.60 ? Further retest passed fib area is likely due to volatility in the commodity.
Opinion not a position.

I WARNED GOLD BULLS BUT...CRUCIAL AREA FOR GOLD'S FUTURE!As i tried to warn the Gold's bulls about this ''fake rally'' at my previous article now it's good time to start to search for a reversal area.
Gold as most metals are still in a bear market.From the long-term view on gold we can undesrtand that after the 5 wave structure of the 5 Elliott waves we can are in a A-B-C correction waves as mentioned in previous article.
Now of course the hawkish F.O.M.C played a role at recent Gold's rally but this was something it has been expected a lot time now so of course it's priced in our technical analysis.
The question is if Gold can keep this short-term ascending channel or mid and long term trend will remain bearish.
TECHNICAL OBSERVATIONS
1.As we can see at the chart Gold moved until the 1.618 Fibonacci extension from the initial uptrend move(AB).
2.We warned you that there is no too much space for Gold's Bulls as a lot of factors palyed role explained in article below.
3.If we take the Fibonacci extension from the last swing up we can notice that the well respected 1.618 Fibonacci extension comes at 1,237$/ounce area and coincides with a lot of facts that's why is very important.
4.At the 1,240$/ounce area we have:
a.Previous support/resistance level.
b.We have the 200EMA.
c.We also have the bottom trend line of the short-term ascending channel.
d.The 1.618 Fibonacci extension of the last upward swing as mentioned (CD).
e.We also have the 61.8% Fibonacci retracement of the bigger upward swing (ED).
For all the reasons mentioned this area is very important area as if this area doesn't help gold for a bounce is a bearish sign and we are looking for further downward continuation at S/R levels shown at the chart with blue dotted lines,if this area provides a support level for gold we should gradually another effort of Gold to break the 1,300$/ounce area.
No matter what will happen we will keep you informed for more profits.
Thank you for support.
Happy trading guys!

IS CRUDE'S OIL FALL OVER?After so many recent facts occured regarding the crude oil and energy sector generally it wouldn't be possible to analyze it correctly in one article and that's why i am not going to talk about the changes on ''fundamentals'' of Crude Oil,if you can call them this way.
So i will exclude the decision of president Trump to cancel the Paris climate agreement,the tension between the Qatar and nearby countries and the enlargement of O.P.E.C agreement and many others factS and I will focus on the chart as technical analyst listening only the price.
TECHNICALLY OBSERVATIONS:
1.Price moved below 200EMA.
2.200EMA started to sloping downwards.
3.We can notice 2 channels the mid-term descending channel and the short-term ascending channel.
4.We are about to have a bullish Bat pattern.
5.We have a bullish RSI divergence.
6.Stochastics are in oversold area.
7.We have a strong support at these levels as price had bounced back from these levels at the past.
8.If we take the Fibonacci extensions of the two legs AB and BCwe can see that it perfectly coincides with the support area.
9.Everytime we bounved back from these levels we had a strong green candle.This time we can see a weak price action and two doji candles if today price close at these levels which is a bearish continuation formation that's why i believe we are going to see a litle further downward move to Bat pattern completion before we bounce back.
10.Also if price retrace to those levels we have a re-test of bottom trend line of the short-term descending channel.
POSSIBLE TRADE:
PLACE PENDING ORDER AT BAT PATTERN COMPLETION 43.35$
FIRST TARGET T1 AT 47.50$ WITH P/L RATIO 2.15
SECOND TARGET AT 50$ WITH P/L RATIO 3.50
STOP LOSS AT 41.60
THANK YOU FOR SUPPORT!
HAPPY TRADING!

Brent oil - More gains on hourly closing above $49.38 Hourly chart pattern - bearish price RSI divergence
Resistance - $50.00, $50.89, $52.00
Support - $47.79, $46.80, $45.32
Brent appears poised to test psychological level of $50.00 if prices confirm a close above $49.38 on hourly chart. Moreover, such a closing would negate the bearish price RSI divergence on the hourly chart.
Failure to do so could trigger a minor technical correction in oil prices.
However, bullish invalidation is seen only if prices see a day end closing below $48.26, in which case we would have a bearish price RSI divergence on the daily chart.
